
In this tutorial, we’re going to learn how to unpivot columns in Power BI, and understand the importance of doing it inside our data models. When working on data inside Power BI, we generally want it to be in an unpivoted format. This is the most optimized way a table can be set up for all the DAX calculations that we’re going to run over the raw data once it’s integrated into our model in Power BI.
The Unpivot Columns feature in Power BI converts the data headers stored horizontally into a vertical format.
When unpivoting columns, we need to know where we can get information that’s exactly the same or have similar nature with the columns inside our tables.

Analyzing The Exchange Rates Table
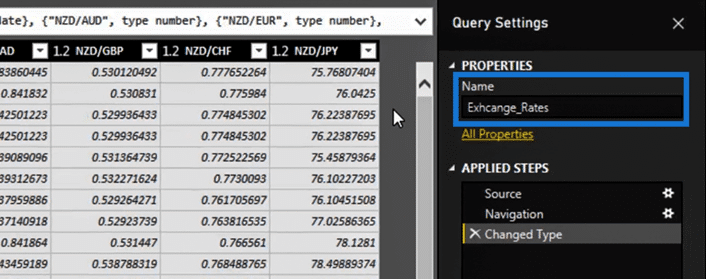
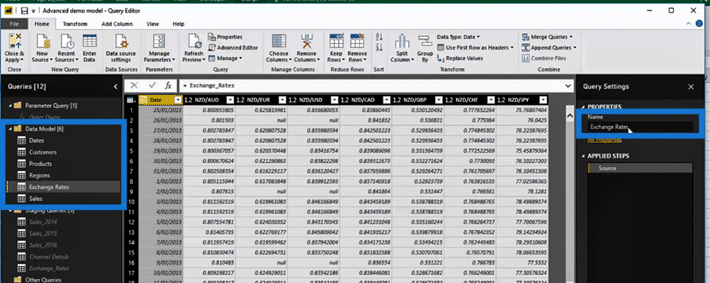
Let’s analyze this Exchange Rates table which is a perfect example to show the importance of unpivoting columns in Power BI. Noticeably, all these numbers are the same as they are all exchange rates.
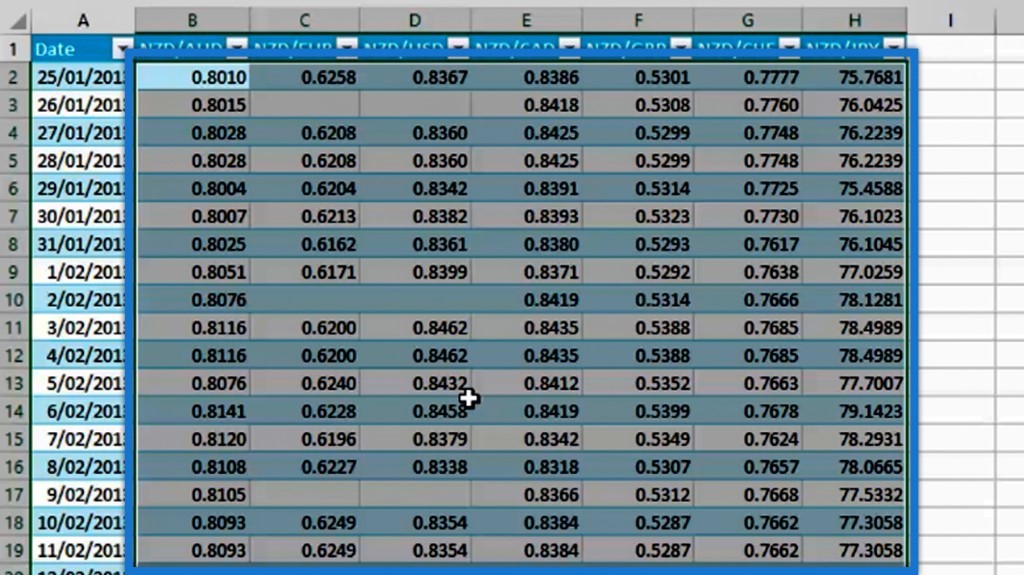
Instead of having them in different columns, it’s more efficient to have them in just one column. This is because when we’re doing calculations, we want to look over a single column instead of looking over seven different ones to find the corresponding exchange rate that we need.
Another example is our titles here. As you can see, these are all about exchange rates, which is the same type of information. So, we need to get them into one column instead of seven. If we leave them as seven columns, it’s not possible to join a master exchange rate information table with this particular table.
The contents of the master table are the foreign currency, local currency, full exchange rates, and an alternative way to reference the exchange rate. These are all different dimensions that we might want to put into our visualizations.
Connecting The Demo Data
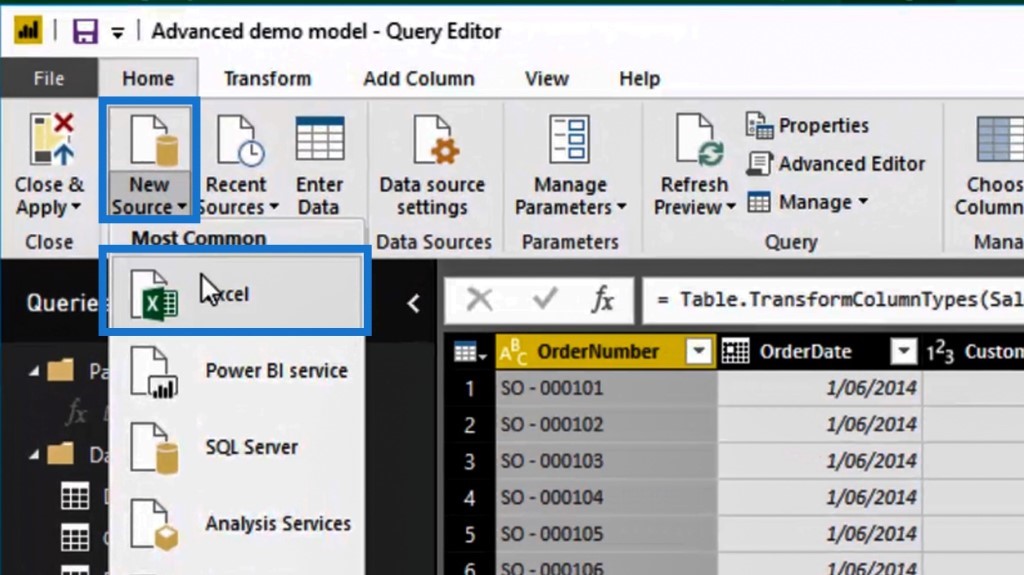
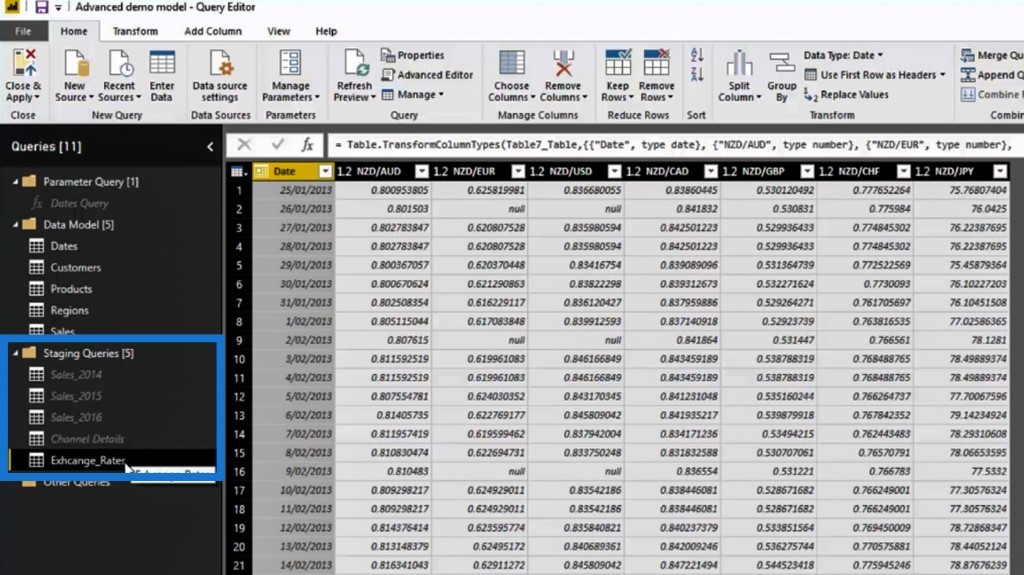
Let’s now start with connecting our European Sales Organisation Demo Data by clicking Excel within the New Source option.
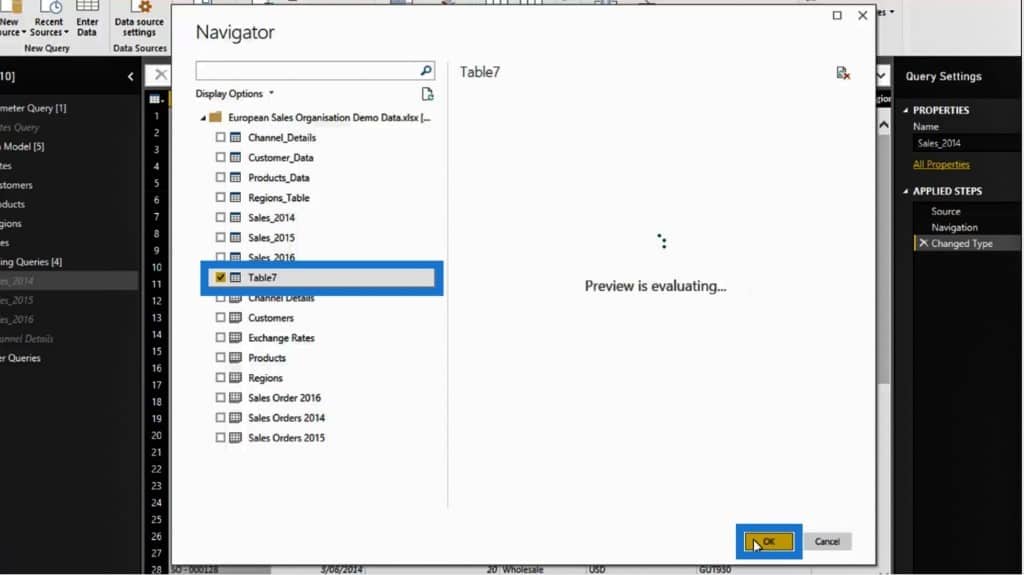
From the Navigator window, select Table7 then click the OK button.
Rename Table7 to Exchange_Rates.

Let’s move this table into our Staging Queries group.
Then, disable the load option.
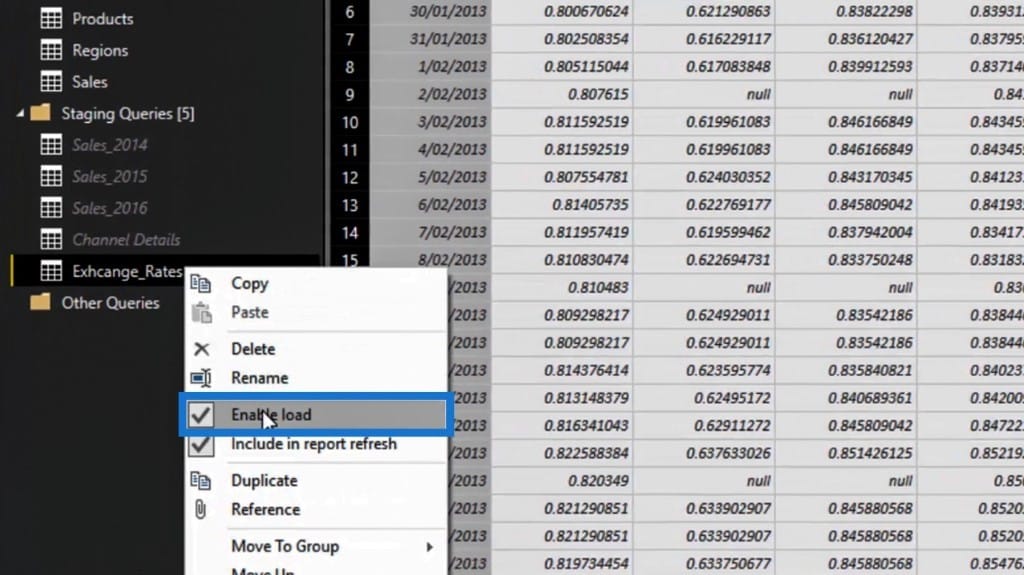
We need to leave this as a staging query because we’re going to make a number of transformations on it.
The next thing that we’re going to do is to reference it.
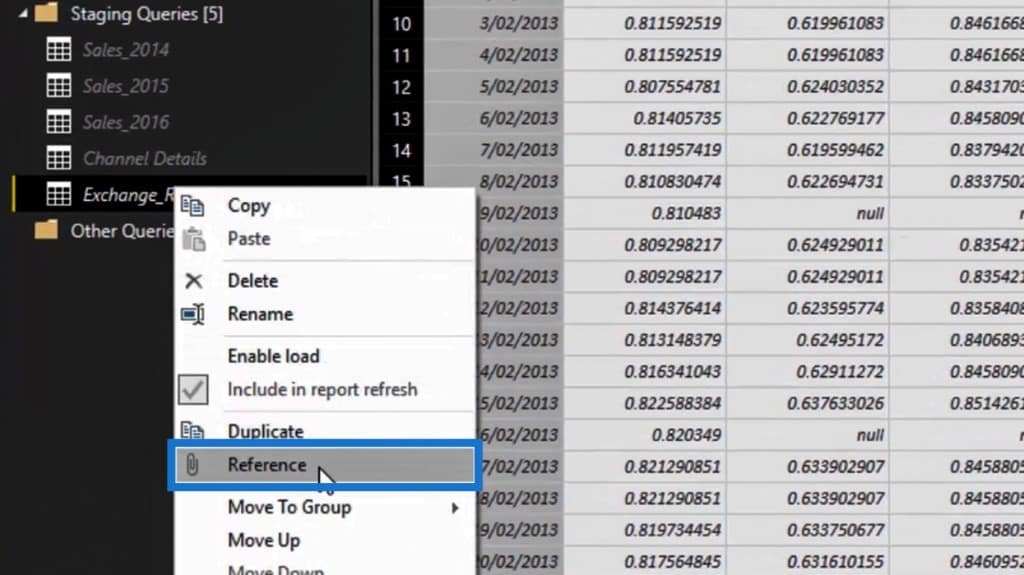
Then, let’s move this reference table into our Data Model group, and name it Exchange Rates.
Unpivoting The Columns
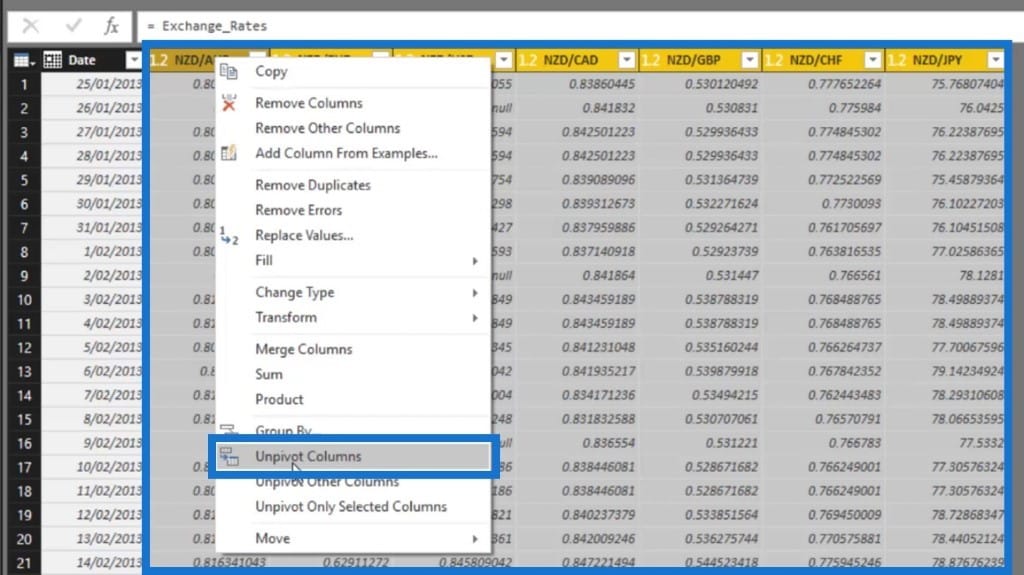
Let’s start to unpivot the columns in this table. There are two ways to do this. The first option is to multi-select these seven columns by holding the Shift key. Then, select the Unpivot Columns option.
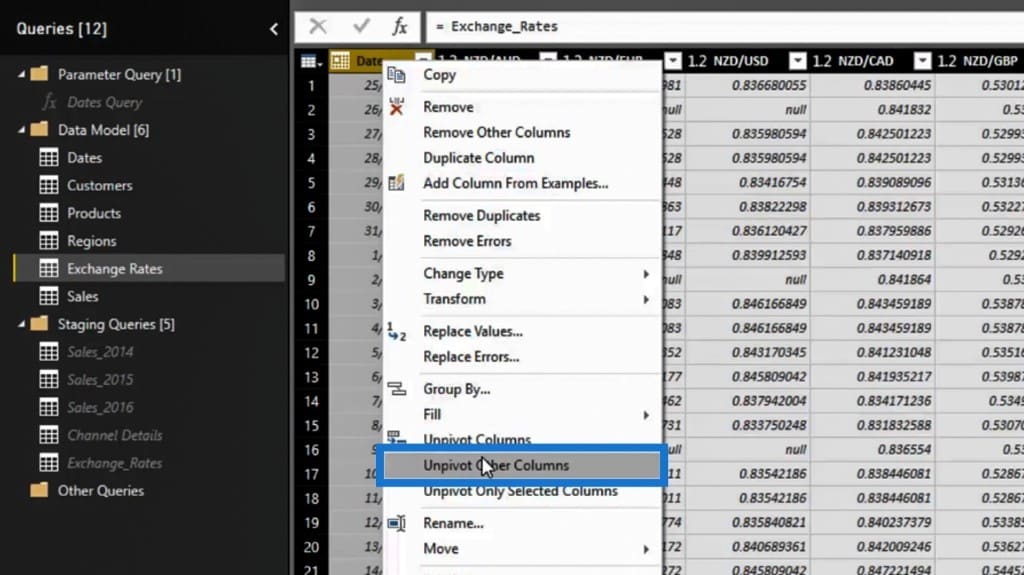
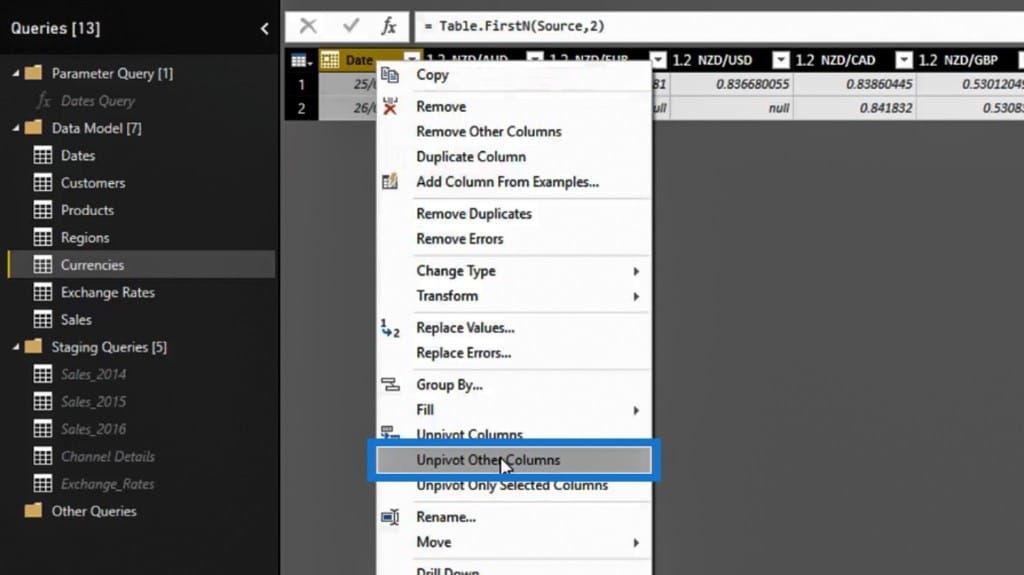
Now, let’s use the other way of unpivoting columns in Power BI. Right click on the Data column, then select the Unpivot Other Columns option.
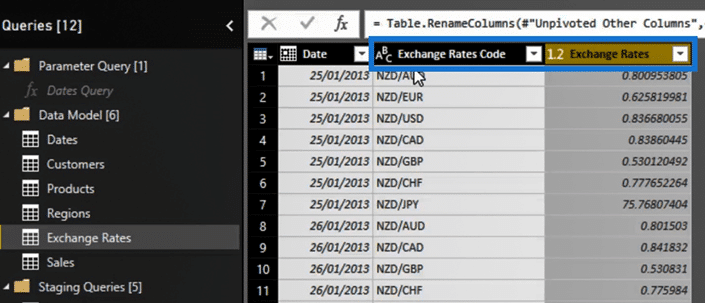
Now, we’ll see that our Exchange Rates table has changed. It moved all the title attributes and exchange rates values into just one column, which is exactly how we want it to be.
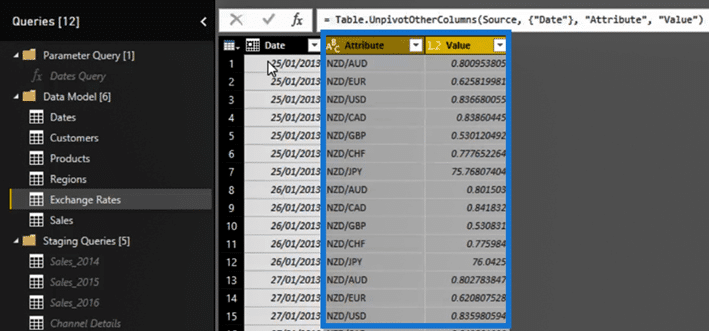
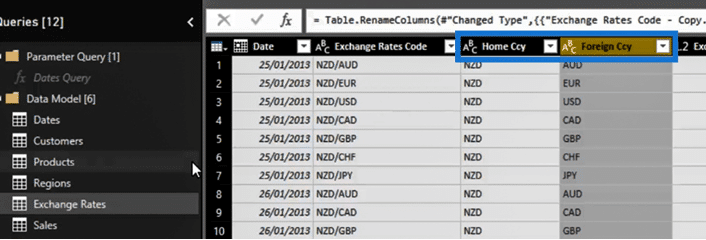
Let’s then rename the Attribute column into Exchange Rates Code, and the Value column into Exchange Rates. We couldn’t do this before because everything was scattered in different columns. But now, this brings us a single similar dimension into one column.
Applying Additional Transformations After Unpivoting Columns In Power BI
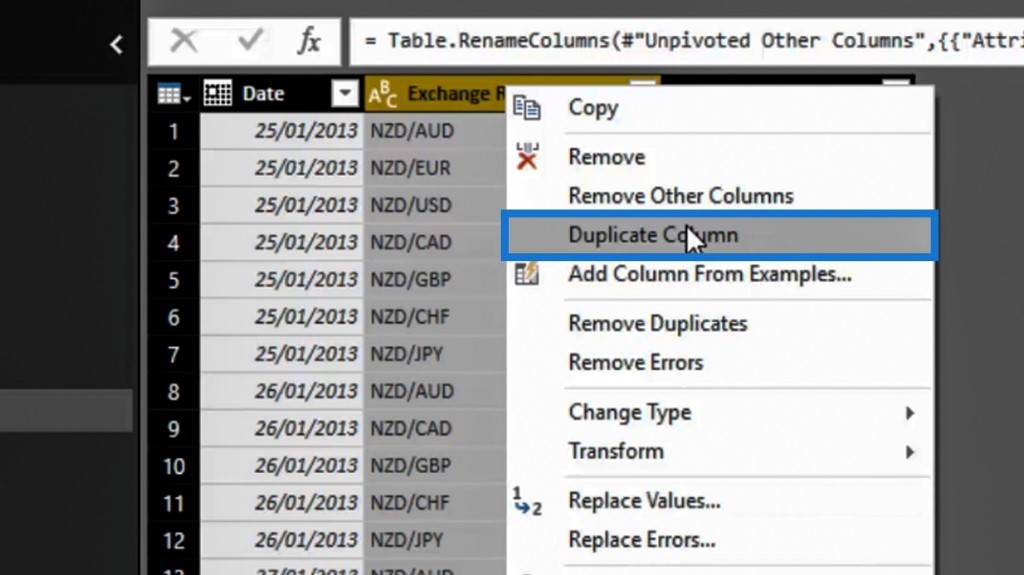
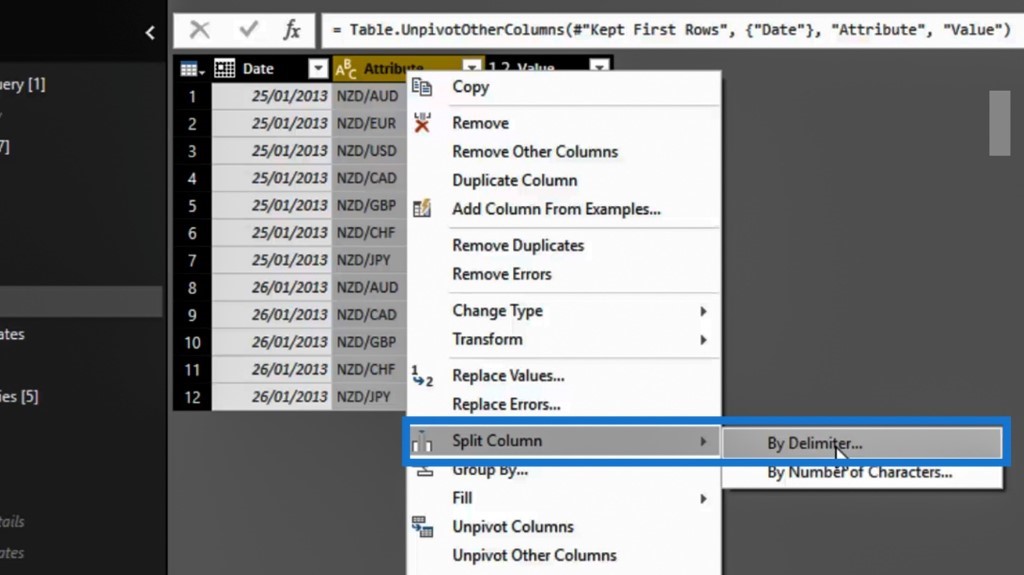
Let’s now make additional transformations in this table. First, let’s right click on the Exchange Rates Code column, then select the Duplicate column option.
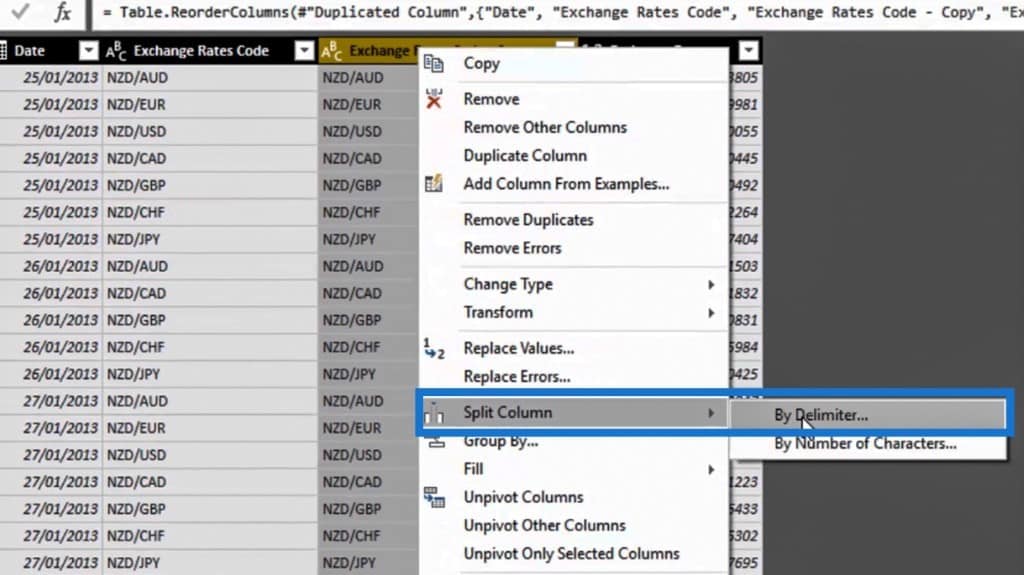
Then, move it next to the Exchange Rates Code column and right click on it. After that, select the By Delimiter option within the Split Column option.
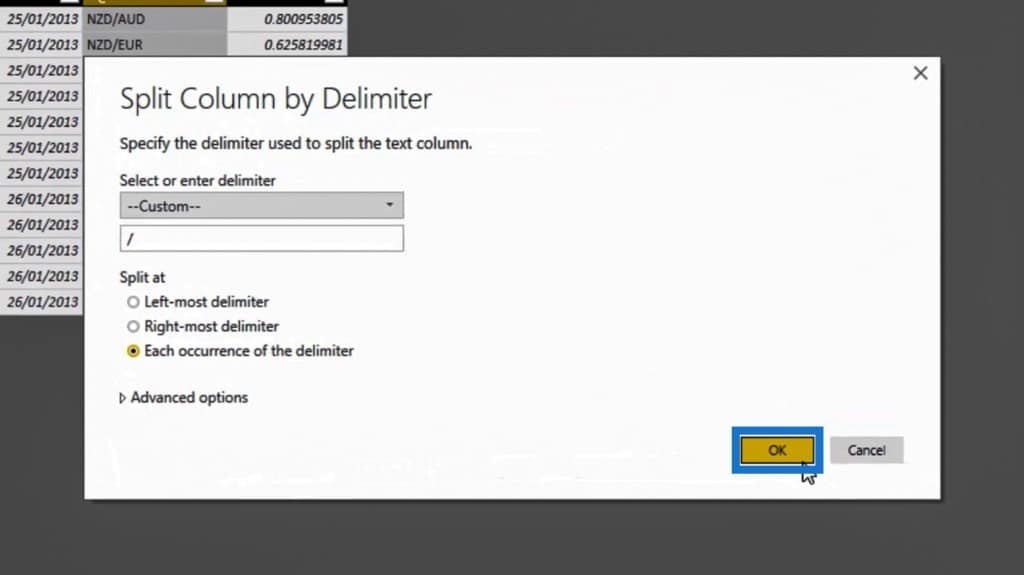
Within the Split Column by Delimiter popup box, just click the OK button.
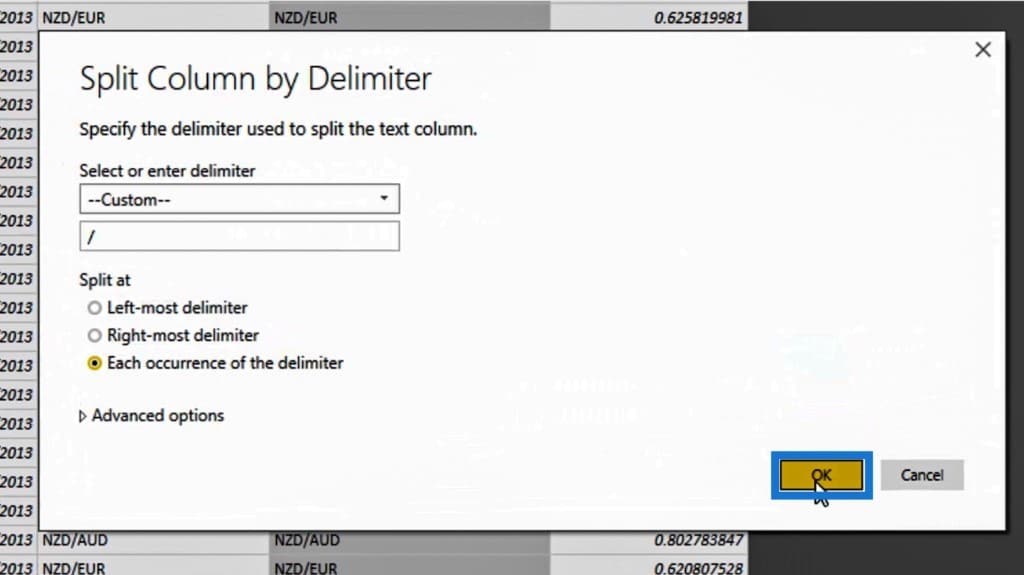
It will then add these additional two columns. Let’s rename the Exchange Rates Code – Copy.1 column into Home Ccy, and the Exchange Rates Code – Copy.2 column into Foreign Ccy.
If we look at our Exchange Rates table, we’ll realize that it’s a fact table since we’re going to build relationships between the dates. This will enable us to reference a particular exchange rate. However, we also want to create a lookup table out of the foreign currency, then make a link to both our Sales table and Exchange Rates table.
Creating A Lookup Table After Unpivoting Columns In Power BI
Right click on the Exchange Rates table under our Staging Queries group. Then, let’s reference this again.

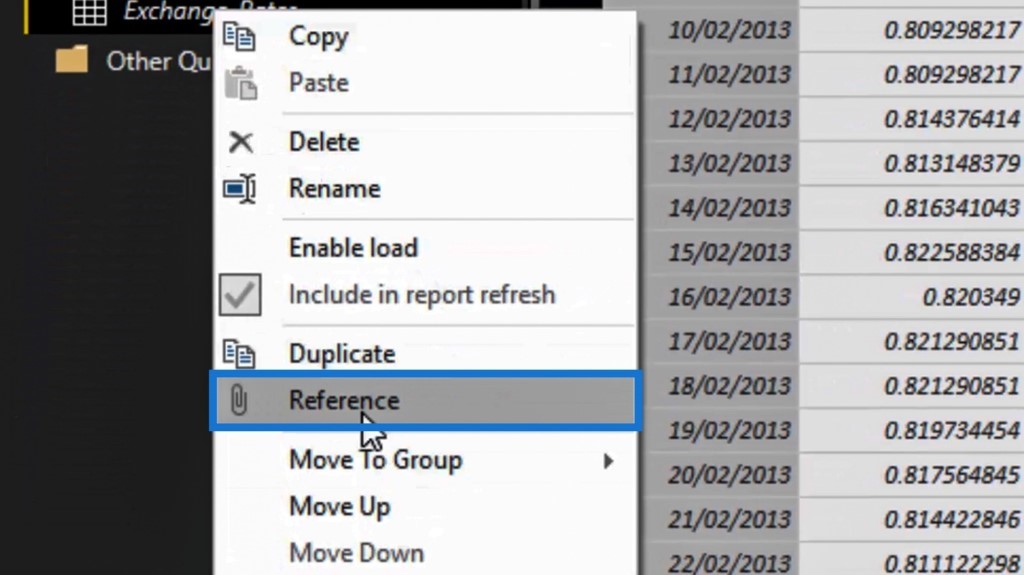
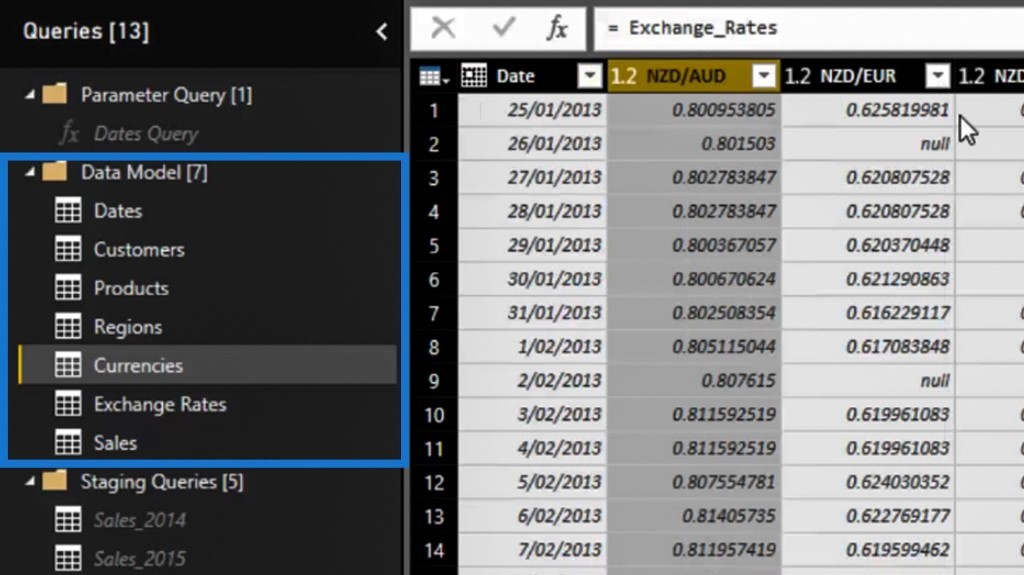
Move the reference table again into our Data Model group and rename it into Currencies.
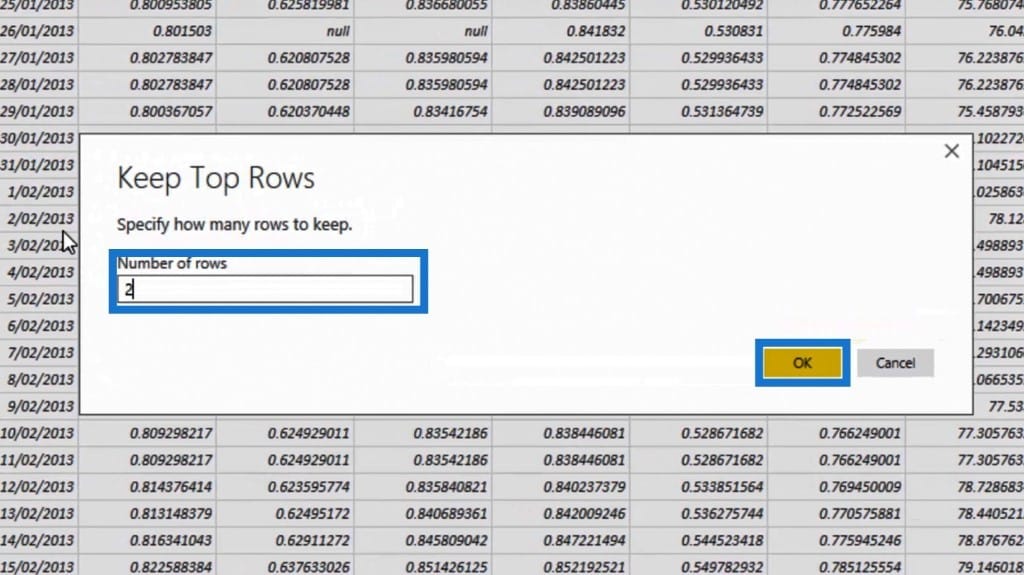
We’ll then remove a few rows in this table because we don’t need them. So, let’s click on the row transformation icon and then select the Keep Top Rows option.
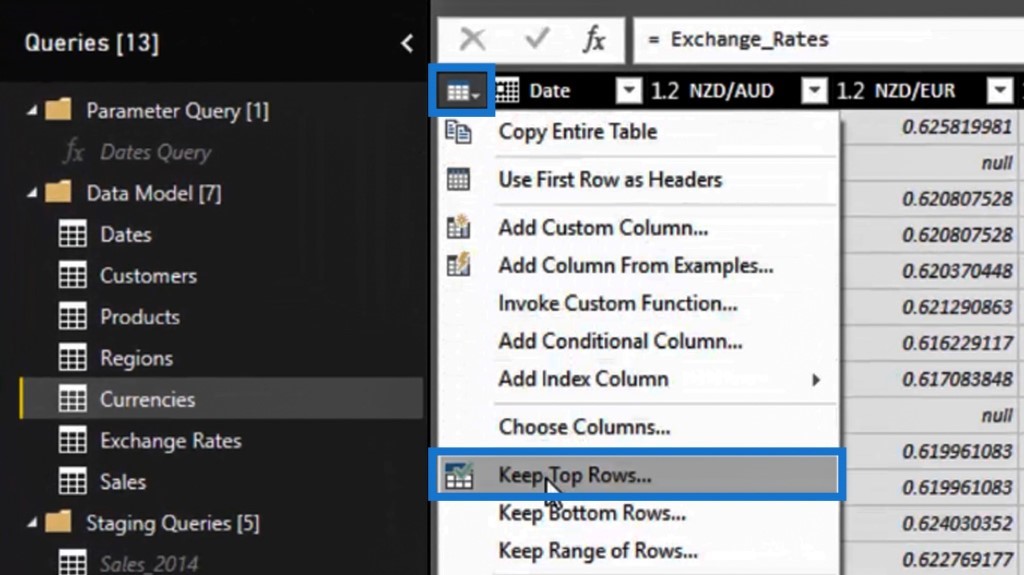
On the popup window, let’s input 2 for the Number of rows, then click the OK button.
After removing the other rows, right click on the Dates column and select the Unpivot Other Columns option.
Let’s then right click on the Attribute column again to select the Split Column and the By Delimiter option.
On the popup window, just click the OK button again.
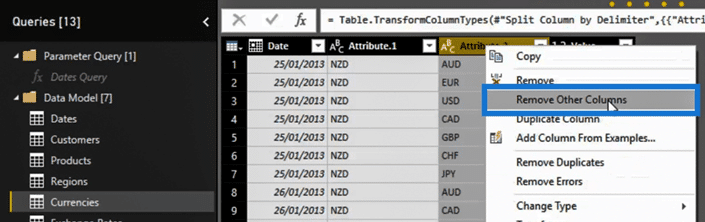
The next thing that we’re going to do, which is different from the previous one, is to right click on the Attribute.2 column. Then, select the Remove Other Columns option.
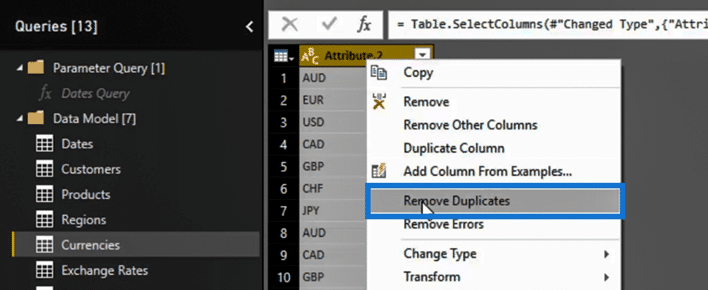
Right click on it again and select the Remove Duplicates option.
Rename it to Currency Types.
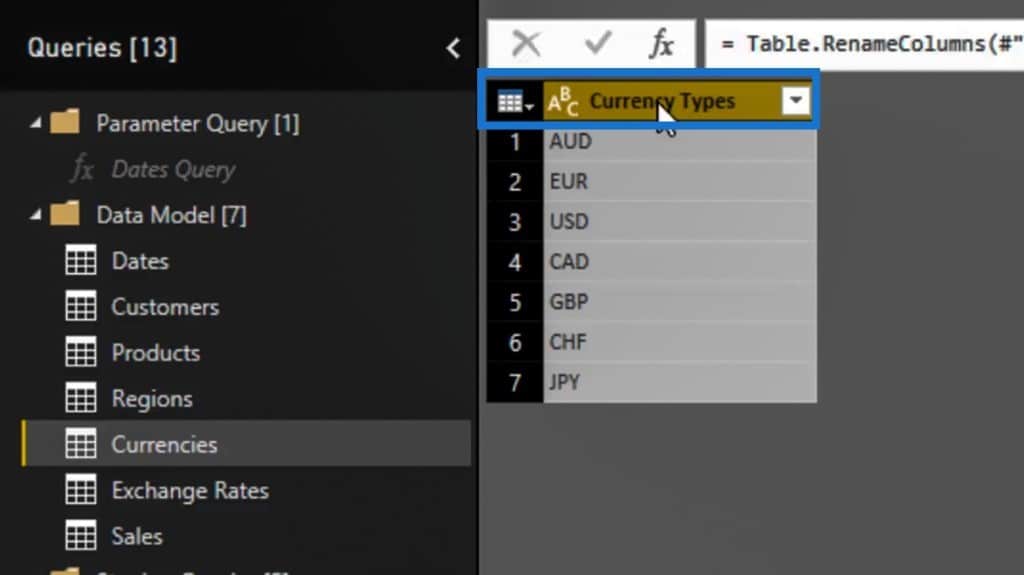
Finally, we have this table of unique currency types. We can use this as a lookup table to join the actual Exchange Rate and Sales table, which has a currency code as well.
We can also add additional columns on top of this, where we can write different codes or different ways that we want to represent codes. Furthermore, we can put a column here that indicates the last exchange rate or something similar to it. This gives us more flexibility around our model.
*****Related Links*****
My Practice Tips When Using The Power BI Advanced Editor
Power BI Query Parameters: Optimizing Tables
Unpivot And Pivot Basics In Power BI – Query Editor Review
Conclusion
One of the many advantages of this technique is that any semi-formatted or unformatted data can be easily evaluated if brought to the state where we first saw the row-column arrangement.
These are the things that we can achieve when we unpivot columns in Power BI and utilize the other transformations. Using all of them together is an effective way to generate the real power of the query editor.
Sam


