
If you had the opportunity to view the detailed date table tutorial that I ran through in a previous post, you will find that most of the supporting date columns like months, quarters, and financial years are generally made up for a standard calendar date table. In a lot of cases though, you need to get financial quarters aligned to the correct months using a calculated column. You may watch the full video of this tutorial at the bottom of this blog.
Doing this with a code within the Query Editor can be a little bit too much for a lot of users.
So, I have decided to create a video on how you can utilize Calculated Column Logic to implement the custom financial quarters that you may require within your date table and for your organization.

We will go over a common problem which I often hear about, and which has something to do with financial years. I’ve already discussed how to create a Date table in the Ultimate Beginner’s Guide series, where you can learn how to recreate Date tables really quickly.
Unfortunately, the Date table does not solve this issue of financial years. But first, let’s have a quick look at the table before I show you how to create a financial year column for your own customized financial years.

The Financial Year calculation within the Date table code delivers the Financial Year column. So if your financial year starts in July, it will tell you that it is FY17, depending on how you registered your financial years.

Keep in mind that the Financial Year calculation does not adjust your months and quarters of those particular financial years.
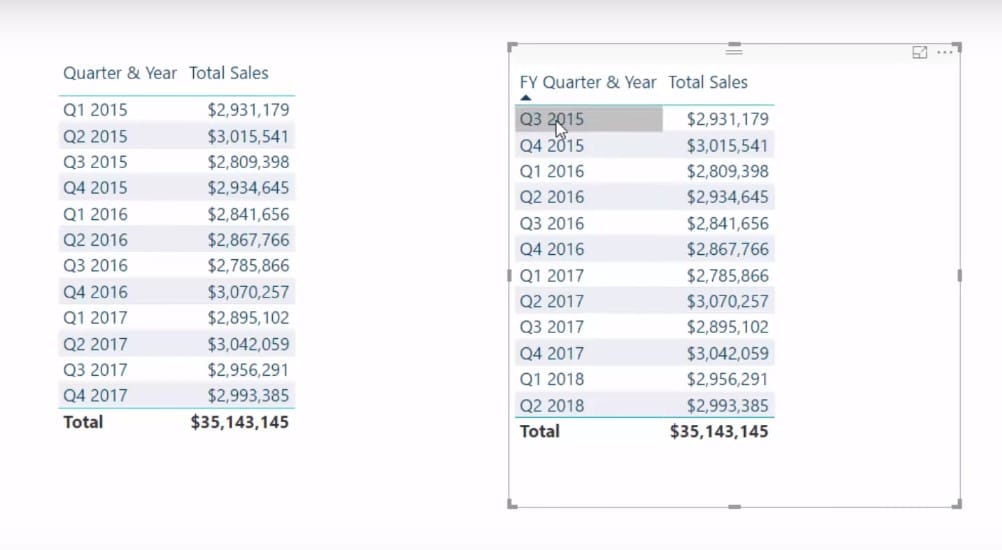
In this particular case, the Quarter & Year is always on the calendar year, and doesn’t change into the financial year.

What I have realized was this was not correct. My financial year started in July, so I had to align my quarters to my financial year.
You could probably solve this in code, but I wanted to show you how you can quickly solve this using Calculated Columns.

First, I created a Quarter column that by itself didn’t exist. I wrote LEFT, the Quarter & Year measure, and then grabbed the first two parts of that particular column (ex. Q1, Q2, Q3, etc.).

Creating The Calculated Column
The Calendar Year still doesn’t align to Financial Years so I had to create some additional logic inside a calculated column which I called Financial Year Quarters.

This enables me to align the quarter to my specific quarter of that particular year. I went in and found the Month of Year column which lists down the number for every single month.
This way, January, February, and March will be translated to Q3 of our Financial Year. April, May, and June will be for Q4.
I used the SWITCH TRUE logic, which is a relatively simple logic composed of mini-nested IF statements written in a more effective way. I also listed all the different quarters and how they aligned to specific months.
Getting The Financial Quarter and Year
However, the other thing I didn’t realize is that this quarter alone needs to be improved because we want to see the Financial Quarter and Year.

So what I did was to use a combination of a few things. First of all, I used the FY Quarters measure, which was the one that we created from the Financial Year column.

Then I went ahead and grabbed the end or the last two digits of the Financial Year, and then put “20” in front to get my Financial Quarter and Year.
Obviously, we also need to sort the Quartn Year column, which already exists in the Date table code.

The Date table code can be downloaded from the Ultimate Beginner’s Guide series at Enterprise DNA. You can download the code and then utilize these techniques to align your Financial Year Quarters.
Visualizing The Data
Check out our final output. Instead of Q1 2015 which was the calendar date, we now have January, February, and March as Q3 2015.
This is not too difficult to achieve. All it takes is writing out the IF or SWITCH logic inside a calculated column. Then all you’ve got to do is bring in the filters and put it in slicers.
You can utilize it across any column or columns that you’ve created inside the data model and filter any calculations like averages or cumulative totals.
Hopefully, this will solve your problem and you can now understand how to utilize calculated columns in a really effective way to leverage off what already exists in your data.

***** Related Links *****
Sorting Dates By Financial Year In Power BI
Calculate Financial Year To Date (FYTD) Sales In Power BI Using DAX
Analyze & Showcase Quarter On Quarter Sales Trends In Power BI
Conclusion
All businesses are going to have different financial years and varying financial quarters.
In this tutorial, I go through in detail how you can start filtering by the custom financial years that you may have within your business.
So this is very relevant to a lot of those situations and scenarios that you will likely have to deal with at some point with Power BI.
Good luck learning this technique.
Sam
***** Learning Power BI? *****
FREE COURSE – Ultimate Beginners Guide To Power BI
FREE COURSE – Ultimate Beginners Guide To DAX
FREE – 60 Page DAX Reference Guide Download
FREE – Power BI Resources
Enterprise DNA Membership
Enterprise DNA Online
Enterprise DNA Events


