
In this blog, I go over a really incredible development technique and concept on creating dynamic Power BI reports. You may watch the full video of this tutorial at the bottom of this blog.
This is actually taken from a session from a members-only event that I put on through Enterprise DNA, which was centered around financial reporting templates.
In this tutorial, I want to go deeper into dynamic reporting and show you a specific technique to develop automated reports can help you. It doesn’t have to be a financial report; you can also use this technique for tabular reports, but this example is financial in nature.

The template I created is customized, which I showed in another tutorial. It doesn’t have to be the standard Power BI formatted table that we get by dragging and dropping. You can actually manipulate particular results to go in a table and have your data in whatever way you want to by utilizing this template technique. This is very applicable to many different visualization scenarios.
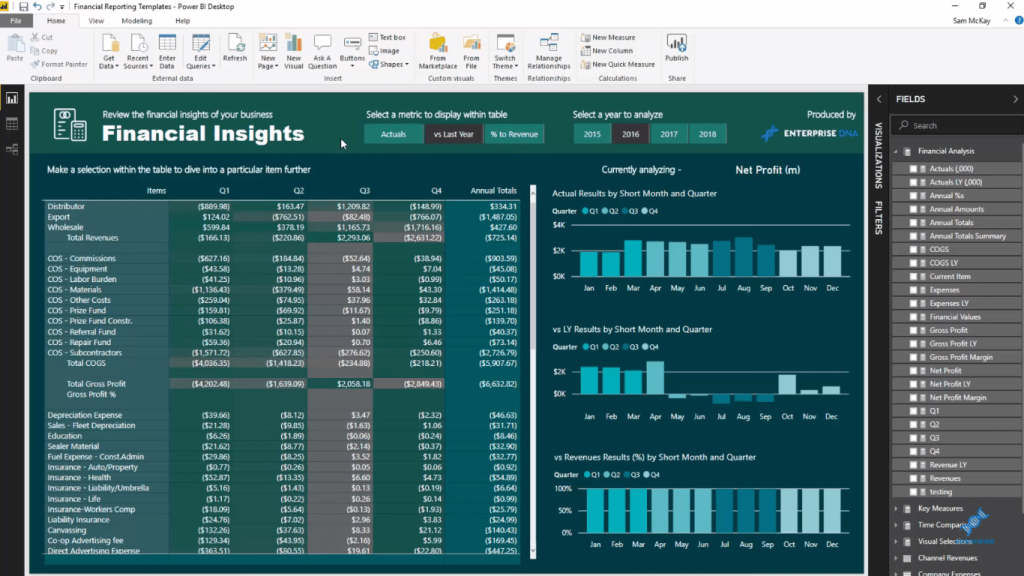
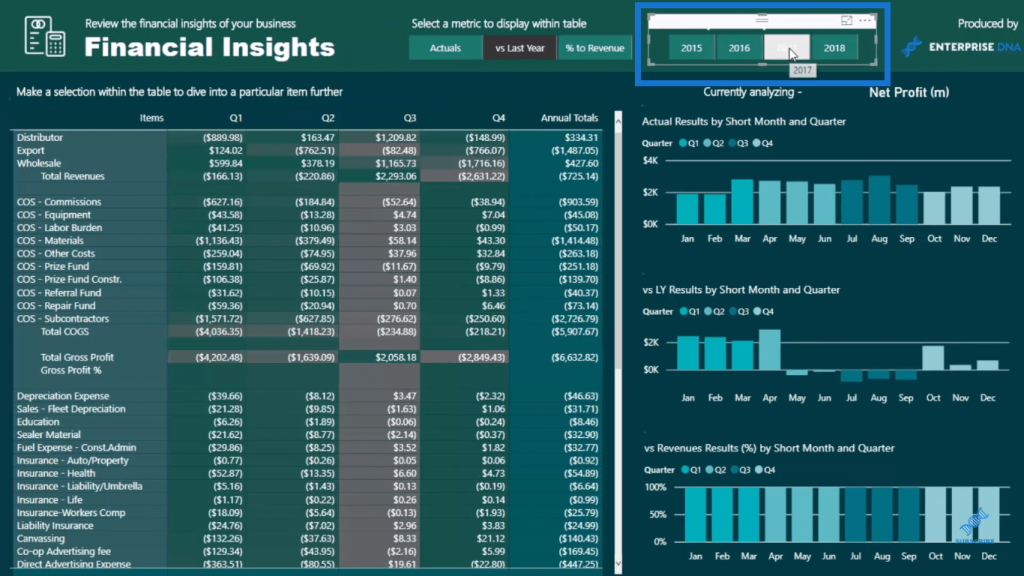
Sample Dynamic Power BI Report
In this template example, we can look at Actuals across each different quarter.
We can also select vs Last Year, which will then change the report, showing us the difference between last year and this year.

I’ve also incorporated this % to Revenue, which enables us to see what each result we have in the table (COGS and Expenses) is the percentage of the revenues. This is quite common in financial reporting.
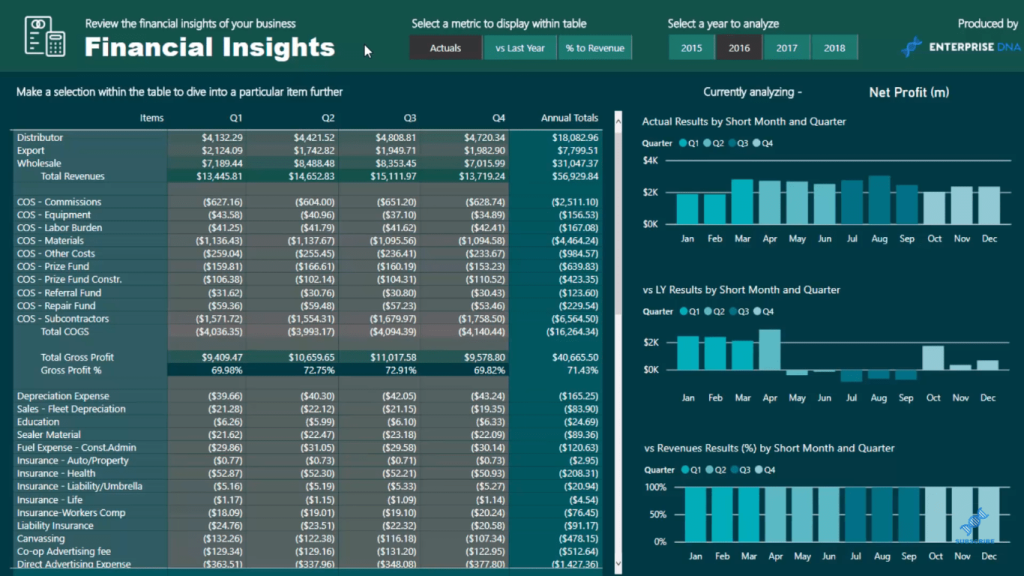
As I’ve created a dynamic calculation, we can see here that the Cost of Goods Sold (COGS) is 30% of Total Revenues in the first quarter. Then in the second quarter (Q2) it’s 27.25%, and so on.

So here, we’re creating a dynamic interior of a table in a templated form. This is quite an advanced technique, but it just shows you how incredible Power BI is for this type of analysis and reporting. We can totally automate dynamic financial reports.

Automated And Dynamic Reporting Technique
I’ll take you through the core of this technique, which is to enable the selection to find really good insights. For instance, we’re looking at the Total Gross Profits in quarter 1 and 2, and we can say that we’re poor-performing here. However, why is it positive in the third and fourth quarter?

What we can do is check the Actuals this year, which is 11 million, and then we quickly flip back to 2015 and see that it was 8 million before. So there was a solid increase in our revenues from year to year.
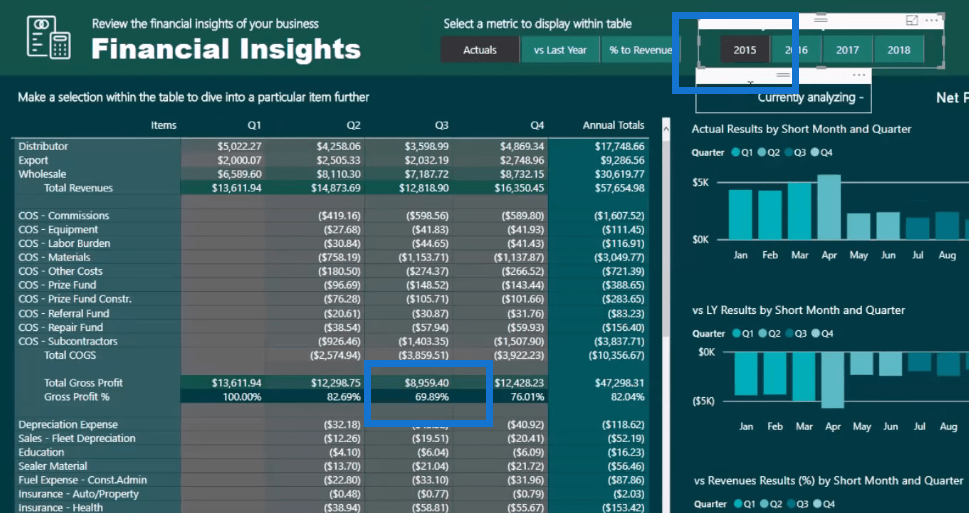
This is a very good insight and being able to see it in a really quick and dynamic way is quite exciting.
To do this, we need to first create a table to create the slicer. This is a really simple table with our Actuals, vs Last Year, and % to Revenue.
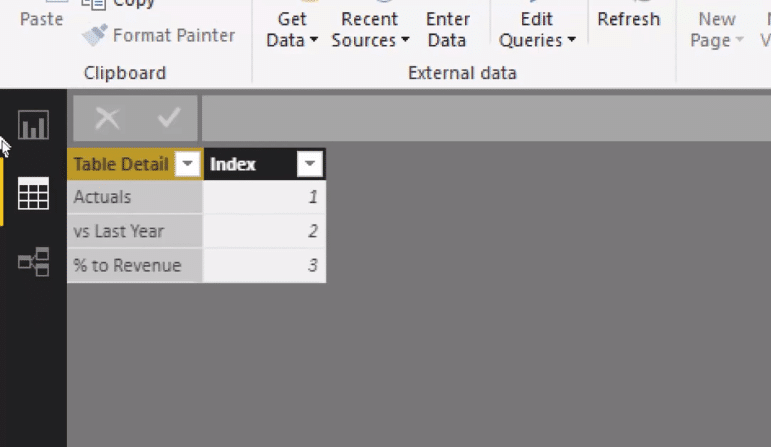
Once we do that, we create the slicer. Then, we need to integrate this into a formula. So depending on what slicer selection (Actuals, vs Last Year or % to Revenue) we have, we want to feed through a particular result.
Using SWITCH TRUE Logic
I’ve used the power of the SWITCH TRUE logic in the calculation. First, let’s focus only on the last part of the formula. I’ve used variables (VAR) to simplify this measure because if this was written out as one straight formula, it would be quite confusing.

SWITCH TRUE is the key technique here because it’s a really great way to create dynamic things like this.
Whatever the selection is (Table Data), it’s working out to return that metric variable. For example, we choose Actuals, then it will return the Actuals variable.
Now if you look at the Actuals variable, it’s actually SWITCH TRUE itself as well. In other words, we’ve incorporated SWITCH TRUE within a SWITCH TRUE.

So think about how cool that is and how complex this would be if we have this all out in one formula and use Nested IF statements. It would be absolutely impossible. But setting it out like this in DAX is not too difficult.
The SWITCH TRUE logic in the variables is allocating the correct results to the templated design, while the SWITCH TRUE logic after the Return is enabling that dynamic result to feed into the table.
The same goes with the other metrics – vs Last Year and % to Revenue. It’s a very similar setup with just slightly different calculations.

We can go across different years and be able to see automatically from here on and to the future as well.
***** Related Links*****
Data Visualization Technique In Power BI – Multi Measure Dynamic Visuals
Creating Multi Threaded Dynamic Visuals – Advanced Power BI Technique
Create An Entirely Dynamic Report In Power BI – Advanced Visualization Technique
Conclusion
This was a detailed session that I have just been through. It was about how you can build dynamic Power BI reports from scratch. Here, we have learned how to automate dynamic Power BI reports inside a table template. This is something you can easily incorporate into your model and create filters, etc.
I hope you have found this tutorial useful, as it’s not only helpful in financial reporting – it can also be used in custom table tabular reporting.

Cheers!
Sam


