
In this tutorial, I show you how to calculate the median value from a list of values inside Power BI using the MEDIANX function together with other DAX functions. I demonstrate how you can place a virtual table inside of this function, and then evaluate through that virtual table to obtain the ultimate result – the median result. You may watch the full video of this tutorial at the bottom of this blog.
With the many statistical functions that we can use in DAX, we need to understand how they calculate and how they operate over tables of values.
The median is the value separating the higher half from the lower half of a data sample (a population or a probability distribution). For a data set, it may be thought of as the “middle” value.
You might not want to set up your report like this, but I’ve set it up like so for you to understand the structure of this table. You’ll see how to create this table in a formula to then go and evaluate the result.


Calculating Median Sales Using MEDIANX
The key function to use in the calculation is MEDIANX. This DAX function enables us to iterate through a table (physical or virtual). In this case, we’ll iterate through a virtual table because we want to calculate the median per state. We can’t put the Location table because it’s at a more granular level of detail, which is by city.
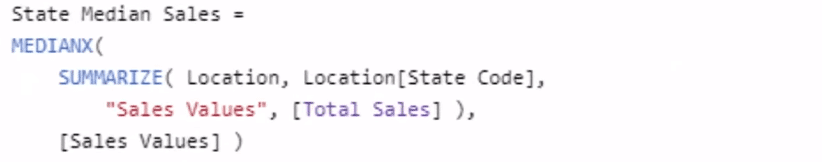
Since we’re evaluating at the state level, we need to somehow adjust our table. To do that, we use the SUMMARIZE function. This table function is clean and easy to implement inside iterating functions like MEDIANX.
We’re recreating this table here, State Code column, and this Total Sales column, but we’re calling it Sales Values.

So, at every row, we’re iterating through each state and working out the total sales. The median is going to happen across all of our sales once all of the iterating is done. And that’s how we achieve the State Median Sales.
Another Way To Use The Formula
We can reuse the formula in many different ways. Here’s an example.
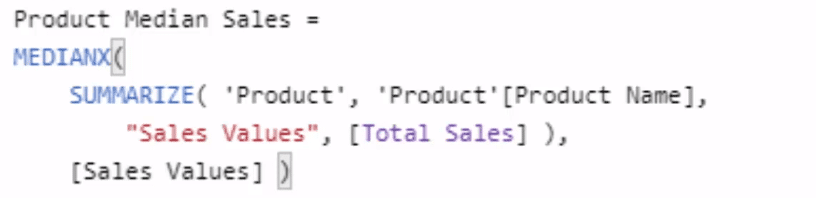
In this formula, we’re calculating for the Product Median Sales. All we need to do is change the virtual table that we’re iterating through inside of our iterating function (MEDIANX). And instead of creating a virtual table of the states, we create one with Product Name. The other column is still the Sales Value with Total Sales.

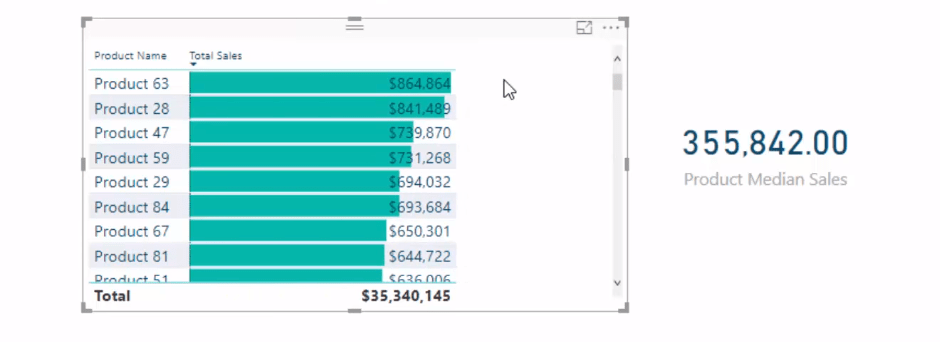
Once we’re through with all of those products, we then work out the median.
***** Related Links*****
Iterating Functions In DAX Language – A Detailed Example
Virtual Tables Inside Iterating Functions In Power BI – DAX Concepts
Master Virtual Tables In Power BI Using DAX
Conclusion
You’ll find that these techniques in this tutorial are re-usable when completing other statistical analyses. This is a really good review of iterating functions in terms of how they work inside Power BI. You need to master these concepts if you are to utilize Power BI and DAX to the fullest.
Enjoy working through this tutorial. If you want some further studies around this type of DAX functionality inside of Power BI, check out the links below.
Cheers!
Sam
***** Learning Power BI? *****
FREE COURSE – Ultimate Beginners Guide To Power BI
FREE COURSE – Ultimate Beginners Guide To DAX
FREE – 60 Page DAX Reference Guide Download
FREE – Power BI Resources
Enterprise DNA Membership
Enterprise DNA Online
Enterprise DNA Events
[youtube https://www.youtube.com/watch?v=y1ilV9o47Z4&w=784&h=441]


