
In this tutorial, we’re going to learn how to append power queries in Power BI. This technique is the process of layering one thing on top of the other. I’m going to show a perfect example as to why we need to do this.
In the tutorial that I made for staging queries, we created staging queries for our sales tables. We did that because the sales information was in three different tables and we don’t want to bring three different tables with exactly the same structure in our Power BI model. If they have the same structure (like the same column with the same column names), it’s much better to layer them on top of one another by appending them.

Creating The Main Table
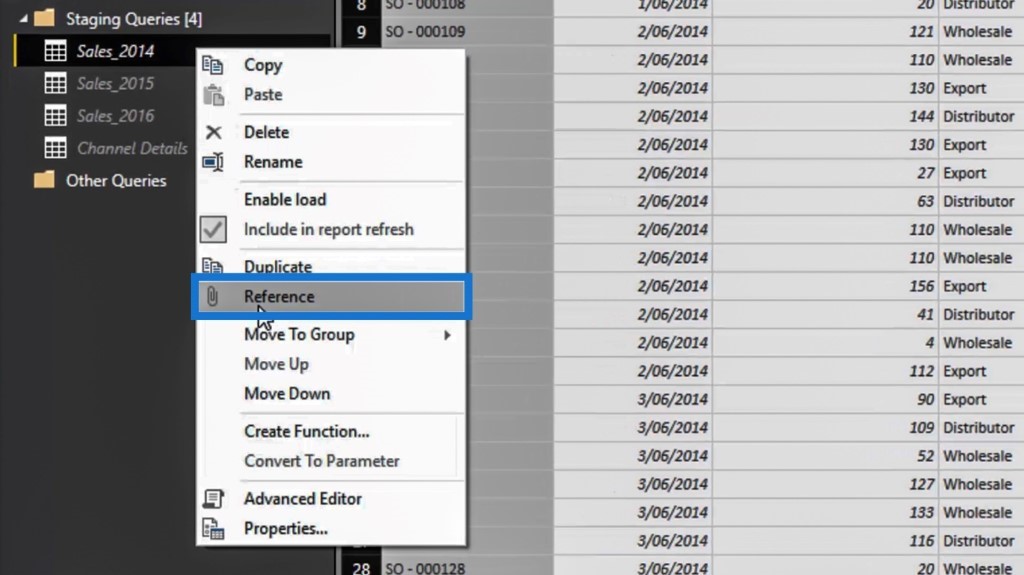
First, let’s create the main table. In this case, the main table is our fact table, which we’re going to call Sales. To start, let’s right-click on Sales_2014 then select the Reference option.
Then drag the reference table Sales_2014 (2) into our data model.
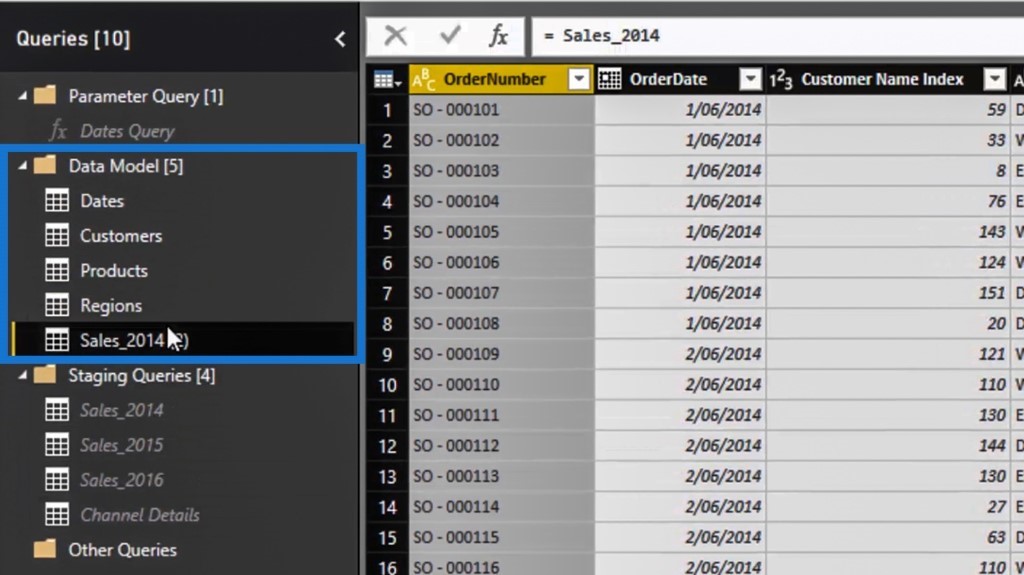
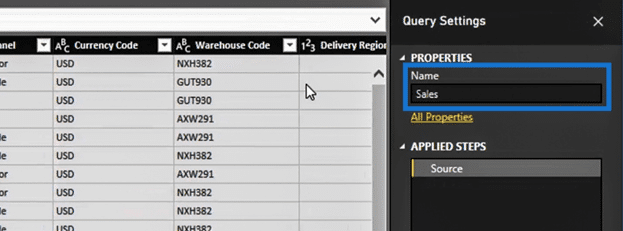
After that, let’s rename this table into Sales. Now, this is going to be the main table where we’re going to append the Sales_2015, and Sales_2016 tables.
Note that we don’t want to remove or merge these Sales_2015 and Sales_2016 staging queries at all. This is because we’d want to see what things look like in their initial form.
Moreover, we don’t want to lose our understanding of how our model is developed because we won’t see the underlying plugins that made our tables and our model. That’s the main reason why we created a reference table where we can append these Sales_2015 and Sales_2016 tables.
Appending Power Queries
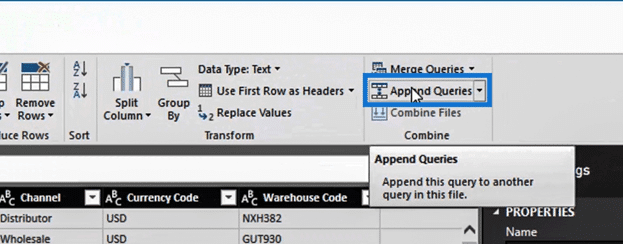
To append our tables, let’s select the Sales table that we’re going to set up as our main table. Then, go to the Home ribbon and select the Append Queries option.
Now, we’ll see that there’s a slight change inside the Queries pane. As you can see, the icon beside the Sales table was changed to an exclamation mark.


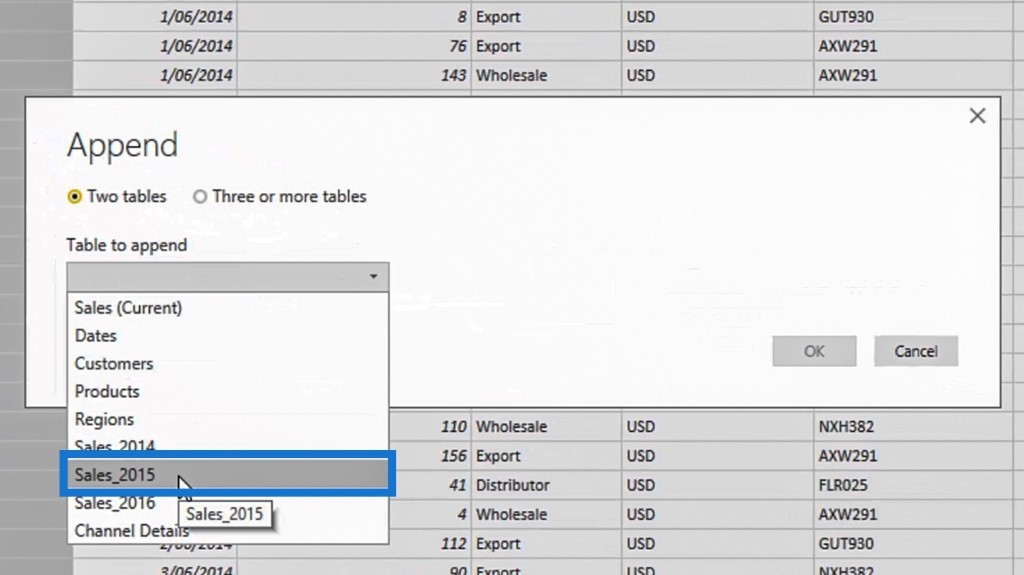
In this case, we just need to click the dropdown input of the Table to append option, and select the Sales_2015 table. Click the OK button to apply the changes.
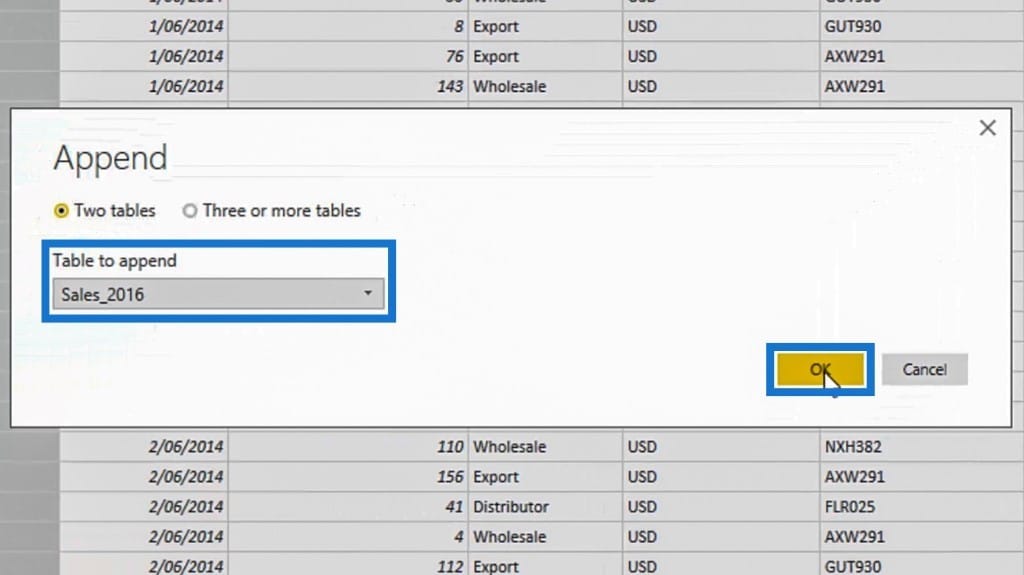
Let’s also append the Sales_2016 table by doing the same step.
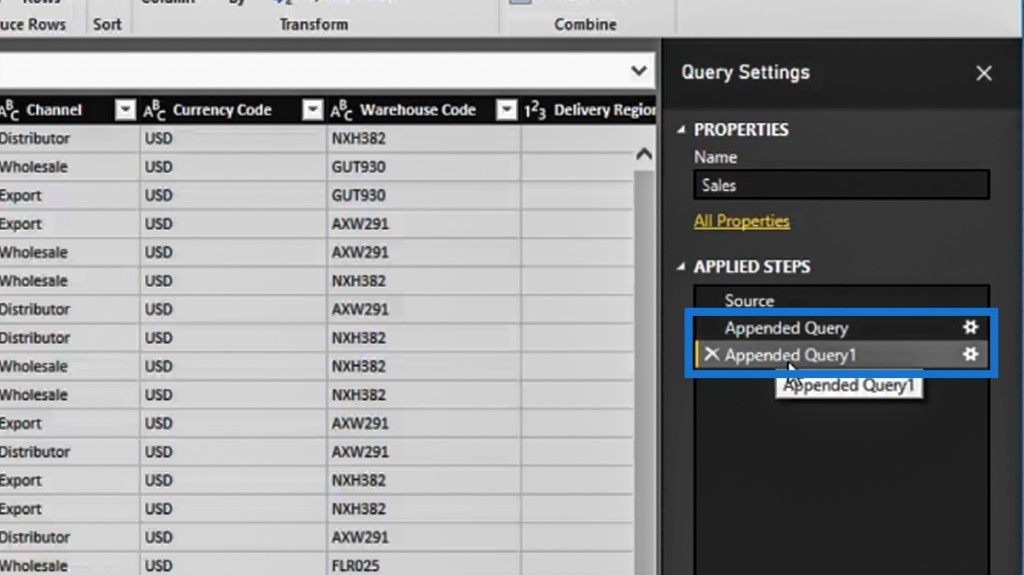
After doing those steps, we’ll notice that we already have a newly-pinned query transformation such as the Appended Query and the Appended Query1 in the Applied Steps under the Query Settings pane.
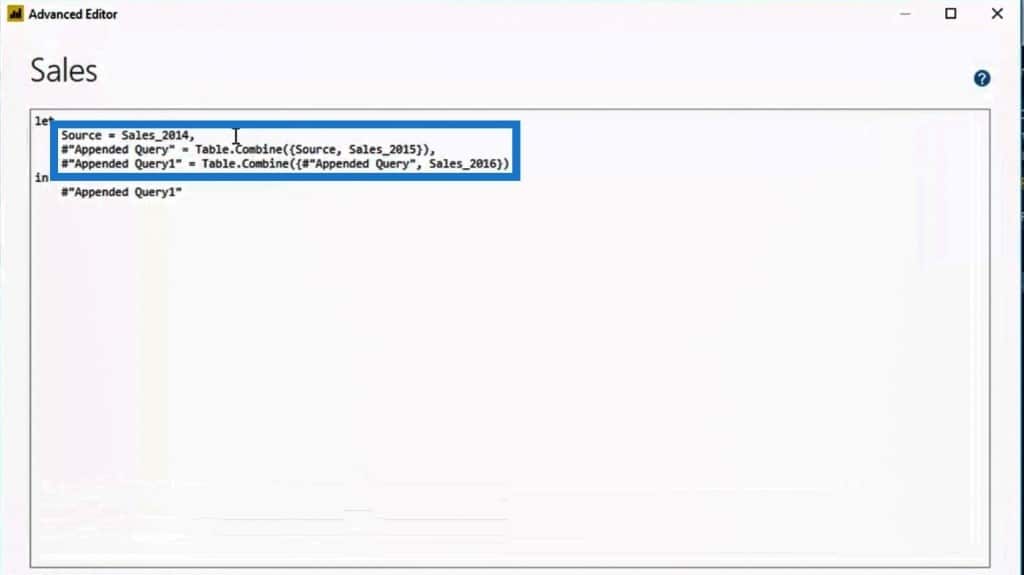
Let’s then click the Advanced Editor and we’ll see that it runs this simple information. Noticeably, it looks simple and understandable. The first line shows us the source which is the Sales_2014 table while the second and the third lines specify that we appended the Sales_2015 and Sales_2016 tables.
Let’s think about how this would work as we move along. We might get a 2017 sales data that might be another table inside a spreadsheet or it might be another data source. Hence, all we need to do is to query that new table and put it in as a staging query, lay it out intuitively, then append it to our main sales table.
***** Related Links *****
How Query Dependencies Work In Power BI
Organizing Your Queries: Power BI Query Editor Tutorial
Simple Power BI Transformations For More Optimized Data
Conclusion
Appending power queries in Power BI is an easy yet powerful technique in terms of setting up and optimizing models. We don’t need to create any new calculations, new filters, or new visualizations because it should all filter into anything we have built before. Combining this with the other techniques makes our model scalable from an analytical solution to a reporting perspective.
Hopefully, you can see the potential and the importance of understanding this technique well.
All the best,
Sam


