
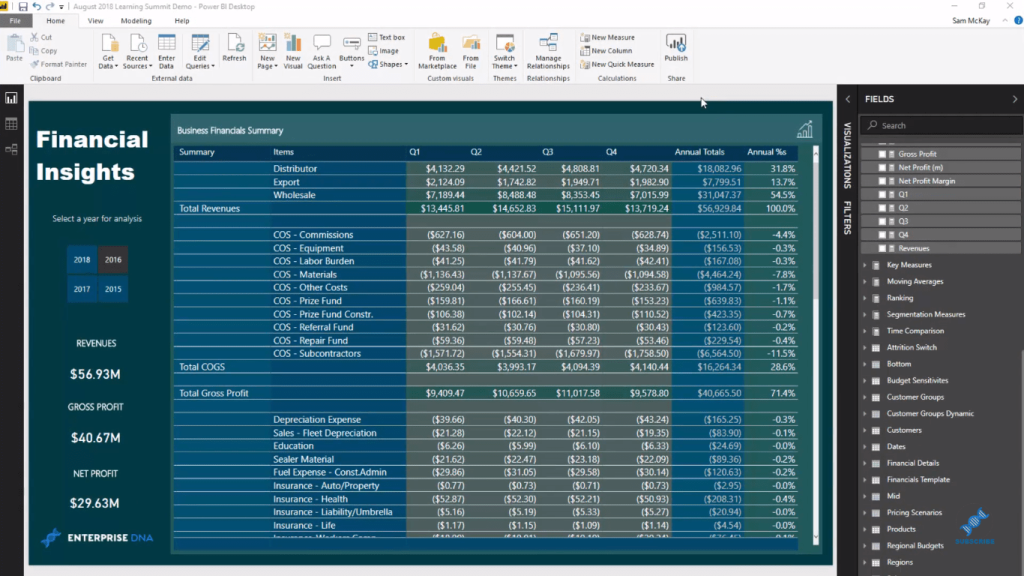
Here I want to showcase a unique idea around financial reporting, which is allocating results to predetermine table templates inside Power BI. You may watch the full video of this tutorial at the bottom of this blog.
After spending quite some time working out how to create these custom templates, I’ve finally devised a strategy around Power BI development. This strategy enables us to not only create these templates, but also allocate unique results to these templates at every single row.

Template And The Data Model Structure
First of all, I want to show you what the template is and how it looks like. In this particular example, I created a table, which I did in Excel. I set it out in the exact format that I wanted. As you can see, I put an index number through every row, even if it’s blank.
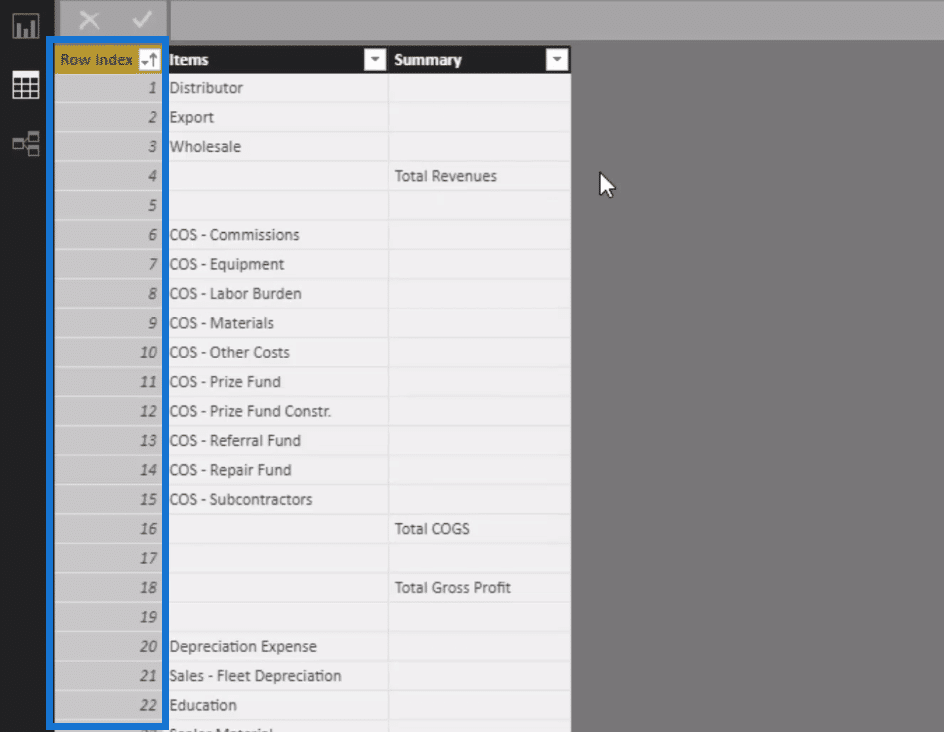
The index number is crucial to make this all work. You could customize this your own way because this is just the template that I used in this demonstration.
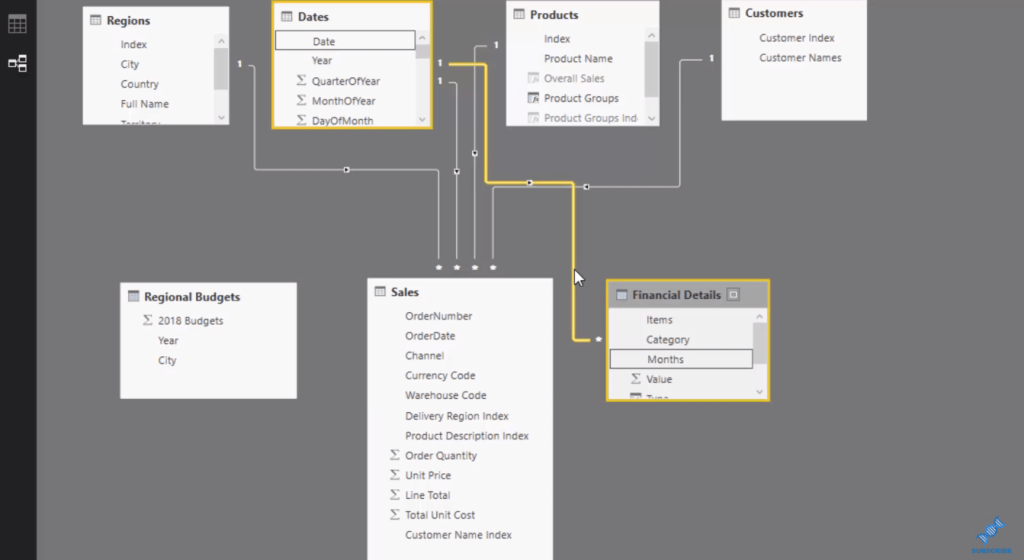
Now let’s take a look at how the data model is structured. You’ll see here that the Financials Template table has no relationship to anything. No relationship to the Financial Information.
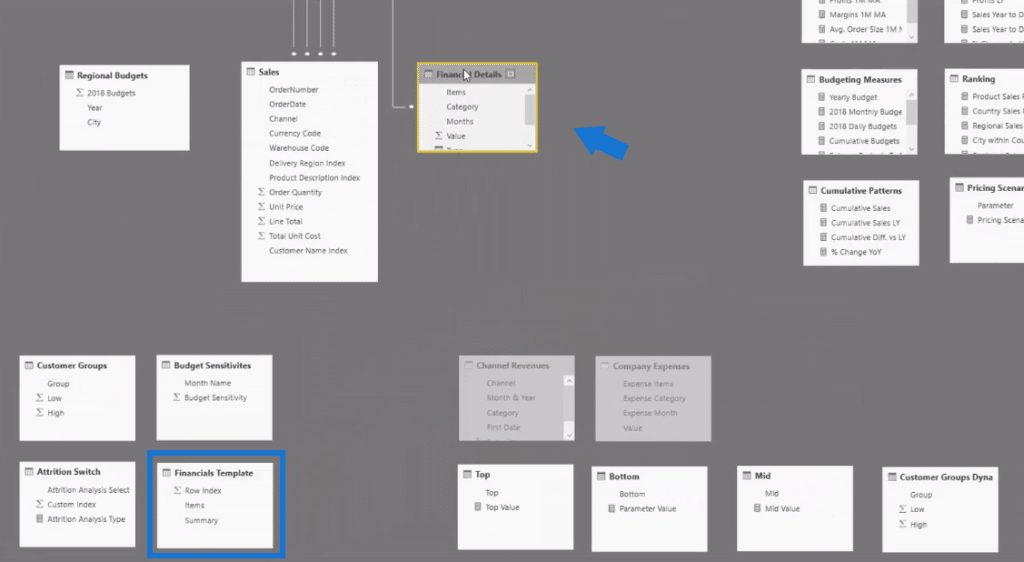
And so we need to use index measures to bring this all together. We need to allocate financial information to the correct row based on some DAX logic. In this case, we use the SWITCH TRUE logic.
Allocating Results Using The SWITCH TRUE Logic
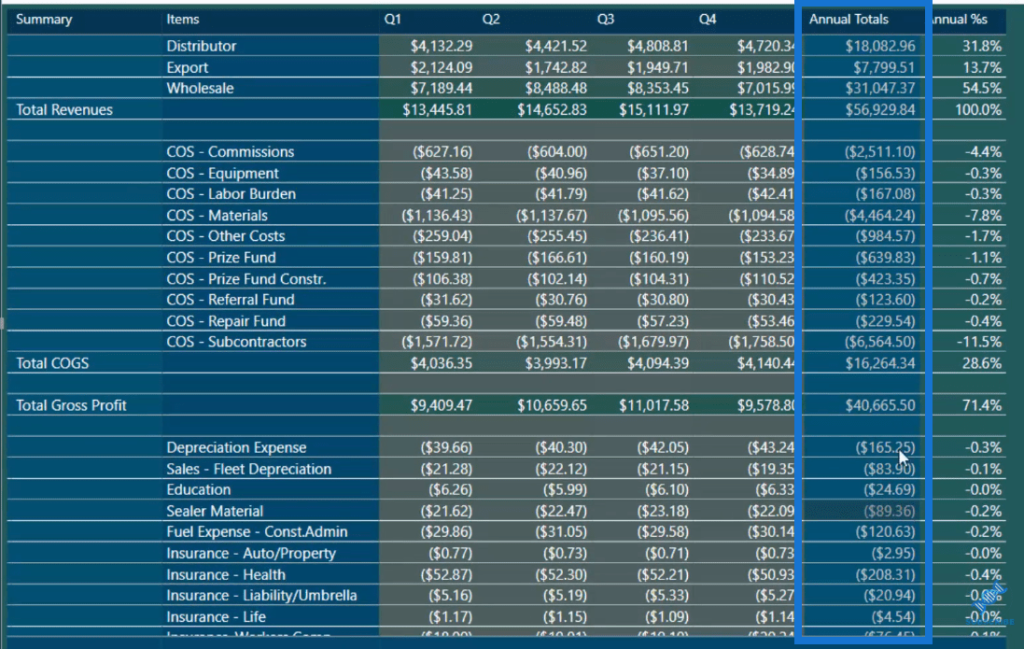
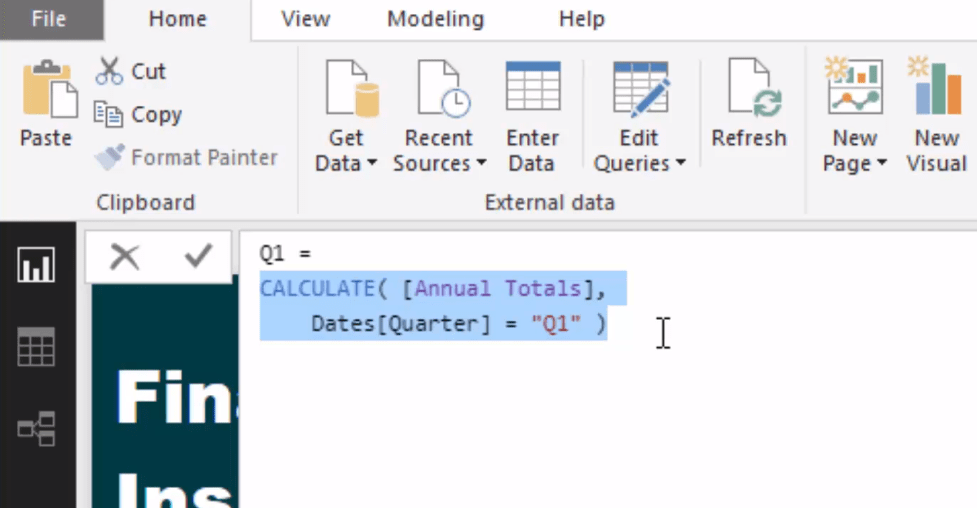
In this tutorial, we focus in on the Annual Totals result. This is where the logic happens.
The key way to allocate information to unique rows, headers, or subtotals is to use SWITCH TRUE.
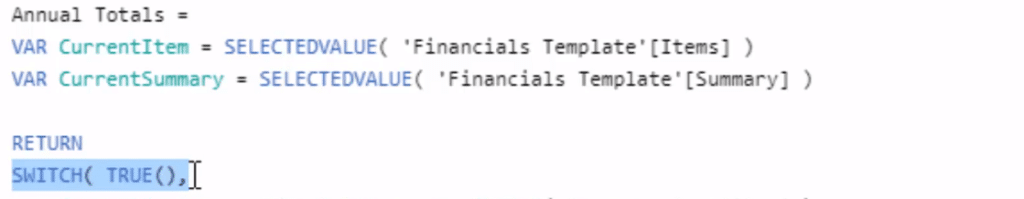
We need to identify what row we are on. As you’ve seen in the data model, there’s no relationship between the tables, so for any row that we are in, we need to identify the item. That’s what these variables are actually doing here at every single row.

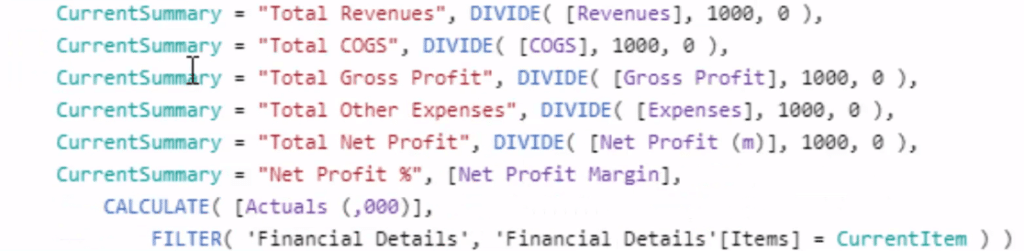
If it equals to TRUE, then it will bring through the individual result. For instance, for the Total Net Profit, it will bring through the result of Net Profit divided by a thousand.
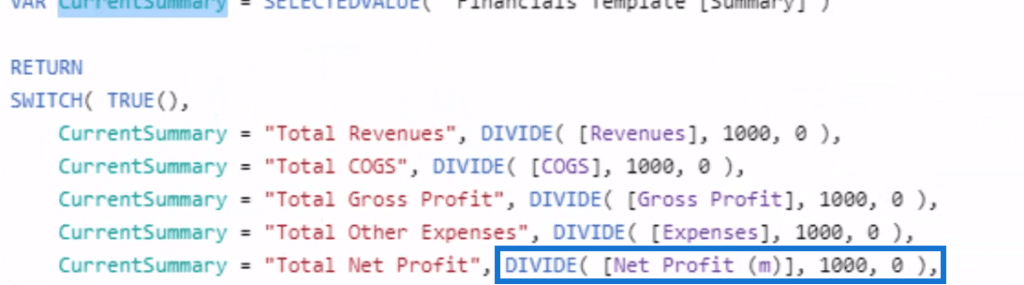
So in other words, we’re allocating results to rows based on logic that we’re creating. We’re trying to identify what row we’re on, and then we’re passing through an individual result or measure for that particular row.
What we can also do in SWITCH is to have an alternative result. If none of these CurrentSummary evaluates to TRUE, we go down to the alternative results, which uses the CALCULATE and FILTER function.
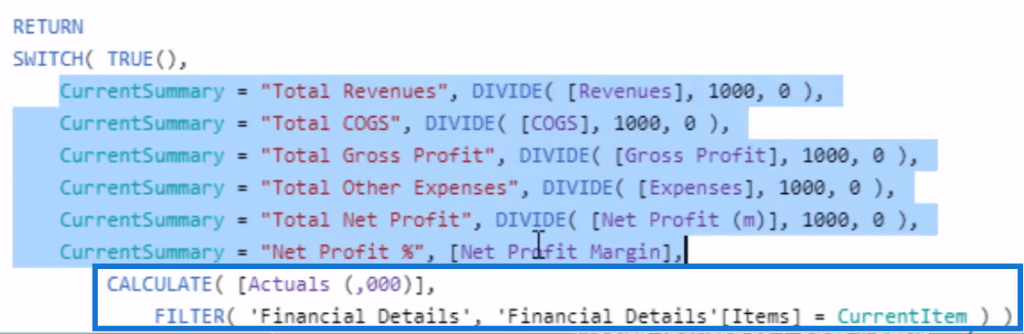
This is the very last input that we have in the SWITCH TRUE function. The alternative result here is very similar, but it can be a bit more dynamic because I created another formula (Actuals) previously, which I input inside CALCULATE. Actuals is creating a positive result for revenue and a negative result for expenses.
The FILTER function looks through the Financial Details table, and then return the Actuals value for whatever current item we’re in. And that’s how we can simplify things dynamically. We don’t need to write a SWITCH statement for every row because we can calculate a lot of them dynamically this way.
Filtering The Dates Table
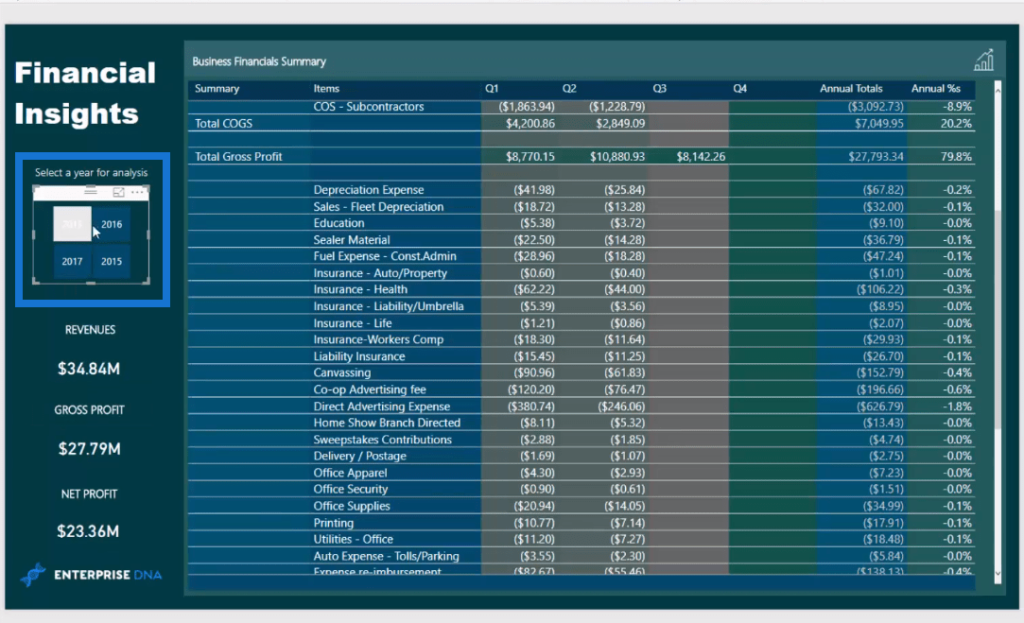
What I’ve also done is I’ve broken it into four quarters. I’ll show you what you can do from what we just look through. In quarter one (Q1) for example, we see that Annual Totals is what we just created.
All of this will continue to be filter by the Dates table because in the data model, there’s a relationship between the Dates table and the Financial Details table.
This enables us to click into any particular year and it will dynamically change for that year.
***** Related Links*****
How To Create Unique Subtotals In Power BI Tables Using DAX
Financial Reporting Tips For Power BI – Actuals vs Budgets vs Last Year
New Financial Reporting w/Power BI Official Course Launch
Conclusion
In this blog, I show how you can set up templates and allocate to them in Power BI financial reporting.
This is relevant for finance or accounting types of work in Power BI. You’ll see how this could apply to many different custom table templates that you may need in different organizations and business functions.
Enjoy working through this one.
Sam


