
In this insightful tutorial, I want to feature the GROUPBY function in Power BI. I’ll demonstrate the different ways that you can use this DAX function. You may watch the full video of this tutorial at the bottom of this blog.
Honestly, I haven’t used the GROUPBY function too often, mainly because there are several ways to solve things in Power BI using other table functions. For instance, I’ve used the SUMMARIZE function quite a bit to achieve the things I’ve wanted to achieve.
One thing that makes the GROUPBY function unique is some sort of syntax.
Most importantly, I want to introduce a new performance perspective by using the GROUPBY function. This DAX function can make your formulas a lot quicker, especially if you have minor performance problems with other table functions.

Creating Tables Using The GROUPBY Function
The GROUPBY function tries to group certain dimensions in the data. It’s going to create a table, either a physical or a virtual one, based on the elements inside the data model.
In my model, I have data for Sales, Customers, Dates, US Regions as well as Products.
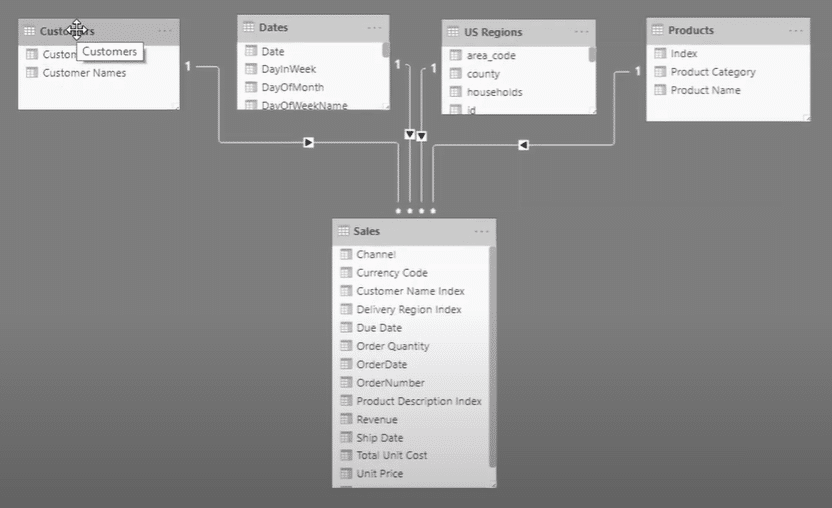
I can group this data when I place filters from all of these different tables. For example, if I want to work out some unique insights per product by state, I’ll have to calculate the maximum sale amount per product per state for a particular customer. It’s hard to achieve that analysis without doing some sort of aggregation within the rating function. This is why I’m going to teach you another way to create that aggregation aside from using the SUMMARIZE function.
Study the formula below.
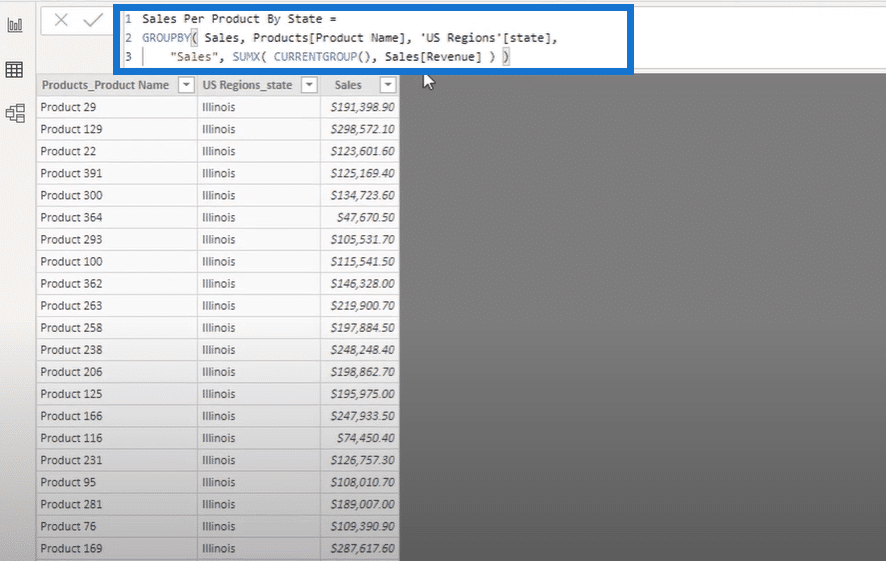
First of all, I need to reference a table. In this case, I have referenced the sales table because I need to reference it to any other dimensions from two different look-up tables. That’s the reason why I have Products[Products Name] in the formula, as well as by state. This part of the formula is going to combine data by both product and state level.

The interesting part here is that I can’t actually place a measure inside that part. I have to use a syntax similar to the iterating function that I have used. After that, take a look at where I placed the CURRENTGROUP function in the formula.


I need to run some iterating logic on each row in the particular tables that I have set up. From a performance perspective, it iterates over the grouping versus every single row in the Sales table. I’m pretty sure that’s how it works. I could find out more about it after further testing, but so far that’s all it does based on Microsoft’s definition.
I’ll show you another interesting insight. If I put a revenue measure in the formula, it doesn’t return a result and actually shows as an error. This only means I need to write it in a very specific formula syntax to get a new table.
Lastly, I can make the table bigger because it’s not restricted. I can even add different functions and create different columns using a similar logic.
Working Out The GROUPBY Function Inside A Variable
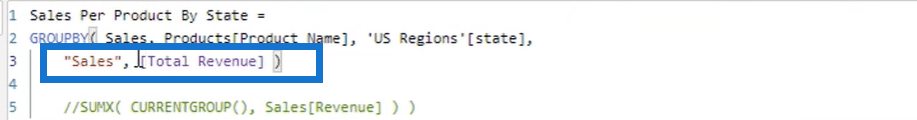
I want to return to the Max Product Sales By State formula and show you another technique.
Instead of using the GROUPBY function in a calculator table, I can put it inside of a variable. This time, I named the variable as ProductStates.

Using this formula, I want to find the different customers in the same virtual table and work out the maximum product sales by state. Therefore, I’m going to find the customer’s highest sales amount for a product, and then look at the data of each different state.
First of all, I’ll do the aggregation and that’s why I placed the GROUPBY virtual table inside of the MAXX function.
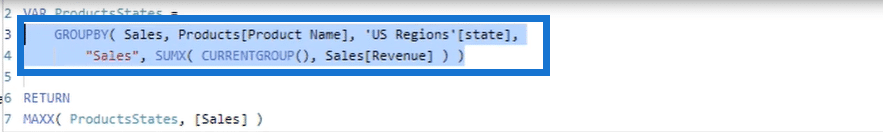
After that, I’ll run some iterating functions through the virtual table, and then calculate the sales at every single row. The formula will only return the maximum results as I used the aggregated virtual table inside the MAXX iterating function.
Check out what happens when I select a specific customer here.

As reflected in the report, the customer’s maximum product sales by state is around $68 000. You can see that listed in the first row of the next table. Moreover, the different product names that the customer purchased as well as the state are visible in the table. The total sales for this customer alone is around $193, 000.
For other customers, the table returns a correct result every time. Hopefully, it gives you a good overview of the things you can do using the GROUPBY function.
***** Related Links *****
Group Customers Dynamically By Their Ranking w/RANKX In Power BI
Use DAX To Segment & Group Data In Power BI
Working With Iterating Functions In DAX
Conclusion
For those of you who want to try this, I recommend playing around with the different possibilities of the GROUPBY function. You can use it to create some sort of aggregation and see what comes up.
It’s a good function, but personally I still prefer to use the SUMMARIZE function because I find it easier. However, this is totally my personal opinion. You can always try another function and see if it suits you based on your models.
I certainly hope that you still learned something about this particular function. Don’t forget to check out Enterprise DNA TV for a lot of other great content.

Yours truly.
Sam


