
Here, I’m eager to demonstrate how you can dynamically represent financial information in a compelling manner using Power BI. Now, it’s very easy to study budget vs actual vs last year inside Power BI because of its immense improvement in terms of financial reporting. You may watch the full video of this tutorial at the bottom of this blog.
With this advancement, you can readily evaluate performance and forecast future income. You can also identify other operational centers that are performing differently than expected.
I’m going to show you how you can take things up a notch using dynamic calculations and formula language techniques.
By implementing some reasonable logic within your Power BI model, you can change what can be seen inside the actual table that contains your financial reporting information.

Sample Financial Report in Power BI
I have here a sample setup for a particular financial report. This is very useful when you want to show PnL data, cash flow data or balance sheet data.
Now, let’s take a look at our sample report for profit and loss.

Here, you’ll see a matrix which breaks down line items from different financial quarters and years. You’ll also be able to scan through the specific revenue line items, as well as expenses.
To give you an idea, the main goal of this tutorial is to show the actuals, budgets, and the current performance compared to last year’s. Once you understand how to utilize this data, you’ll be able to create dynamic figures in your financial report.
Firstly, click vs Budget. After that, the report will automatically compare the data between actuals and current budget.

If you look at this particular column here for the first quarter, you’ll see the % Diff column.

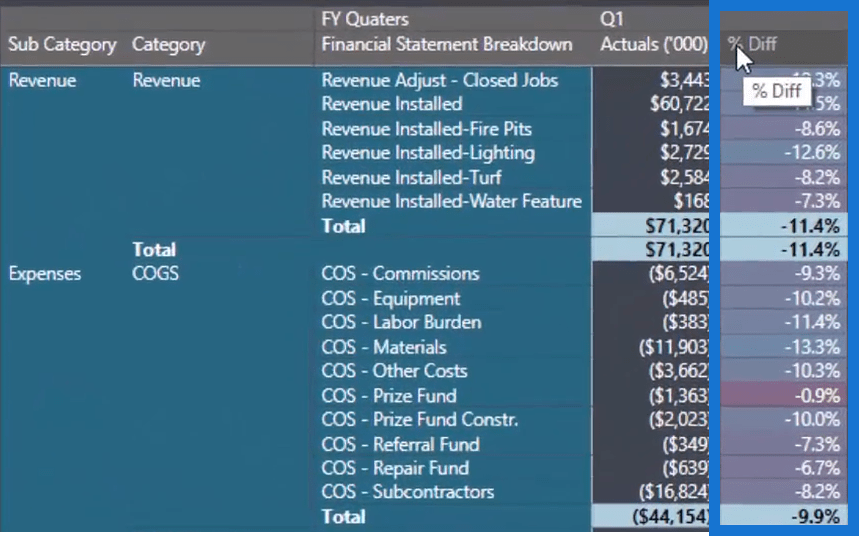
The % Diff column is a dynamic number. Thus, it can either show the percentage difference for vs Budget or vs Last Year. Since I initially clicked vs Budget, the data here will show the percentage difference of actual vs budget.
If I click vs Last Year, you can see that the data in the % Diff column changes dynamically.
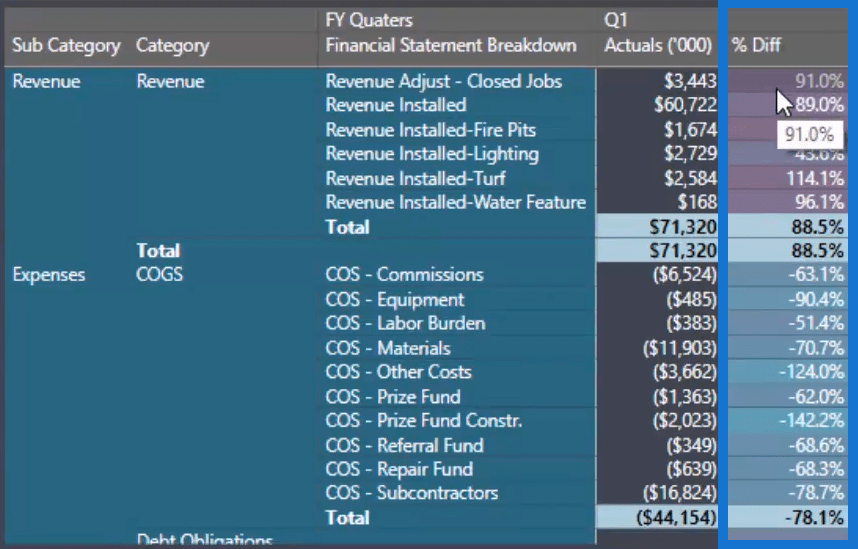
This dynamic measure in Power BI is a powerful technique to show a lot of different sides in just one report.
Previously, you’ve probably had to lay this out one by one in Excel. But in Power BI, you can directly observe this information by utilizing some techniques in the models and DAX formula.
Getting Started With The Budget Vs Actual Table
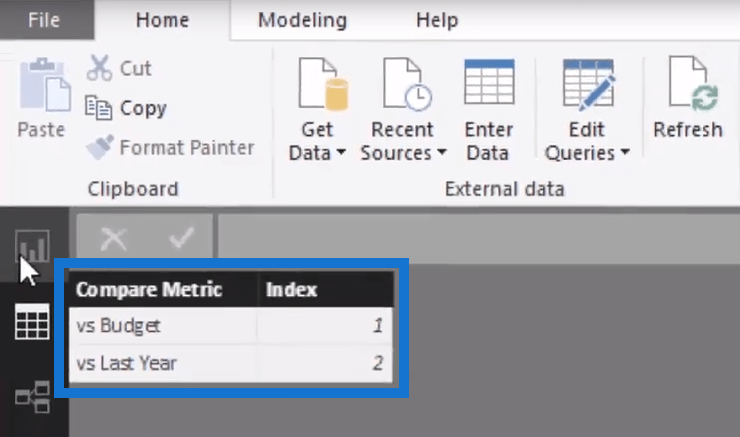
First of all, you need to create a table to place into the slicer. Slicers are a big help when you want to view specific information in a packed report. Unlike filters, slicers let you select values dynamically so you can easily analyze the report.
The slicer needs to have a dimension that lists vs Budget and vs Last Year. So, I simply created a very basic table that will serve as our comparison metric.
After that, I needed to create a measure that understands the selection I made. Within that measure, I also need to add the list that I want to actually show or calculate.
Formula For Selected Metric
In the formula bar, I use the Selected Metric formula. This formula is pretty simple.

First, you have to add your SELECTED VALUE. And inside your selection, you have Results Comparison. Then, compare it to Compare Metrics or that particular column that I just created.
If nothing is selected, by default, it’s vs Budget.
But right now, the formula will evaluate vs Last Year because that’s what I selected. Otherwise, this formula will be available for vs Budget.
Based on our selection, the formula will retrieve another measure to create this comparison.
For the Actuals, I’ve created vs Budget and vs Last Year within this model.
I want to show you how you create this dynamic measure. When you select this slicer, you make a selection within the slicer that will actually change what’s happening behind the scenes now.
Formula for Comparison Metric
To set up the comparison metric, I used the SWITCH formula.


If you haven’t come across SWITCH before, you can get more information here.
Here, the formula is going to evaluate the logic in the selected metrics – vs Last Year and vs Budget.
So if vs Last Year is selected, it’ll retrieve this measure.

However, if vs Budget is selected, it’ll retrieve this measure.

Finally, if nothing is selected, it is going to retrieve this particular measure by default.
After that, you can then integrate it into the percentage of calculation. That is because you are retrieving the comparison metric dynamically.
So, when it comes to the calculation for % Diff, you’ll see that I have redone our formula.
Formula for Percentage Difference
Instead of calculating the individual actual, budget, and last year, I’ve gone straight into the percentage measure. It’s branching out from other measures and integrating it into the same pattern or logic in SWITCH.

If vs Budget is selected and if select measure is versus budget, retrieve the percentage deficit budget now.
Formula for Percentage Diff. to Budget
This is what the % Diff. to Budget formula will measure.

Here, I use the DIVIDE function. It is simply subtracting Budgets from our Actuals and then dividing the difference by the Budgets. It’s going to give you the percentage appreciation or depreciation versus the comparison metric.
And there you have it, that’s how you set up your data!
***** Related Links *****
Compare Actual Results to Budgets Using Power BI Forecasting
Forecasting in Power BI: Compare Performance vs Forecasts Cumulatively w/DAX
Budgeting Analysis On Best & Worst Performers Using Power BI
Conclusion
All I wanted to show you was how good financial reporting can get when using Power BI.
It is far superior to what you can achieve with a standard Excel file or with conventional Excel techniques.
Interestingly, Power BI is taking this type of financial reporting to the next level, which is something I definitely want to show you how to do.
I go into the technique in more depth during the video presentation, so I’m not going to give away too much here. If you want to check it out now, head over to Enterprise DNA online where you can see a huge amount of courses and resources.
Hopefully, you’ve gained a better insight with this financial reporting tips.
Cheers,
Sam


