
The INTERSECT function in Power BI is an advanced table function and you need to understand it better so you can maximize the use of this advanced DAX. You may watch the full video of this tutorial at the bottom of this blog.
But to understand how it works, you need to get much better at understanding virtual tables. Virtual tables are a key concept when utilizing DAX measures within Power BI.
What the INTERSECT function specifically does is that it allows you to – within a measure – compare one virtual table to another one. You will then finally be able to return a table of results that appear in both versions of these two virtual tables.

When you understand how you can utilize this function, you’ll soon see that there is an amazing capability when it comes to running some very advanced logic with ease.
Showcasing A Unique Insight Using INTERSECT Function
In the example that I run through, I’ll showcase a really unique insight that you can discover using the INTERSECT function. This particular insight can be re-used in many different ways. This is most useful when you’re working with customer data and your aim is to understand your customers better.
The best way to learn this function is through a practical scene. So, I’m going to work through a scenario and work this out based on our customers for the current month. These customers should also have a purchase history for the past two months. And we’re going to figure out which of our current customers had previous order transactions from 2 months ago.
Take a look at this Power BI report that I’ve created to demonstrate the INTERSECT function. First, I’ve set up some filters on the left-hand side where we can select any month.
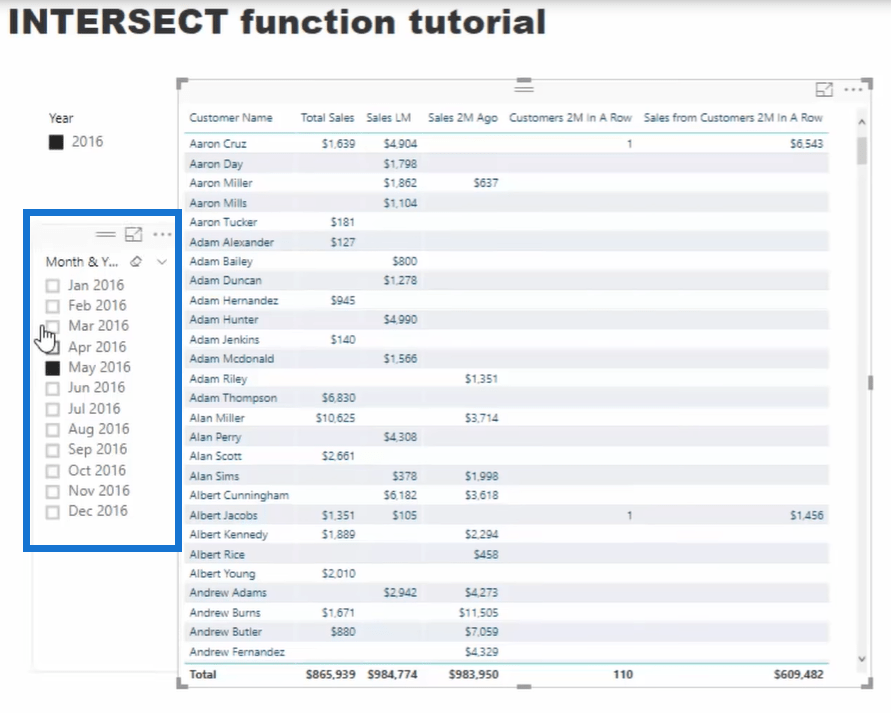
Then, I have the columns for all the customers. The Total Sales and Sales LM columns show the customers who have purchased histories for the current month as well as for the last month. The formula for Total Sales is very simple. It’s just the sum of all the sales from a certain customer.
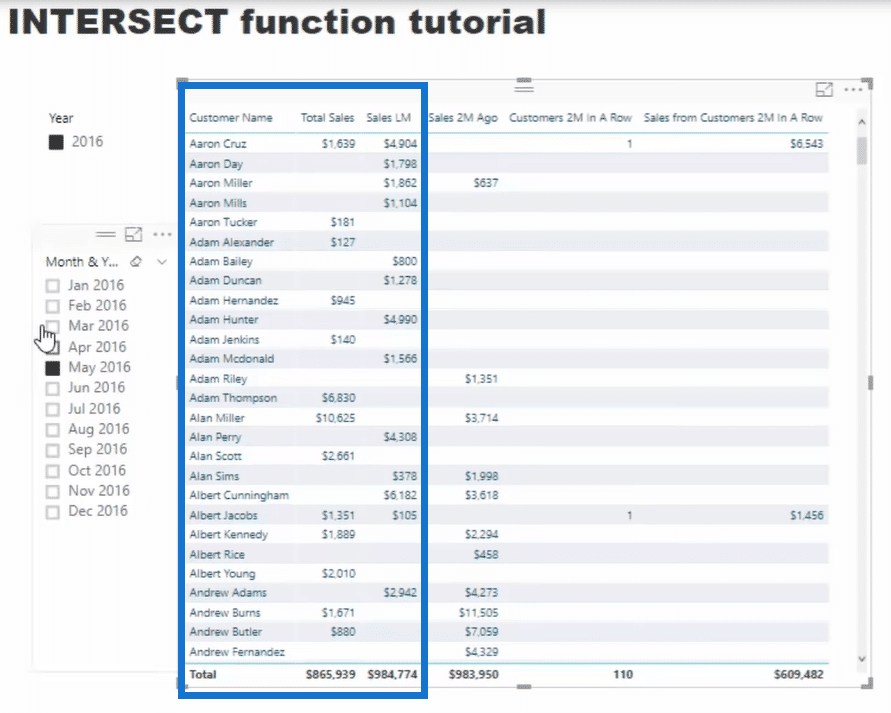
The Sales LM formula is a simple total sales formula branching out into a time intelligence calculation using DATEADD to jump back to the previous month.


It’s important to understand the initial context of the formula since we’re enabling a calculation of last month using the mentioned formulas. Thus, we need to get the initial context right so that we can apply the DAX formulas.

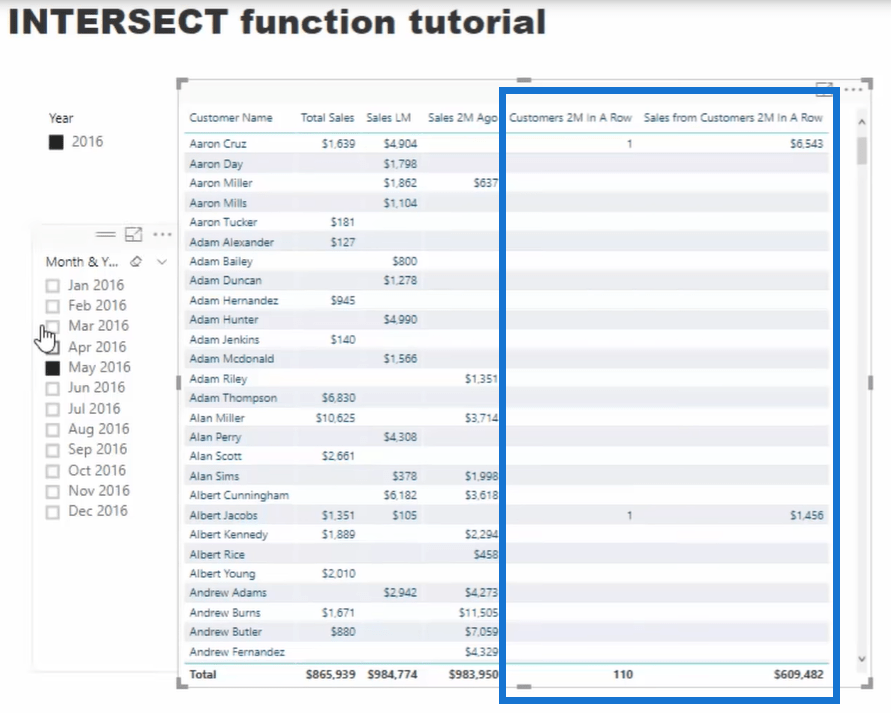
How do we dynamically work out the customers who purchased two months in a row? That’s what you can see in the Customers 2M in A Row column.
Now, I also want to know the total sales from these customers so I’ve added the Sales from Customers 2M in A Row column.
Identifying The Repeat Customers Using INTERSECT Function
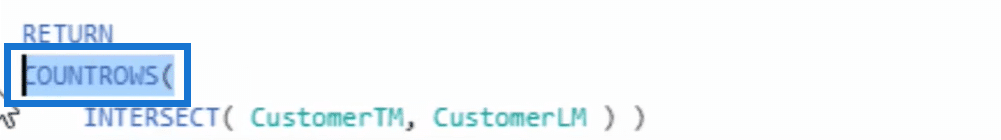
Let’s take a look at how useful INTERSECT is when it comes to finding out the repeat customers. Here’s the formula for Customers 2M In A Row.

In this formula, I placed two virtual tables, which are out variables (VAR) inside the INTERSECT function. Basically, it evaluates the list of items or rows that are present in the first table, but not in the second one.
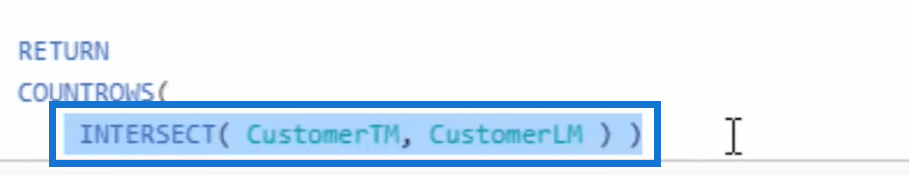
The initial table here is CustomerTM which stands for those customers who have purchased this month. Then, the formula proceeds to check whether or not these customers are also listed in the CustomerLM table.
If a customer exists in both of the virtual tables, they will be retained. Thus, this formula allows us to end up with all the customers who purchased this month and the month before.
Next, I used the COUNTROWS function to count those remaining customers.
Now, let’s talk about creating virtual tables for those customers who have purchased for 2 months in a row.

If you have noticed, I put them inside the VAR (variables) function. I highly recommend these functions as they are a fantastic addition to writing more complex formulas.
In this particular set for VAR CustomerTM, I’m creating a virtual table of customer IDs. Then, for VAR CustomerLM, I’m creating a virtual table again for our customers last month. But this time, I’ve added the CALCULATETABLE function, so that it can jump back to the customer set of the previous month instead of the current context.
Here’s what’s interesting about this calculation that we have now.
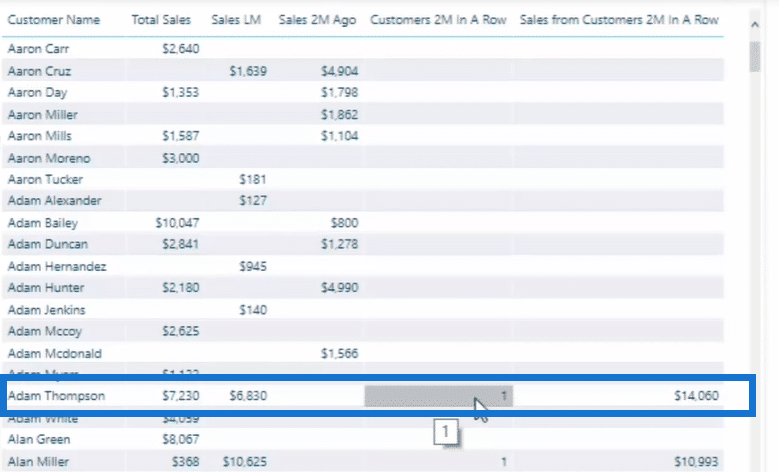
The formula only checks every single row of the customers because the customers are filtered. If there is no sales for the previous month for a specific row (customer), there is nothing to evaluate. Thus, the Customers 2M In A Row column is blank. But if a customer has a previous record, it then counts as 1.
For instance, if we look at the data for Adam Thompson, it returns 1 under the Customers 2M In A Row column. This means that this customer has a record for both last month and the two months before that.
Reusing The Formula For Another Context
You might not realize the importance of using INTERSECT right away, but there’s a really good reason why you need to use this formula. It’s mainly because you can reuse this calculation across a wide variety of contexts. Take a look at this example below.

To come up with the sample data above, I just used the same formula. But this time, I’m starting in a different initial context. Instead of evaluating one single row, it evaluates many contexts like the State Code. And then, it creates a list of customers who purchased in June 2016 as well as in May 2016. Then, I’ll compare it to those customers who purchased once in a particular state in the current month.

You can see in the Customers 2M In A Row column the exact count of customers matching up to that criteria.
Below that table is another visualization that showcases the same data for Customers 2M In A Row by State Code.
You can actually change the context in your model again depending on your requirements. If your filter is working correctly, you can reapply this formula to add to other situations.
This is why I said that INTERSECT is very powerful. Instead of just writing IF statements, you can utilize these INTERSECT functions to your formula.
Working Out the Total Sales from Repeat Customers
Moreover, we work on the total number of sales from our repeat customers.
The results in the Sales from Customers 2M In A Row column is the sum of the customer’s purchase for the current month and the previous one. Take note that we can only get this result if the customer has purchased for two months in a row.
This is the formula for the total sales of the repeat customers.

You can see here that the pattern is almost exactly the same. The only difference here is that instead of COUNTROWS, I used the CALCULATE function to change the context of the calculation.
This is because what we need here is the total amount of sales from the customers. But as you can see, I’m still using the INTERSECT function. It’s very helpful when it comes to Pareto Analysis. But you can also apply this function in a number of different ways.
Incorporating INTERSECT for Customers Last Three Months
You can still take things further than before. You can actually calculate the customers who purchased for three months in a row using the formula below.

All I have added is a different calculation that jumps back two months, instead of one.

After that, I’ve added an INTERSECT function inside another INTERSECT function. So, it will not only evaluate the customers for the current month and it’s purchase history last month. It will also check if the particular customer has also purchased 2 months ago.
To add this data into your table, simply drag the Customers 3M In A Row formula into the table.
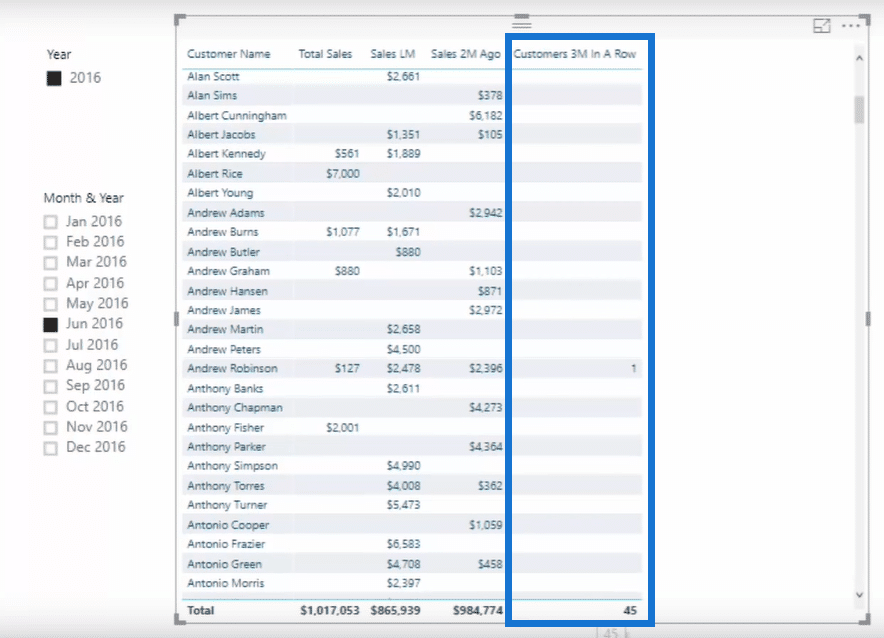
You’ll see in the bottom that there’s a total of 45 customers who purchased for three months in a row. This is quite an intensive insight that is very useful.
***** Related Links *****
How To Understand Virtual Tables Inside Iterating Functions In Power BI
Deep Dive Into RANKX – DAX Formula Concepts In Power BI
Implementing DAX Measure Groups Into Your Power BI Reports
Conclusion
As mentioned earlier, INTERSECT is a table function and it can be used in many different ways.
The focus with this tutorial is for you to see how you can utilize it in a measure and in various ways within a measure. That’s how I think this can be used in a very efficient way to run some exceptionally compelling analysis.
Good luck diving into this advanced Power BI tutorial.
Sam


