
In this tutorial, we’ll talk about DAX formula writing techniques and how to simplify models in Power BI.
We’ll discuss the key functions and methods to organize and make our model’s interface friendlier and easier to operate.
The methods we’re going to go through are formula syntax, measure groups, and formatting DAX codes in Power BI. It’s crucial that we understand these three topics in order to master DAX calculations and formula writing in Power BI.

We’ll discuss each of them and see their unique contributions and importance.
How A Formula Syntax Works
The formula syntax that we’ll be discussing is a bit different compared to other formula languages. But this is essential for our models in Power BI.
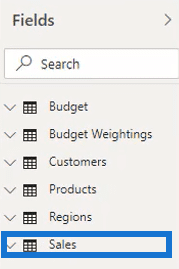
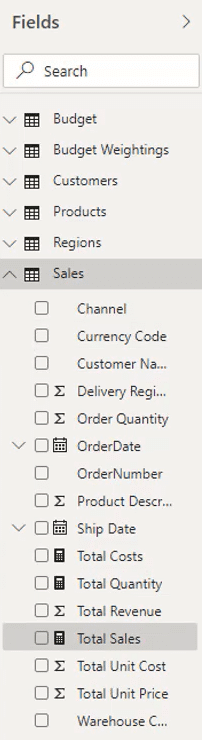
To start off, click the Sales table in the Fields area.
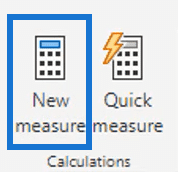
Then, click on New measure.
We’ll call this new measure Total Sales. Next, type SUM.
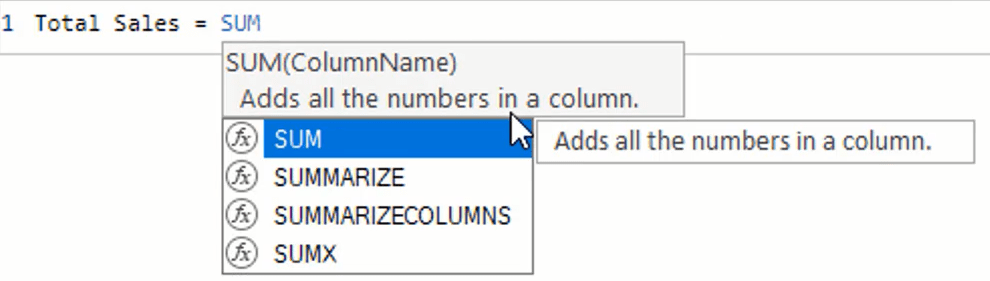
Information boxes are also present to explain the functions.

With DAX formulas, we have to focus on the tables and columns. Focus on the table we need to reference and the column within it.
Now, input Total Revenue inside the SUM function.

In Power BI, referencing the table always comes first, the column comes after.
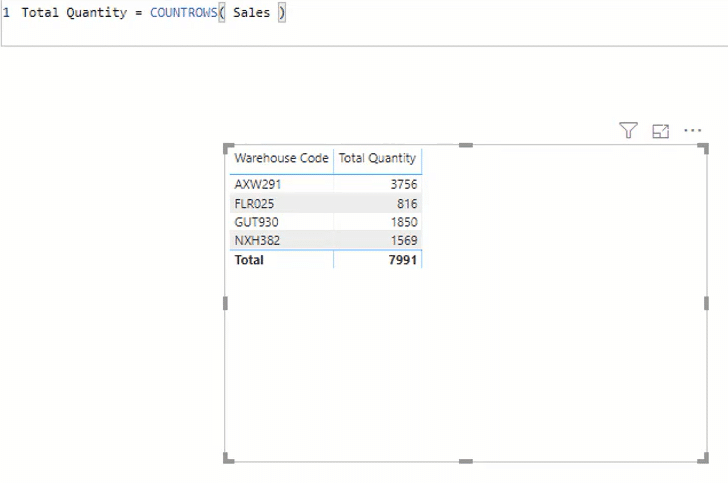
However, there are formulas, like the Total Quantity measure, that only require referencing the table.
If we use the COUNTROWS function, we can see that it’s only asking for a table.
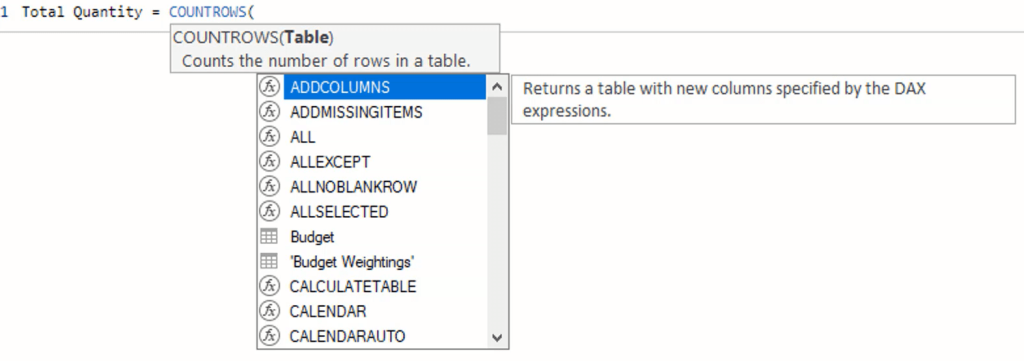
Next, reference the Sales table, and we’ll now have another measure that counts the total quantity we sold.

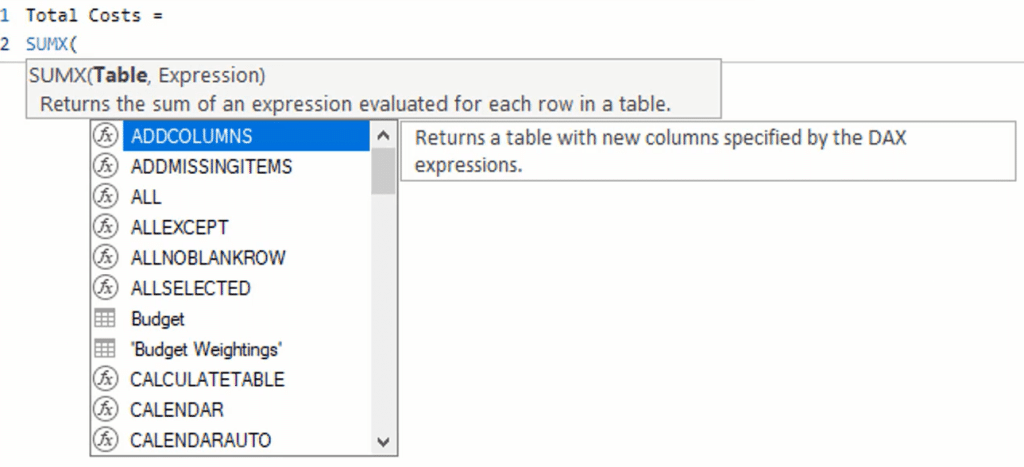
There is another measure in this Power BI example called Total Costs.
For this measure, we use the iterating function SUMX. This function returns the sum of an expression evaluated for each row in a table.
Next, reference the Sales table. Then for the expression, reference the Order Quantity column. Lastly, reference the Sales table again with the Total Unit Cost column.
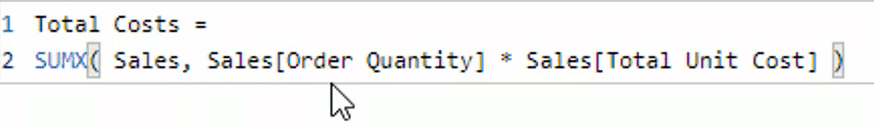
That is going to give us our Total Costs.
Importance Of Measure Groups
In Power BI, measure groups are used to organize DAX calculations. It’s highly recommended that we use them in our model as we start creating measures.
For us to run more analyses in our Power BI models, we need to create a lot of measures.
However, creating plenty of measures could give us a busy-looking model. So, we need to create measure groups to avoid mixing our measures and data tables.
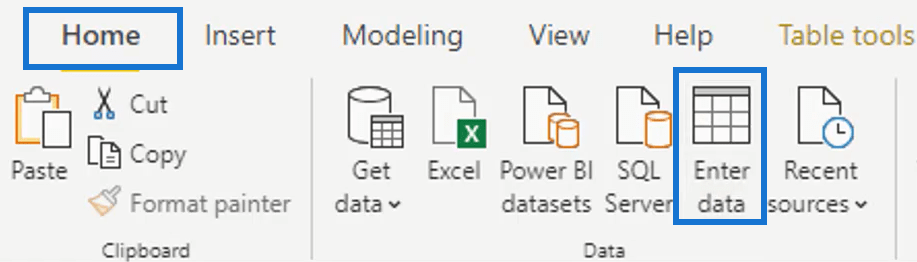
Creating a measure group is easy. First, go to Home and then click Enter data.
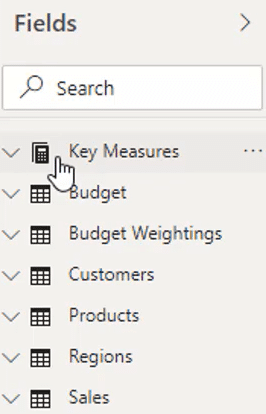
Next, create a dummy table and name it (Key Measures), then click Load.

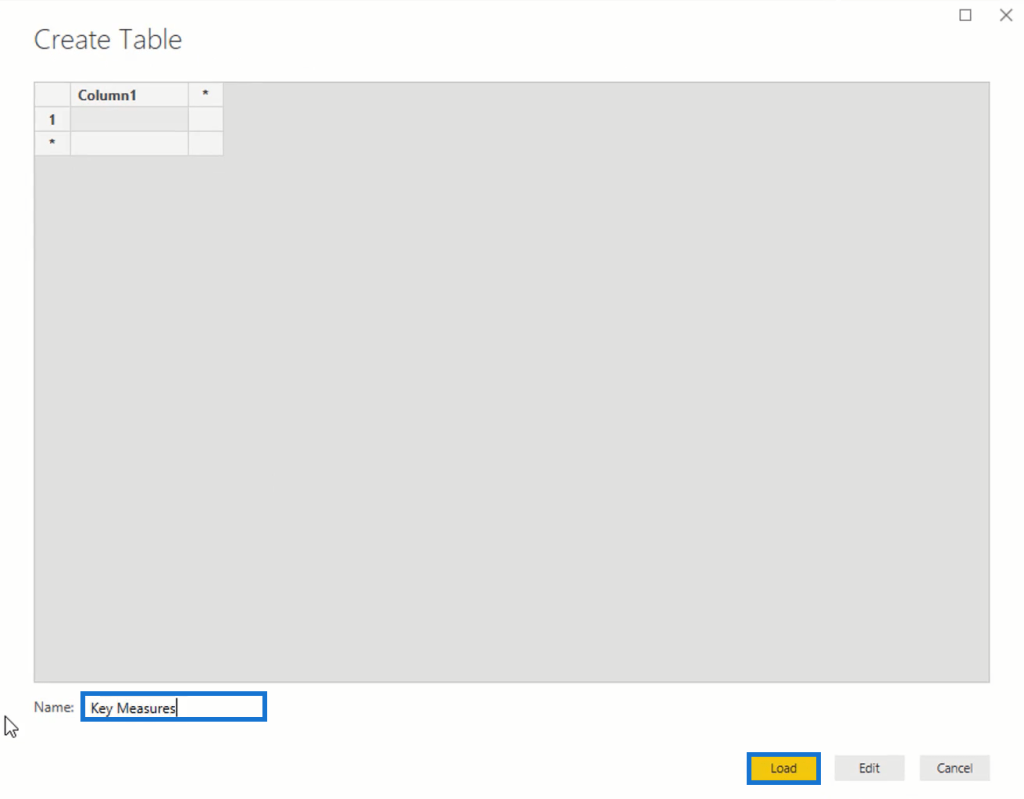
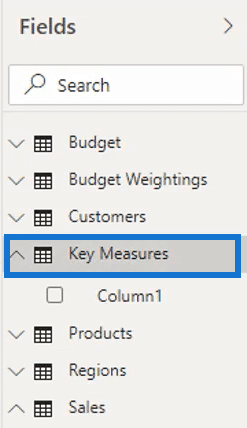
That table will then be in our report.
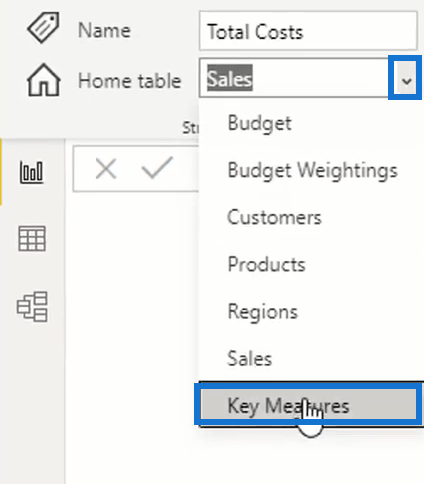
Next, move the other measures into the dummy table, Key Measures. Click the drop-down arrow and select Key Measures.
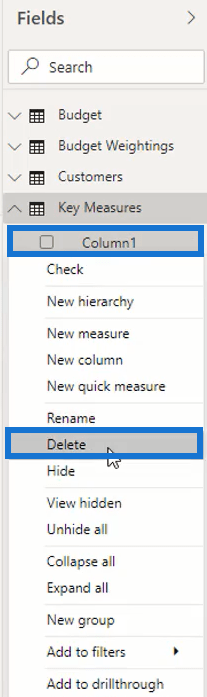
Once the measures are in the Key Measures table, we can now delete the dummy column or Column1.
Lastly, click the Show/hide pane twice.
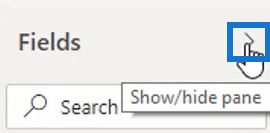
It will sort out and change the icon of the measure group like so:
This measure group is just one example. In Power BI, there are other groups like time comparisons group and moving averages.
In some showcase models in Enterprise DNA, we’ll see that we can have 6-8 groups or more.
Utilizing measure groups to organize our measures makes our model look clean and seamless.
The Value Of Proper DAX Code Formatting
Formatting a formula makes things simple in our model and doesn’t over-complicate our measures in our formulas and reports.
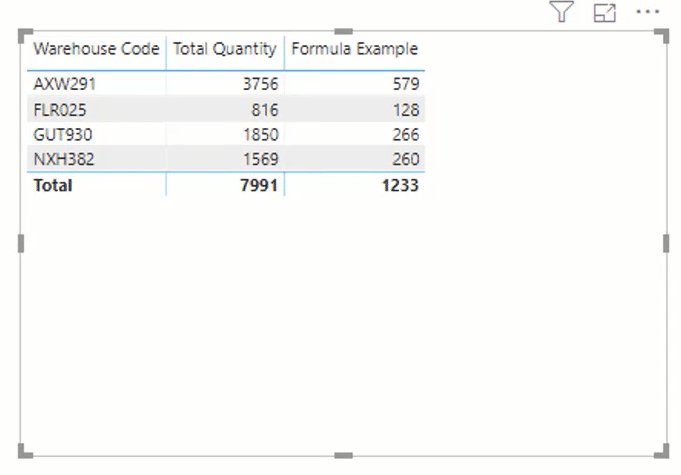
As an example, let’s say this is our Total Quantity and we want to do something advanced.
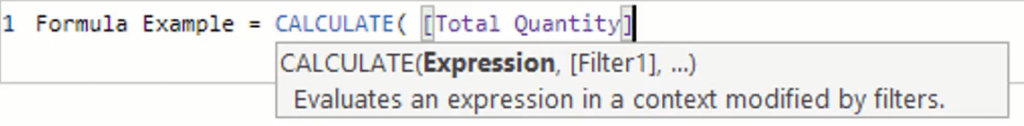
First, click on New measure.
Then, write Formula Example. Next, use the CALCULATE function and then add in Total Quantity.
After that, use the FILTER function for the Sales table. We’ll make the Customer Name Index greater than 5.

The Customer Name Index must also be less than 20. So, add another FILTER function to go through the Sales. Lastly, we only need to equate the Channel to the Wholesale.

Once we finish writing the DAX formula, we can now see the results. It’s just like the SUM formula in MS Excel, however, it’s a little complicated in Power BI.
The Use Of Indention For Key Functions
It’s important to format and organize formulas in our model.
It’s also recommended that on different rows, we place different key functions with different indentations. This makes it easy to understand what we’re trying to calculate if the functions are separate.
To do that, hold shift and press enter. Indent and place things on a new row when there is a key formula introduced.
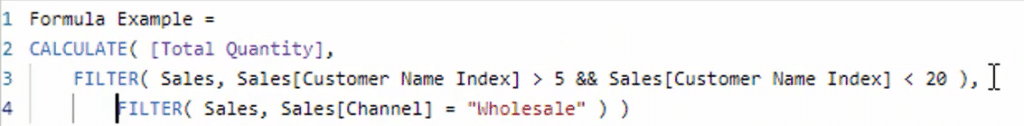
We can see that the function CALCULATE is on a different row as well as the FILTER functions. They are arranged so it can be read easier. This avoids confusion when making analyses for our model.
If we want to use advanced formulas like churn analytics, customer attrition, or even the IF statement, start off by indenting them. This way we can clearly see the flow of our calculation.

We just have to keep indenting every time we add more key functions. We won’t be disoriented with the dozens of calculations in our model.
***** Related Links *****
Implementing DAX Measure Groups Into Your Reports – A Power BI Modeling Review
Introduction To Filter Context In Power BI
How To Use The COUNTROWS DAX Function In Virtual Tables
Conclusion
In Power BI, we encounter a lot of models, functions, and formulas. With these writing formula techniques, we can improve how the calculations and models are presented.
What we’ve learned here are just some methods, like measure grouping and formatting DAX calculations, to help compute, simplify, and organize our analyses efficiently for a better presentation.
We can use them to have a better grasp of what’s happening in our data model.
All the best,
Sam


