When building workspaces in Power BI, you need to plan out how the data flows within your organization. An effective workspace allows you to create data sets that can be used across different reports. This eliminates the need to bring in data for each report every single time. In this tutorial, you’ll learn how to organize data sources in Power BI and create dataflows for reports in workspaces.
A dataflow is the connection between the underlying data source, such as a database, in a report.
Before this feature was added to Power BI, users needed to bring in a dataset every time they created a report or workspace.
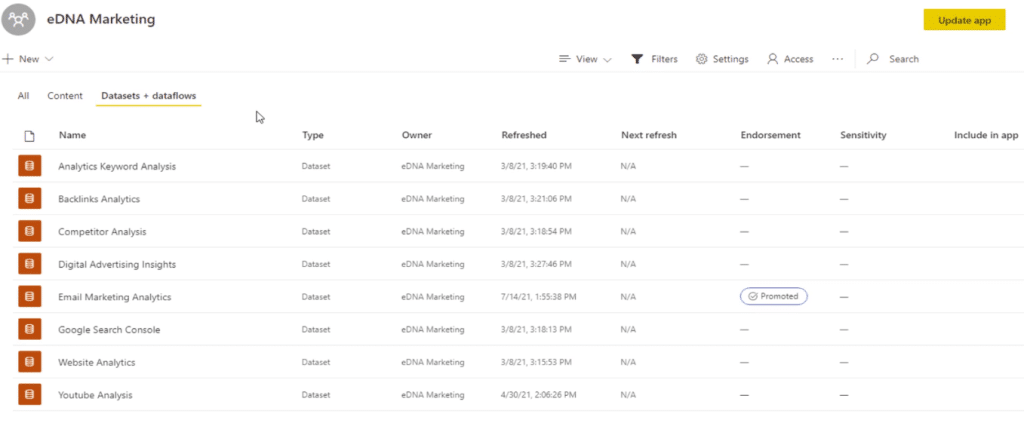
Dataflows are completely cloud-based. You only need to publish a dataset on the Power BI service and it will then be available for use in any report in the workspace.
Organizing Data Sources In Power BI
One of the ways to manage the data flows in your workspaces is by using the Data Pipeline Planner in the Analyst Hub.
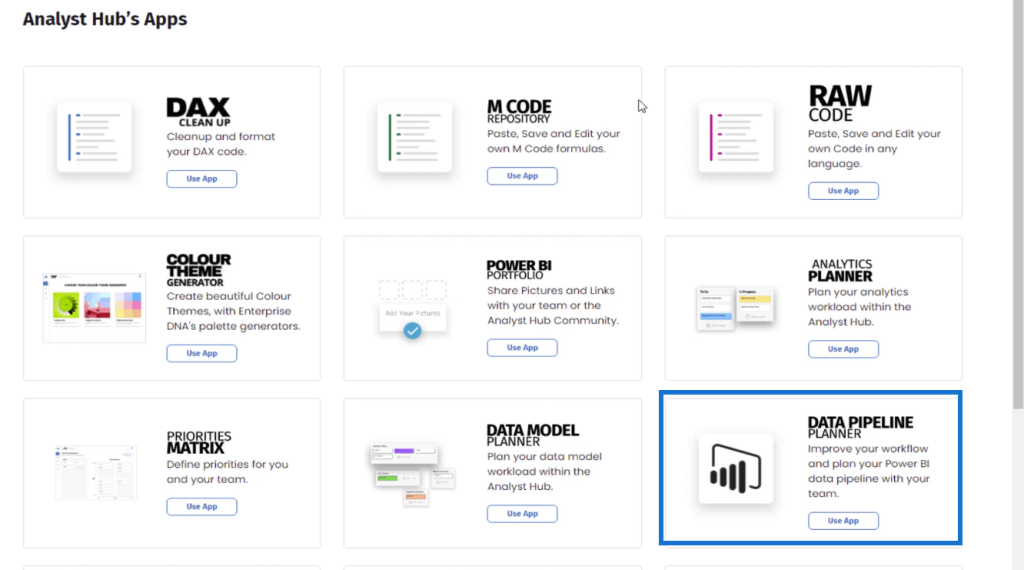
The Data Pipeline Planner enables you to list, document, and organize the different data sources you’re using in Power BI. This can be used as a reference point in making sure that all the datasets are accessible and optimized once they’re needed in a Power BI report.
To organize dataflows, you can group them by Report Data Sets and Workspace Dataflows & Datasets.
Then, prepare a list of all the data sources in your organization. Evaluate each one on whether they can be used in multiple reports or not. Afterwards, place them in their respective categories.
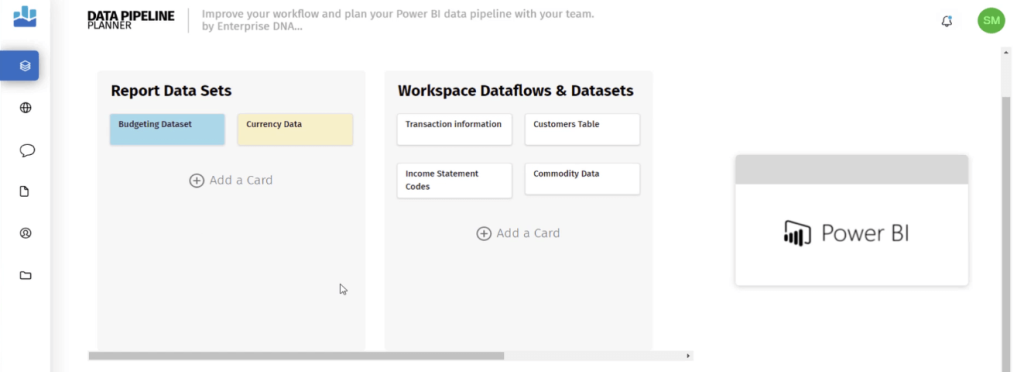
This gives you a clearer idea of the data sources you need to consolidate in your workspaces.
A great thing about the Analyst Hub is that it allows users to collaborate with each other. Other Power BI users with access to the workspace can view the Data Pipeline Planner and then share their insights and make necessary changes. Once the planner is finalized, the developers, or those in charge of the workspace, can view the document and create the required dataflows.
Using The Analytics Planner
Another way to organize your data sources in the Power BI service is by using the Analytics Planner in the Analyst Hub.
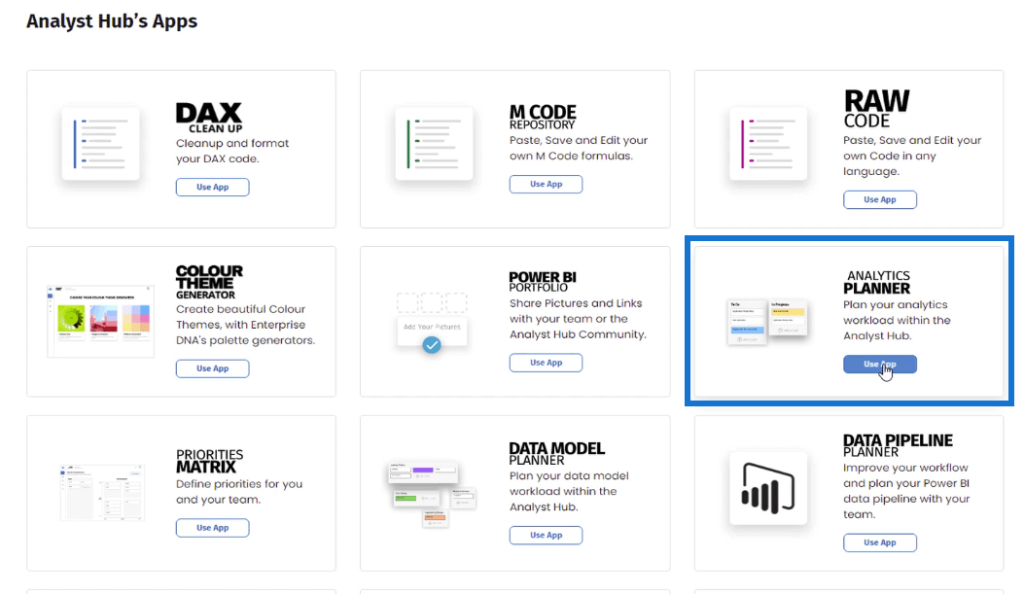
In the Analytics Planner, you need to plan out and list the core reports you’ll be creating in Power BI. Then, list out the needed insights under each core report.
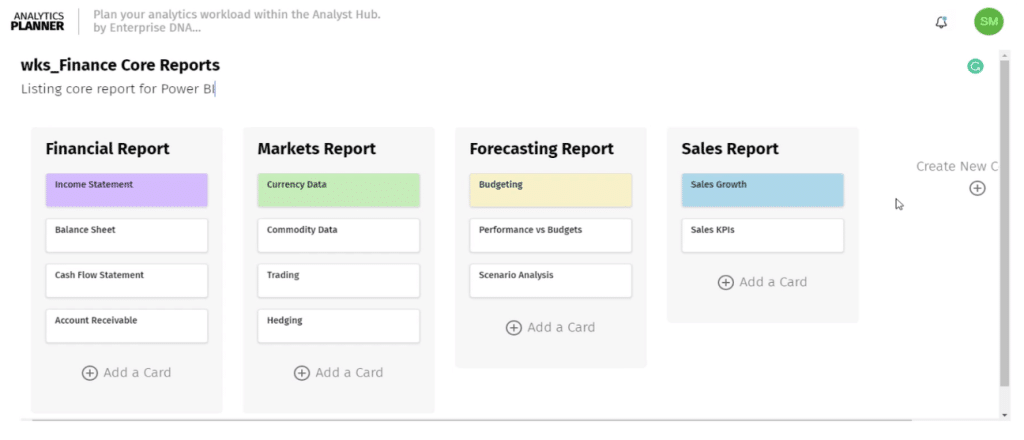
You can also apply a color-coding scheme to add a distinction between each insight.
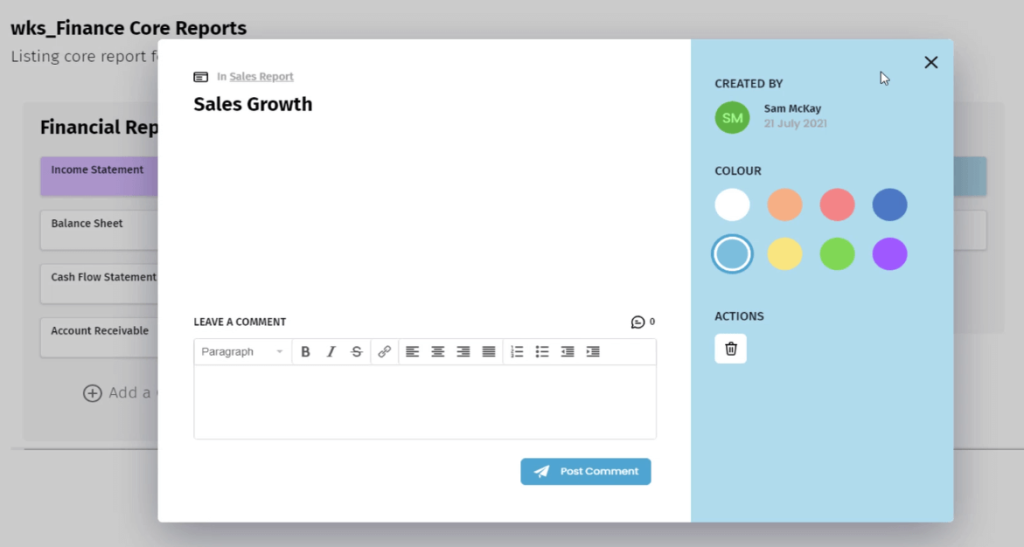
By organizing your core reports, you’ll be able to prevent redundancy and non-standard practices in individual workspaces. This brings order to report creation and gives developers a more targeted approach on how the workspaces should be set up.
It’s important to create an Analytics Planner during the planning stages of Power BI deployment. However, you can continue to review and revise it according to current business needs.
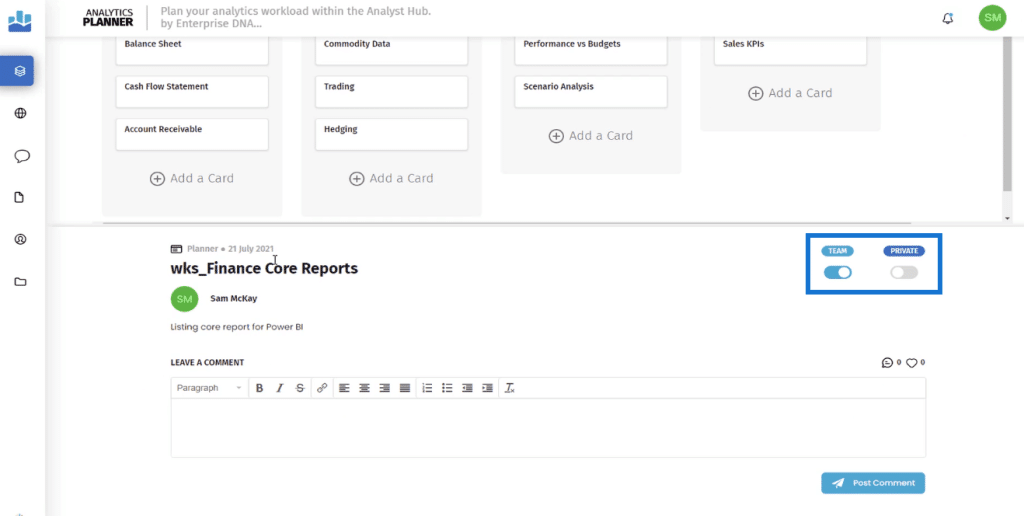
Don’t forget to save this as a Team document so that other members can access it.
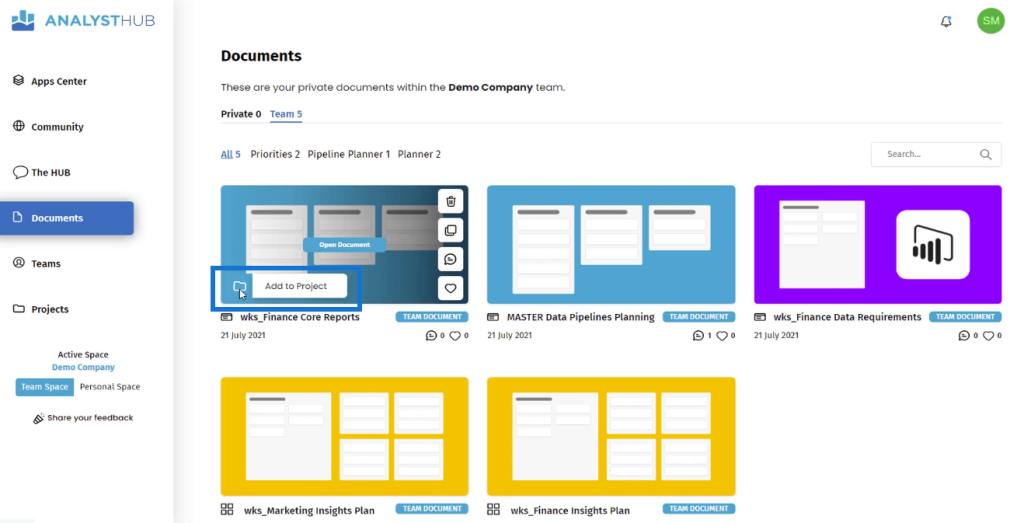
It’s recommended to place the documents of each department in different projects so that the workspaces in the Power BI service remain uncluttered.
***** Related Links *****
Power BI Dataflows And Why They Are Important
Querying Data From Multiple Data Sources
Managing Workspaces In Power BI And Analyst Hub
Conclusion
Effective workspace management is a determinant of a successful Power BI deployment. It allows you to optimize and transform data and data models. It will also help forge an efficient way of creating reports and visualizations, along with information distribution.
Overall, workspace management is crucial in Power BI to improve efficiency, collaboration, and data governance, which ultimately leads to better decision-making and a data-driven culture within the organization.
All the best,
Sam McKay


