
I’m going to go over quite an advanced data segmentation technique in this tutorial, which is around grouping data in a dynamic way inside Power BI. You may watch the full video of this tutorial at the bottom of this blog.
In this tutorial, we’re going to specifically look at just this particular visualization in this dashboard I used during a Learning Summit around customer insights.
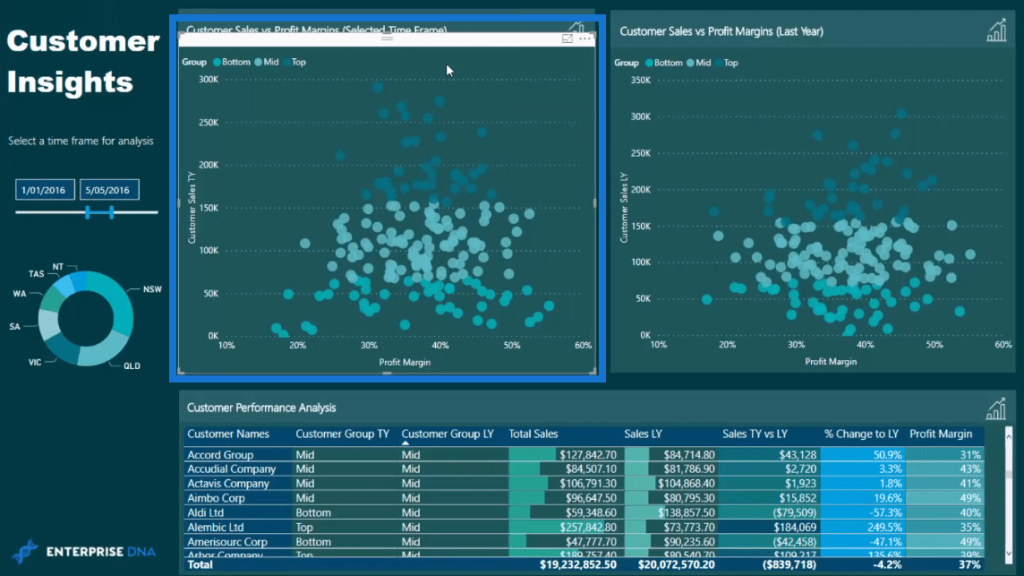
In this case, we’re grouping or segmenting customers based on percentage of sales. We utilize a secondary table or supporting table and combine it with DAX formulas to create this grouping.

Segmenting Customers Based On Sales Percentage
One group is in the top 20%, another group is between 25% to 80%, and the third group is in the bottom 25%. I’ve utilized those percentages and fed them through a DAX formula to then create these groups of Top, Mid, and Bottom.
The segmentation in this case is based on sales so this is a chart showing Sales versus Margins for any particular time frame, but the segmentation has occurred via sales.
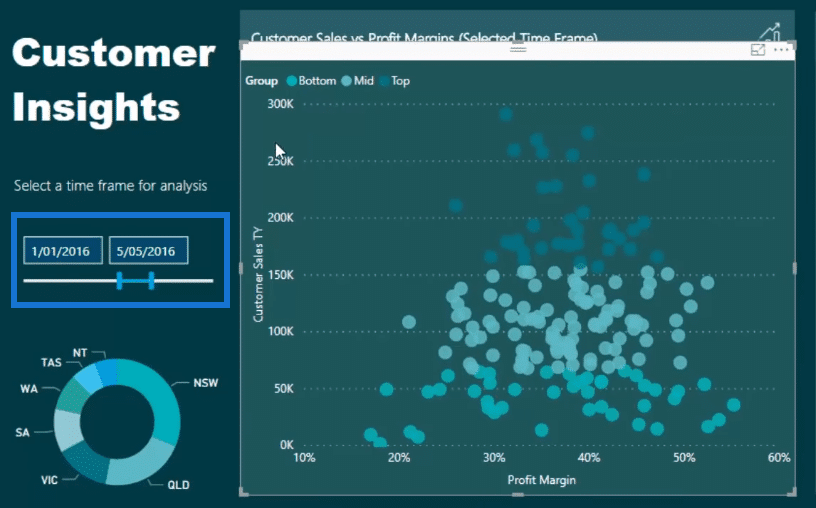
We can see in this scatter chart the Top 20% of customers; they are represented by the dark blue spots. The Mid customers are sitting from a sales perspective between 25% and 80%; they are represented by the pale blue spots in the middle part of the chart. The Bottom 25% of the customers based on sales are the light blue spots at the bottom part of the chart.
This is quite an advanced technique for data segmentation, where we incorporate some advanced logic inside the calculations to create these groups that just don’t exist. In other words, there’s nothing in our raw data that exists to break out the top 20 of customers, bottom 25%, etc.
So we need to create that logic using a supporting table or a secondary table, as I call them. This table doesn’t have any physical relationship with any of our tables in the data model, but it’s the key to this type of analysis.
Utilizing A Secondary Or Supporting Table
So let’s have a look at the table. You can probably create these groups in many different ways, but this is how I set it up for this demonstration.

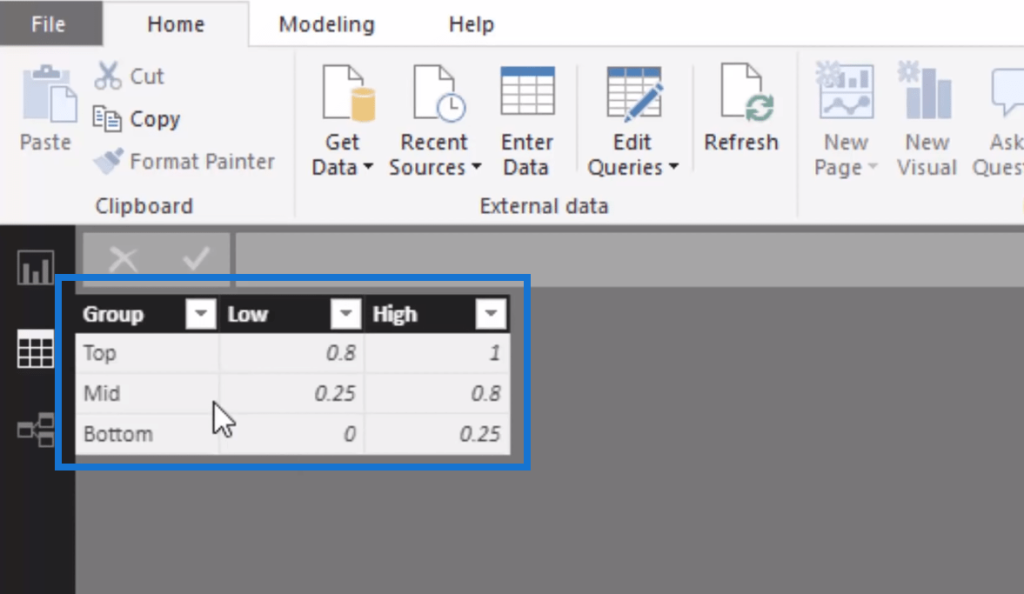
In this supporting or secondary table, we have our Groups as Top, Mid, and Bottom. We have the Low column and the High column to identify which segment each customer belongs to.
This secondary table of percentages can actually be reused across many different measures. We could use sales and we could easily integrate margins or profits or costs, or any other calculation that we can do. It doesn’t even have to be sales or revenue related.
We can also reuse some of the logic because percentages can be on anything. What’s important here is to create the correct logic inside the formula.
So let’s dive into the formula, which I called Customer Sales TY (this year) and go through how I did the logic.
Working Out The Variables
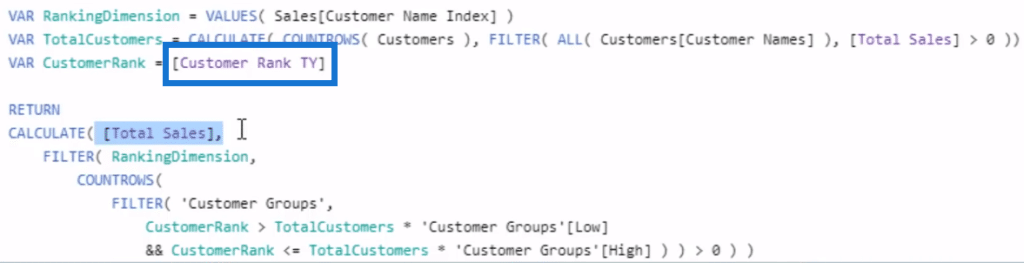
Let’s go through the first part of the calculation first, where we work out the variables (VAR).

The first variable is to identify the RankingDimension that we’re going to be working through. In this case, it’s customers. With the VALUES function, we iterate through every customer that has made a sale in any particular time frame.
The next variable is TotalCustomers, which is working out how many customers actually made a sale. We don’t want to count all the customers, but rather only those who made some sales. In this logic, we’re using the CALCULATE, COUNTROWS, FILTER, and the ALL functions.
The third variable is CustomerRank, where we’re ranking our customers based on the sales that they’ve made. And this is the formula for Customer Rank TY.
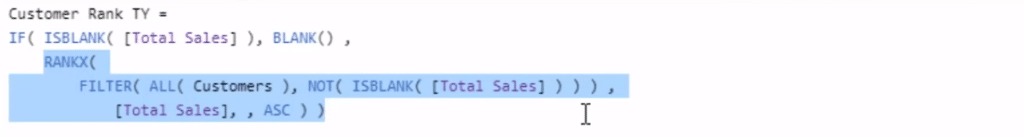
This particular formula is just doing a simple ranking, which uses the RANKX function.
Logic For Data Segmentation
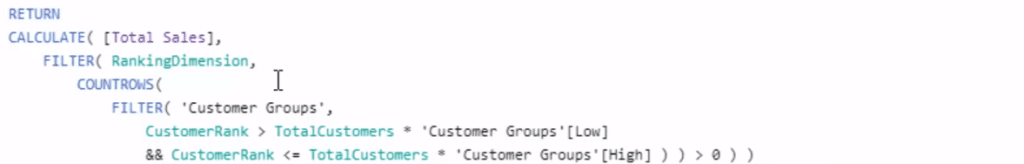
Now let’s dive into the rest of the calculation. This is the logic that enables us to achieve this data segmentation analysis.
The CALCULATE function iterates through each customer and evaluates through that supporting table (Customer Groups) we created with the COUNTROWS and FILTER functions.
And then it evaluates whether the CustomerRank is greater than the TotalCustomers and then multiplies it by the Customer Groups Low column. So it’s asking us whether the CustomerRank is higher than the bottom.
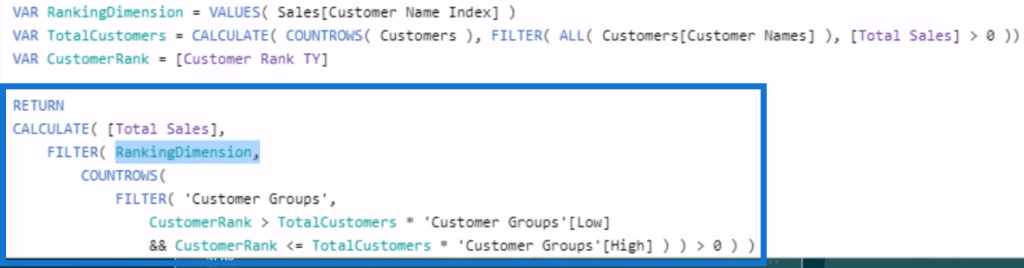
And then in the next row it highlights whether the CustomerRank is less than or equal to the TotalCustomers; it is then multiplied by the higher bin of the Customer Groups table.
If it’s going to equal to true, that customer will be retained and we’ll get the total sales.
How To Re-Use The Data Segmentation Formula
This formula is a bit complex, but it’s really an interesting one. We re-use this calculation as well.

For instance, if we want to look at our customers by a different metric, such as a Profit Margin, all we need to do is replace the Total Sales here with Profit Margin and change the Rank based on profit margins.
Then we can utilize exactly the same supporting table to run this logic through.
***** Related Links*****
Use DAX To Segment & Group Data In Power BI
Segmentation Example Using Advanced DAX in Power BI
Group Customers Dynamically By Their Ranking w/RANKX In Power BI
Conclusion
This is a more advanced technique about data segmentation that I have demonstrated in this tutorial. We utilize the power of DAX and the data model with our supporting table.
It’s amazing what we can do with the entire formula. We can change the time frame, and it will always divide up customers by those specific percentages we set up.
I hope you have found great value from this tutorial and apply it to your own work.
All the best!
Sam
***** Learning Power BI? *****
FREE COURSE – Ultimate Beginners Guide To Power BI
FREE COURSE – Ultimate Beginners Guide To DAX
FREE – 60 Page DAX Reference Guide Download
FREE – Power BI Resources
Enterprise DNA Membership
Enterprise DNA Online
Enterprise DNA Events


