
In this Power BI Showcase, we focus on the CRM Sales data commonly found in Salesforce or Microsoft Dynamics. You may watch the full video of this tutorial at the bottom of this blog.
We want to gain insights into the future Revenue derived from a specific client set. In this case, we have a client set based in the New Zealand market.
We have key metrics on the clients, and on their deals that are completed and in progress. Some of these metrics include the client name, account owner, the product or service sold to the client, and the potential Sales in the pipeline.

There are also numeric data points for the Current Revenue per client, the Target Revenue, which is set at the beginning of the financial year, and the estimated duration of deals per client.
This Power BI Showcase is broken into four different reports.
Sales Overview
The first report contains an overview of the Current Revenue achieved for each client.

We can also see the products we’re selling and where the bulk of our Revenue comes from for each location.

There are also different breakdowns for our sources of Revenue.
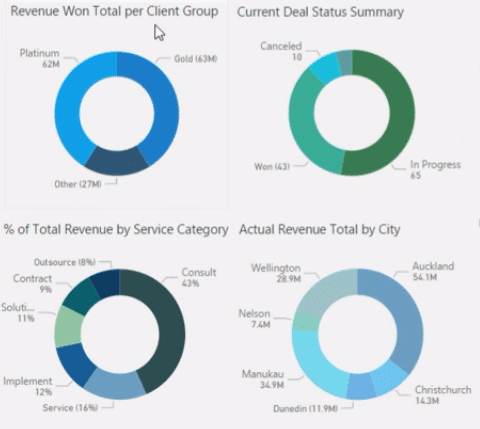
This report contains charts that show Revenue per client grouping, by service category, and by region.

Sales Opportunities
The second report focuses on current Sales Opportunities.

We can see the potential sources of our Revenue which helps in our resource allocation. This analysis is common in CRM Sales solutions.
With this information, we can place a probability on when a sale is going to occur. We’re able to break down the chances of having a successful sale.
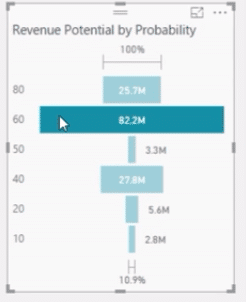
Linking the data model in the report allows us to filter the information shown in the visualizations.
We can see which Sales opportunities are most or least likely to be completed. This data can be easily filtered across different key metrics for each client set.
Client Account Analysis
The third report in this Showcase dives into Client Analysis.

The key metrics are located on the left-hand side of the report.
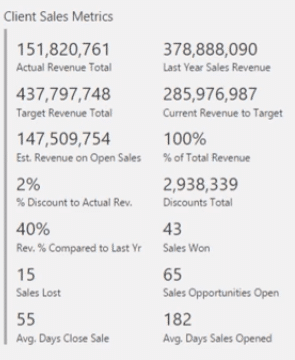
We can easily dive into each client and analyze our Sales performance. With this insight, we can identify the potential revenue we need to achieve for specific clients.
Another analysis we can get out of this report is on client subsets or groupings. If we know which clients belong to the same industry, we can easily identify the Sales targets we haven’t yet achieved per group.
Key Potential Sales
The last report focuses on Key Potential Sales.

We can see what pipeline phase the key Sales are currently in.
In this example, the majority still belong to the Qualifications phase. So, we still have things we need to do to improve our pipeline throughout the rest of the year. We want to see more key Sales move into the decision or solution design phase.
This report allows us to easily drill into which pipeline phase our clients belong. After knowing this information, we can connect with our sales representative or with the client to make sure that we can convert those potential Sales to actual results.
***** Related Links *****
Revenue Forecast Technique For Project Data – Power BI Insights With DAX
Break Out New Customer Sales – Advanced Power BI Insights
Showing Difference Between Sales And Budgets To Date – Forecasting In Power BI
Conclusion
This Power BI Showcase presented four different reports where we can get valuable analysis on our current and potential Sales.

The insights generated by these reports are particularly useful for CRM Sales data commonly used by businesses. They can be utilized to create strategies to further improve the trends in Sales.
All the best,
Sam
[youtube https://www.youtube.com/watch?v=96akmpuVN0E?rel=0&w=784&h=441]


