
In this blog, we’re going to go over how you can create automated forecast from historic data in Power BI. This is common in businesses to make forecasts and budgets. You may watch the full video of this tutorial at the bottom of this blog.
Now, have you ever wanted to create automatic forecasts based on historical information? In the past, this was relatively difficult to do using tools like Excel, but you can do this easily inside Power BI.
Historically, you might have retrieved information and summarized it in a table, and used that as a benchmark. But in the video, I show you how you can create benchmarks and forecasts dynamically. This is a more effective and efficient way to project numbers forward and enables you to compare how you’re actually performing against a prior period or a combination of prior periods.

What we’re going to do is look at historical time periods and use those as values in our equation to project a forward forecast.
I’m going to utilize time intelligence functions in Power BI to showcase how you can do this in a very dynamic way.
By combining multiple techniques in Power BI using DAX, you can achieve these really great insights. In this case, we’re just drilling into forecasts and trying to create forward benchmarks, so that we can compare our actual results against something that actually makes sense.
How To Create Automated Forecast From Historic Data
In a lot of cases, your forecast is derived from your historical results. So I’m going to show you how you can quickly grab historic data, consolidate it, and then create a forecast from it, which is still align to your entire data model.
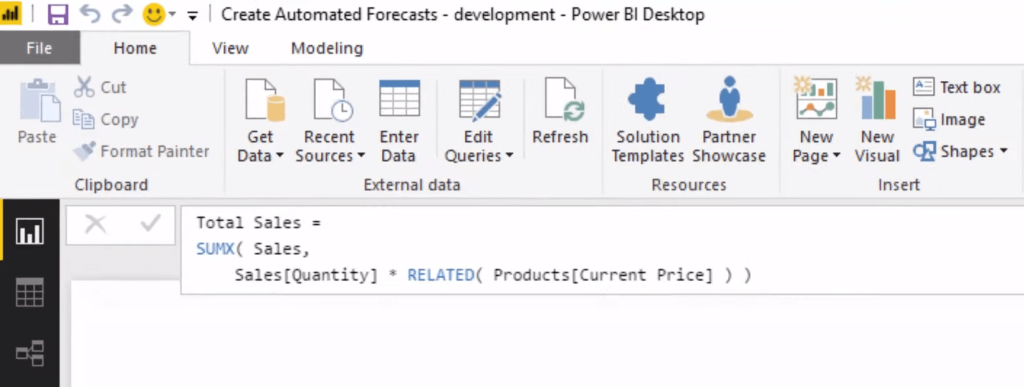
Let’s assume that we already have say some sales information already and we have our Sales calculation here.
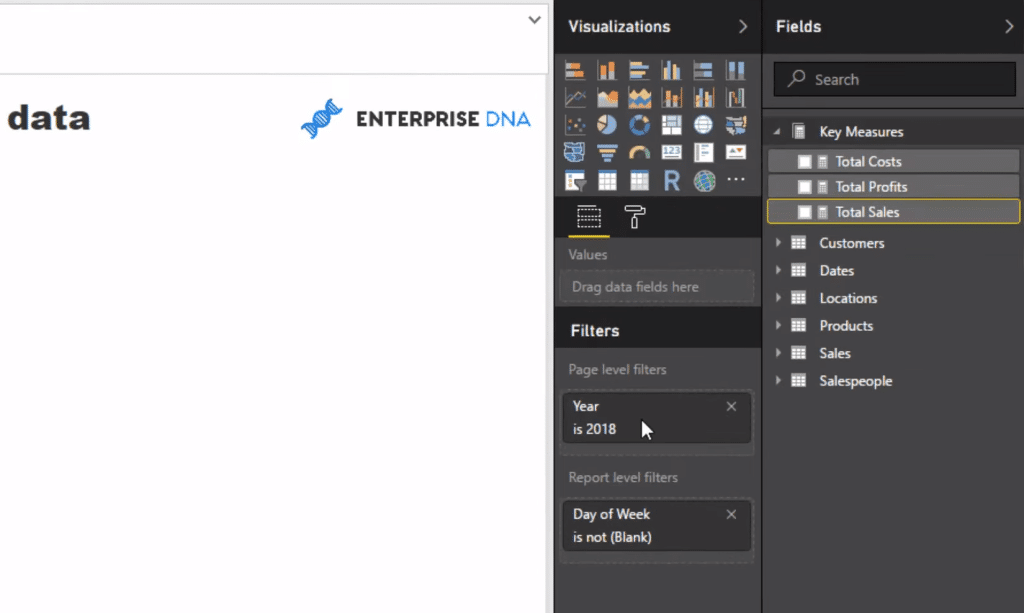
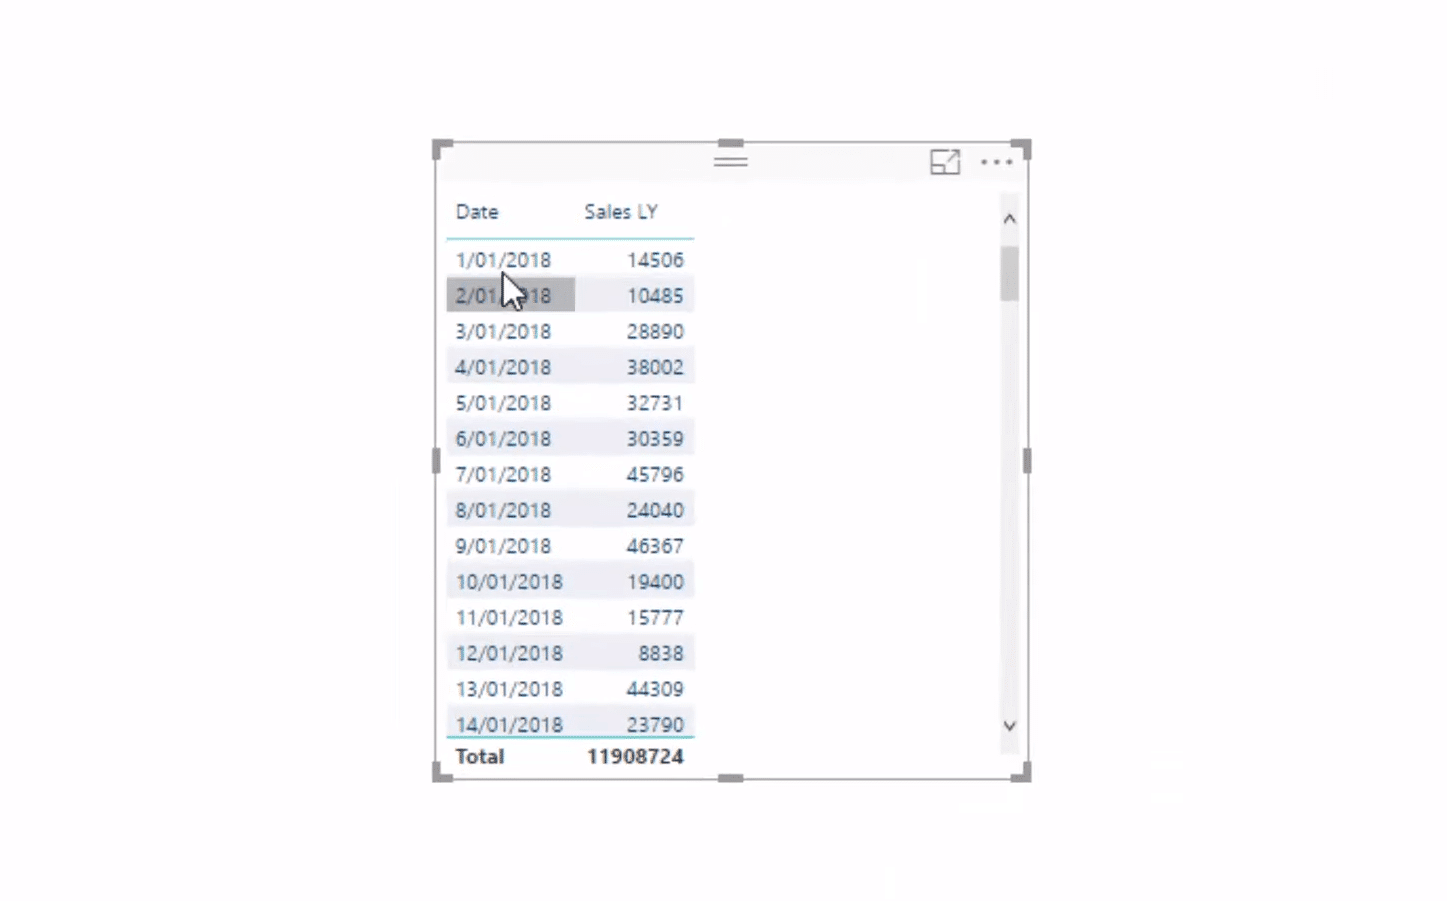
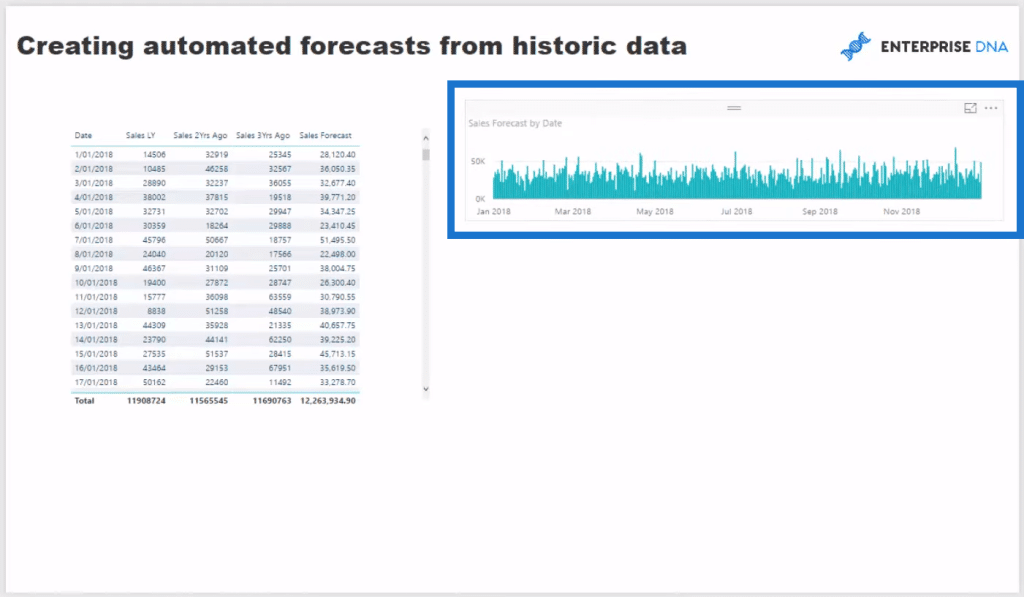
So we need to find a way to project forward to 2018. We want to work out our sales forecast in 2018. If you look at this filter down on the right-hand side, I’ve actually filtered for only 2018, so we’re only looking at 2018 here.
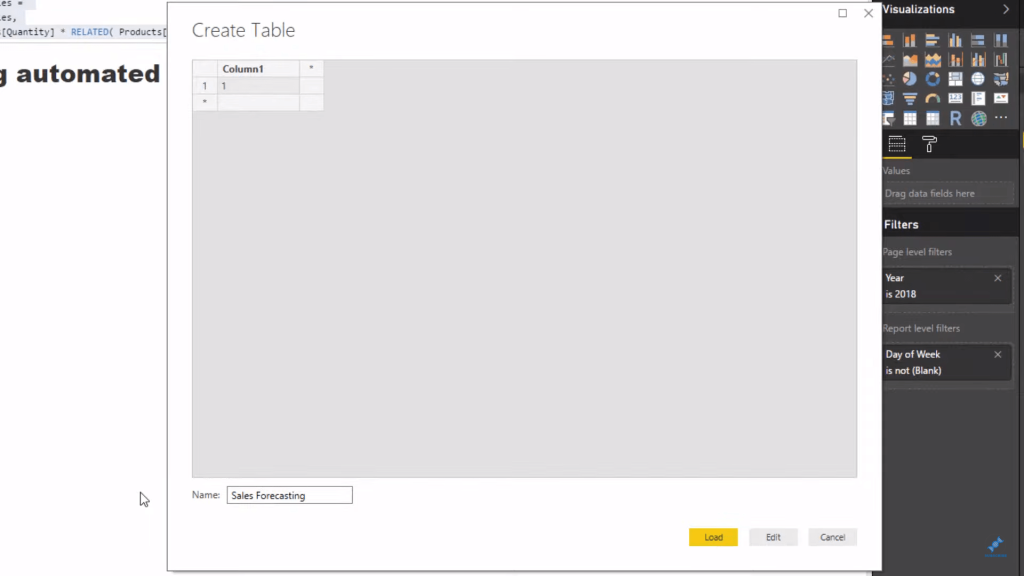
Now we create another measure table by clicking on Enter Data and it will give you the option to create a measure table. Let’s call this table Sales Forecasting. If you can get into the habit of creating these measure tables, it would benefit you immensely in terms of organizing your model.

Next is we create a new measure using time intelligence functions to make our sales projections from 2017’s numbers. So we go to New Measure, and let’s call this the Sales LY and go CALCULATE by Total Sales. We could do the same for any any of our metrics, but in this example, we’re going to work on Sales.
And we need a DATEADD, which is one of the best time intelligence function just because of the flexibility you have with it. Then, we jump back one year here (-1), and put our interval (YEAR) up here. Then, push Enter.

If we grab this and drag it to the table, we’re going to see that we are now projecting forward all of the data from 2017. So we got our first column of information of the three that we’re going to calculate today.
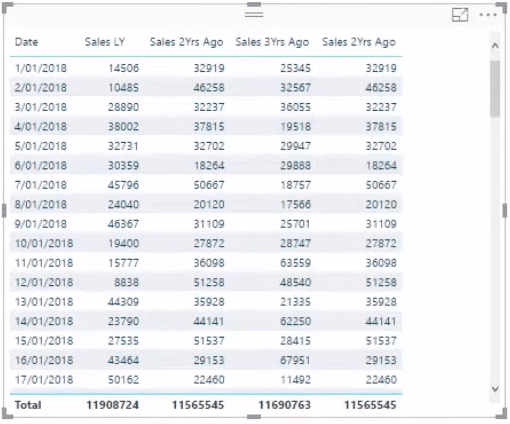
In this sample scenario, we have to jump back two years as well because we want to work out three years forecast. So to do the second year, we simply copy the pattern, and just make a couple of adjustments.
We change the name of the measure and the parameter inside, and we’re now projecting our sales from two years ago. We will also do exactly the same for the 3 years ago.

And now we have three years of information that we can now create into our forecast.
Using Variables To Create One Measure For A 3-Year Forecast
There’s another way to do this in an efficient way to create a Power BI forecast. We’ll use variables to create one measure, instead of three, and get exactly the same result that we seek.
So we go to New Measure once more and for this, let’s call it the Sales Forecast. We go VAR (variables), then Sales LY on the next line. We do the same on the next couple of rows for 2 and 3 years ago.
After which, we can jump down and go RETURN, and here’s where we can put in the logic. We use DIVIDE with our three years of data, so we sum up Sales LY, Sales 2 years ago, and Sales 3 years ago. Then, we divide it by 3. We’ll also put our alternative result,which is 0.
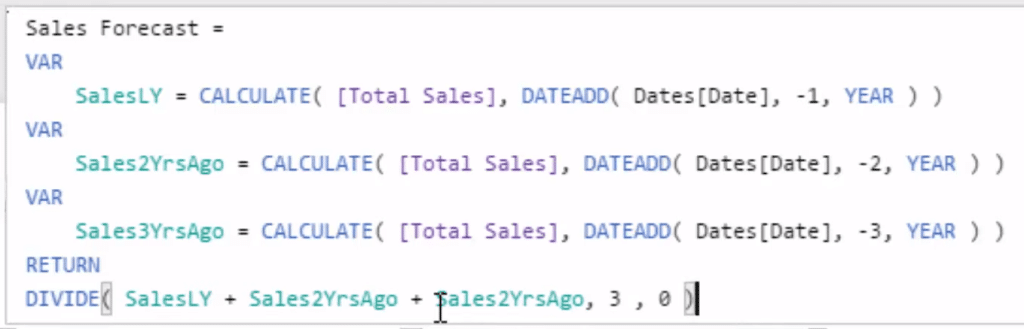
We just put all three of the measures we made earlier inside of variables, we get the same result. I highly recommend this, as it is more efficient. We have now our sales forecast and we have an average of all of these three.
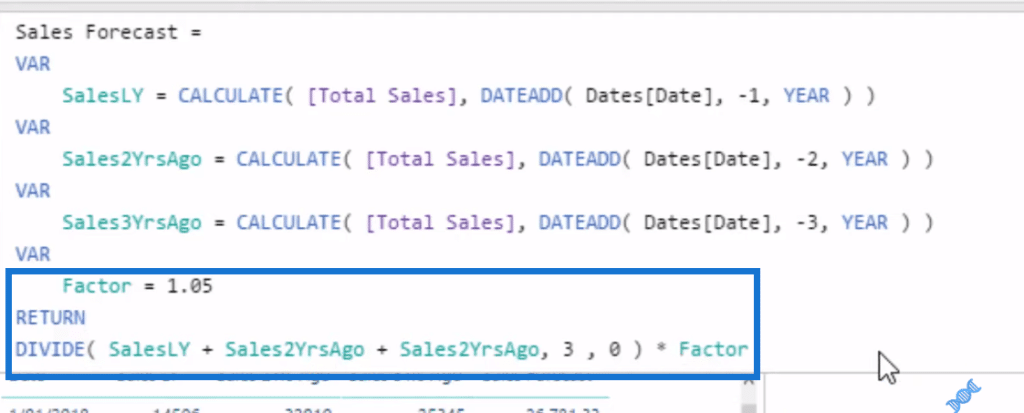
Moreover, we want to see some increase in our sales, right? So let’s do a forecast to showcase a five percent growth rate. To do this, we simple add a FACTOR in our formula, and then multiply the last row by the factor.
Creating The Visualization
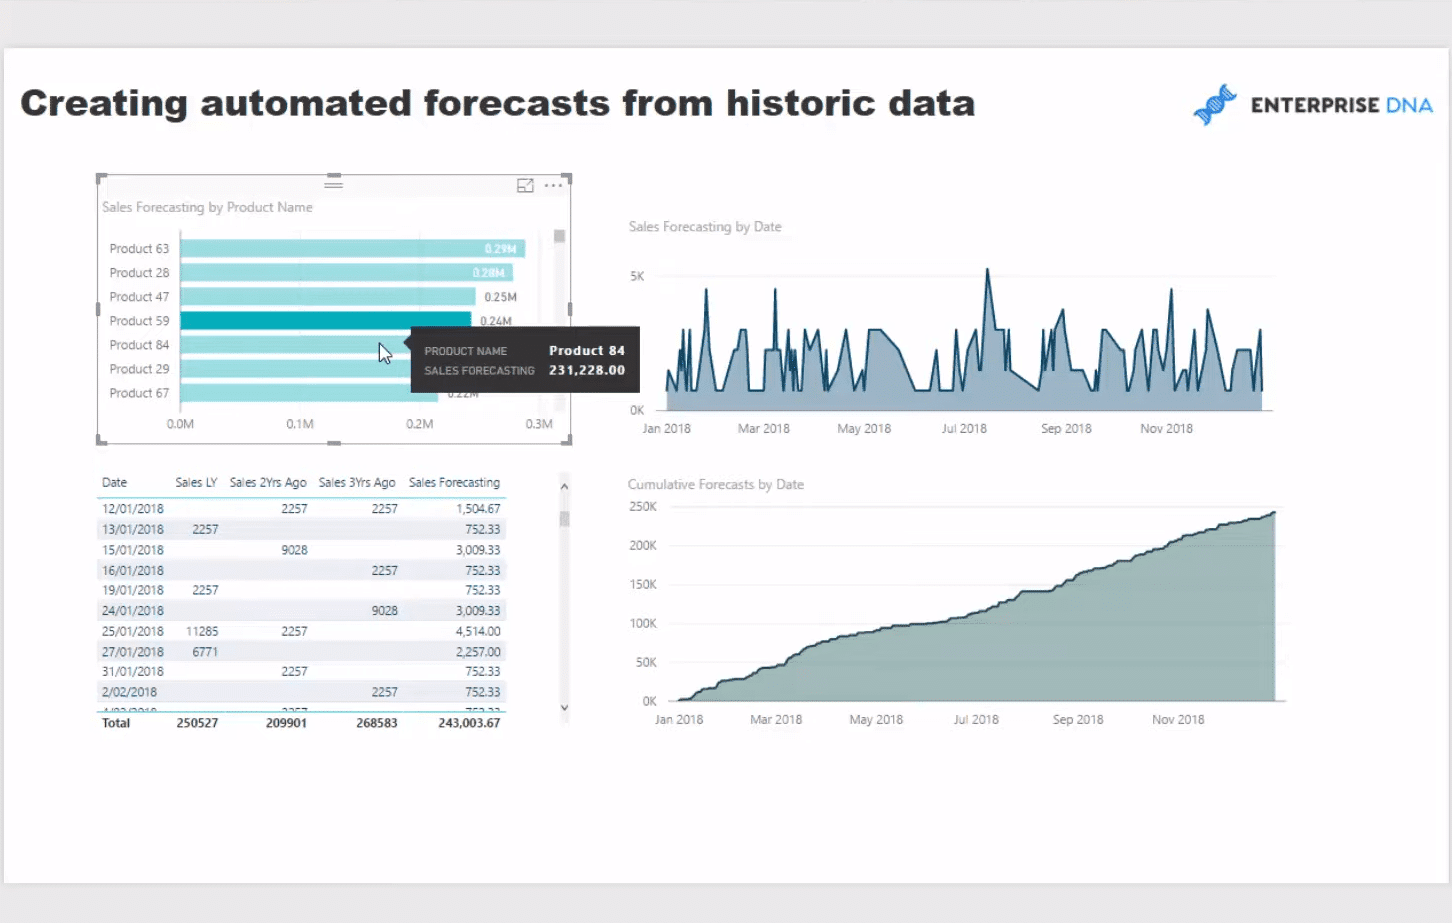
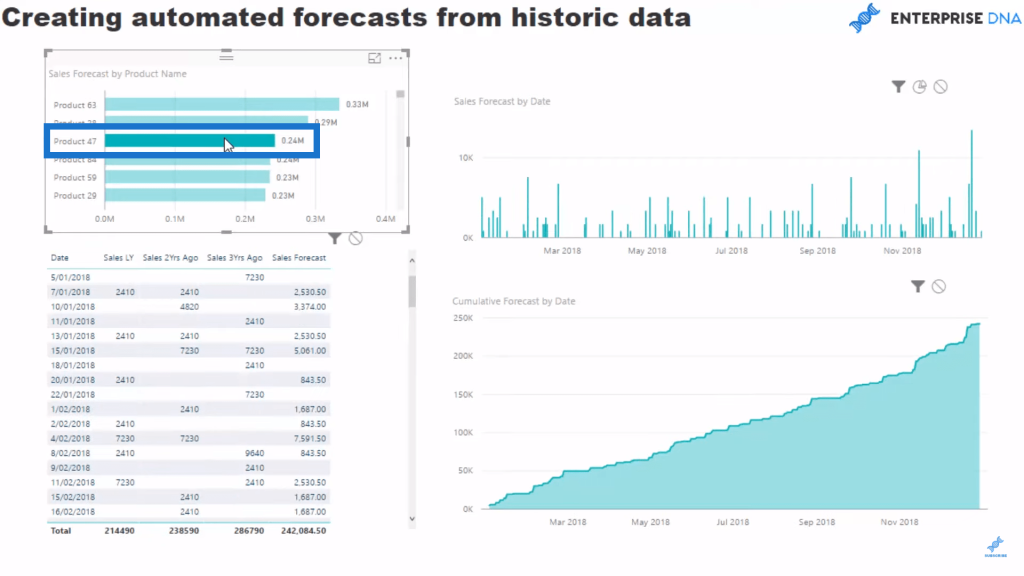
Once all the needed formulas are created, we turn this into visualizations and see clearly our Power BI forecast. And we now have a virtual sales forecast that showcases how much we need to make every single day to reach our forecast.
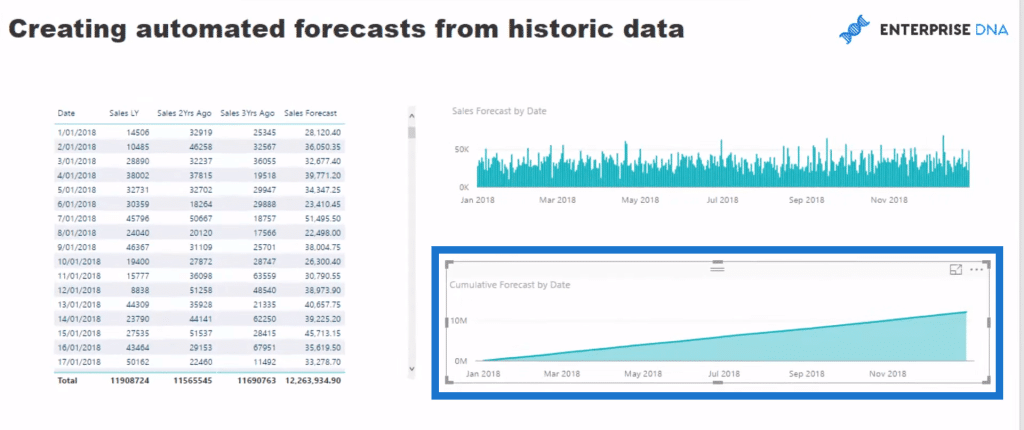
We can also put this inside a cumulative total pattern. So we go and create a new measure, and call it Cumulative Forecast. On the next line, we put in CALCULATE Sales Forecast. Then, go FILTER ALLSELECTED by Dates.
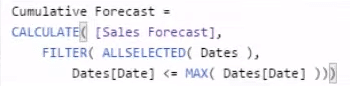
Once we have that, we put it down here and make it a cumulative total, and now we got a cumulative forecast that we could measure up cumulatively versus our actual results as soon as we got into 2018.
The coolest way about doing this is that it links up to the data model. So your forecasts can be filtered by anything in the data model because they derive from historical information that sits on a table within the data model.

With this, we can easily go and filter by Product Name here. We grab our Sales Forecast for the Product name and now we have forecast my products.
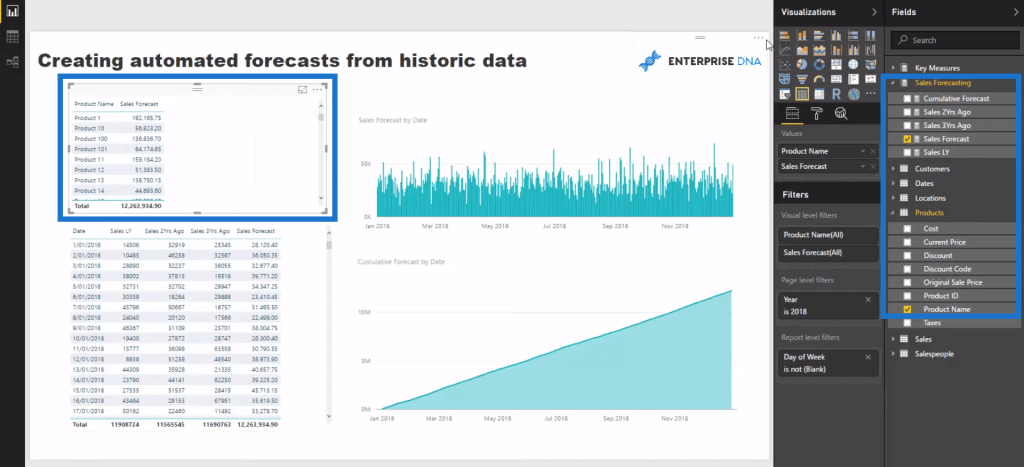
This also enables us to select a particular product, say Product 47. And as we change the filters here we can see how much we need to sell per day for this product, and/or see its cumulative result clearly.
***** Related Links *****
Forecasting Analysis Techniques In Power BI With DAX
Explore Forecasting Logic In Your Power BI Models Using DAX
Create Dynamic Cumulative Totals Using DAX In Power BI
Conclusion
In this tutorial, we’ve gone through a lot, such as time intelligence and cumulative total patterns to create a Power BI forecast.
I’ve seen this asked a number of times in comments and forums, and I just wanted to showcase how it’s relatively straightforward to create a forecast from historical information in Power BI.
I hope you find that you can benefit from this and implement this in your own environments. Find some way to utilize some of the techniques that we’ve gone through in this tutorial. Dive into the video below and try to use the techniques I showcased in your own development work.
All the best!
Sam


