
In this tutorial, I’m going to go through different approaches to how you can count distinct values in Excel from a more traditional way to a more modern technique. You can watch the full video of this tutorial at the bottom of this blog.
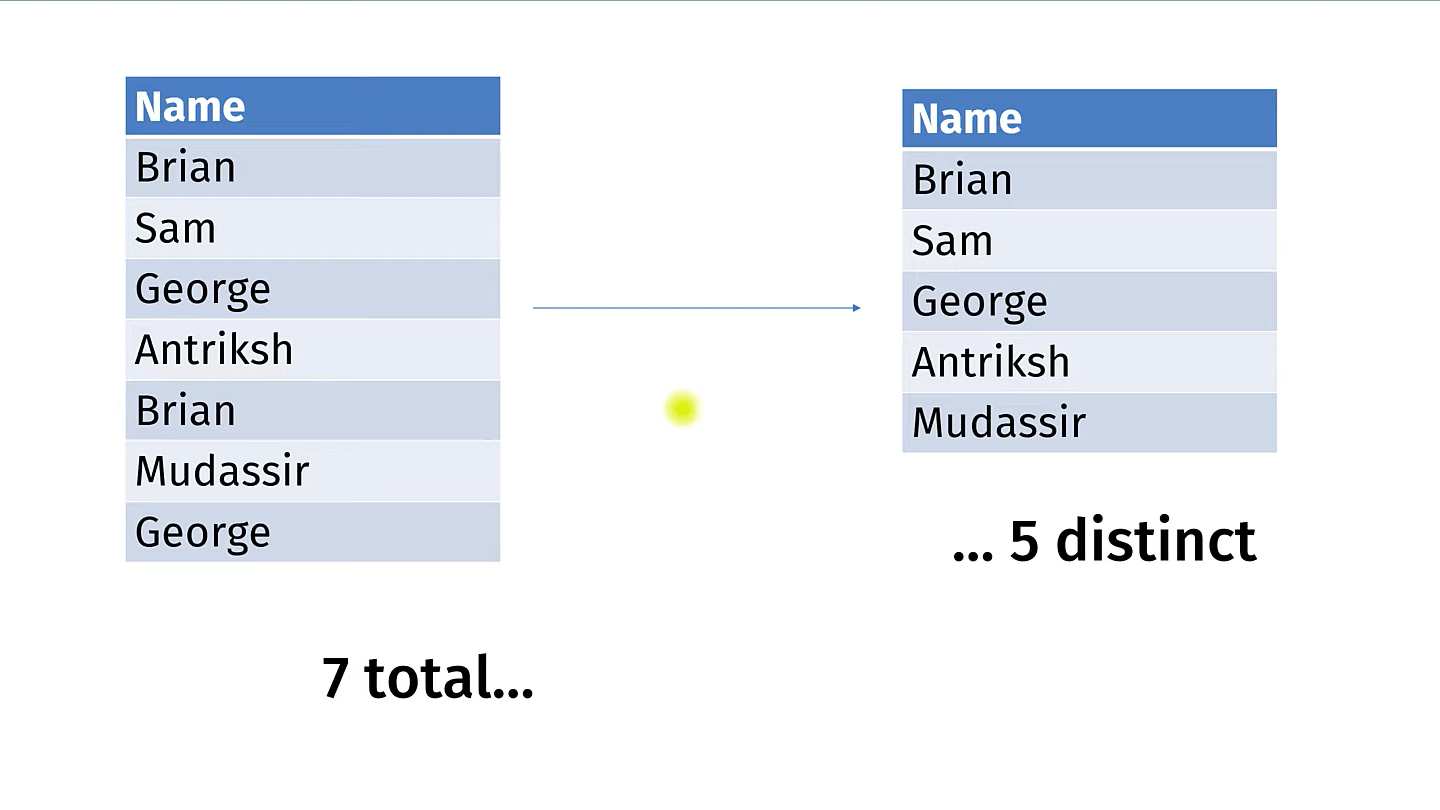
I’ve got a list of names here and I want to know how many unique names there are. There are seven names in total, but how many are not repeated? If I remove the duplicates, I get five.
I’m going to do this in Excel. There are a few ways to do this, and we’re going to look at this from the most classic to the most modern approach. We’ll start with Remove Duplicates, then we’ll do Count Distinct using the data model, and then we’re going to use Dynamic Arrays.

How To Count Distinct Values In Excel
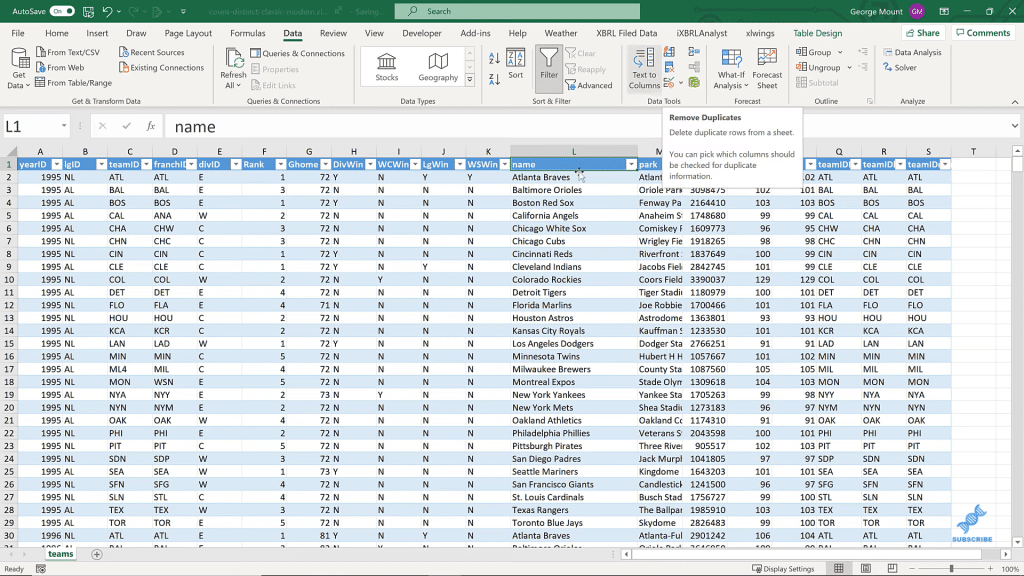
Here I have a data set of team records from major league baseball from 1995 through 2018. What I want to know is how many unique team names there are. We’ve got this Name column and I want to count these up.
So, we’re going to do three options. First is the most traditional way. I’ll go over to my Data tab and there’s an option to remove duplicates. That’s going to work, but I’m going to copy and paste the Name column to a new sheet because this is going to just ride over this data.
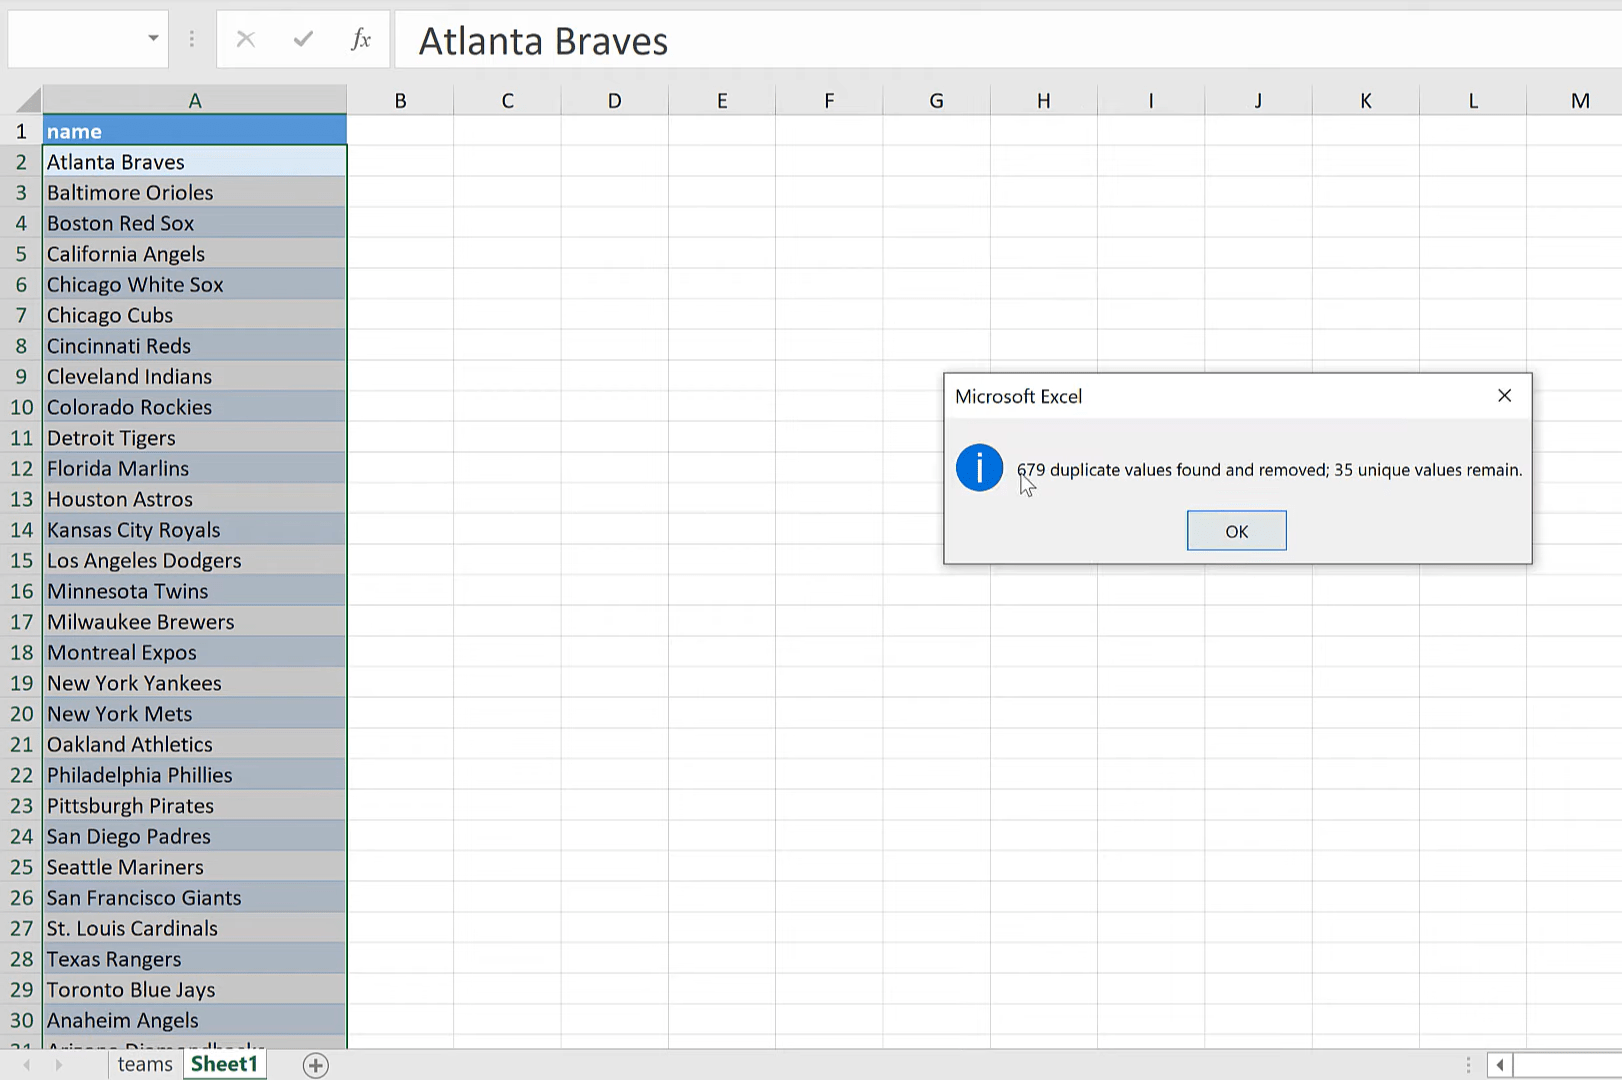
And now, if I remove duplicates, it will give us what remains, which is 35 unique values.
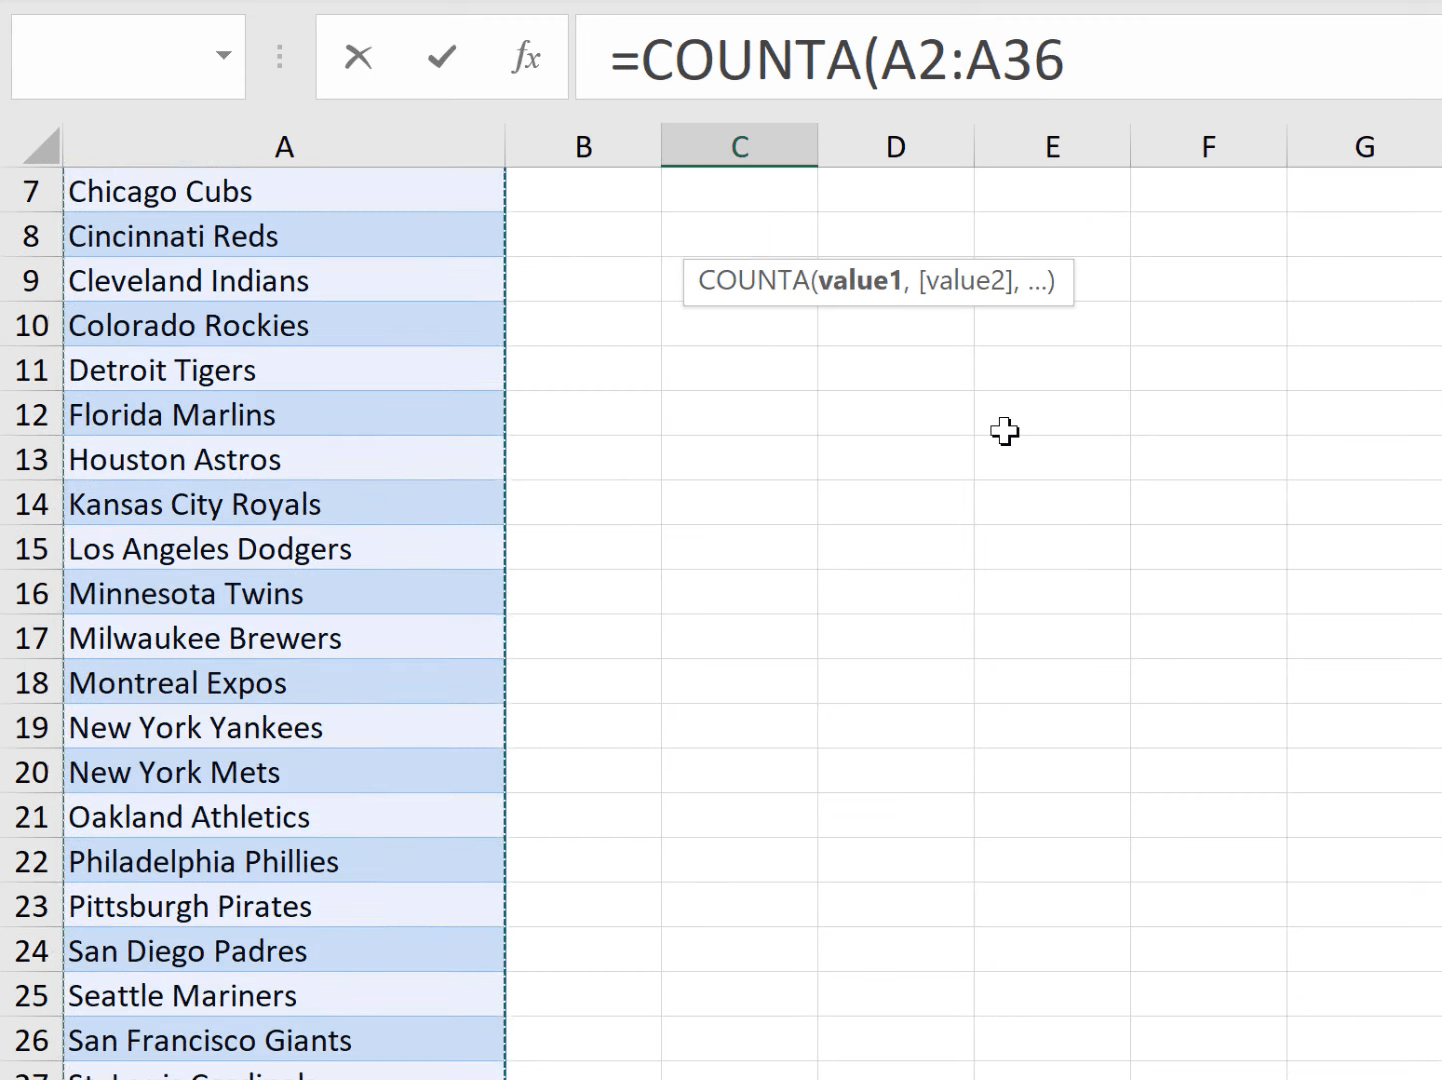
I could also do this COUNTA. I’m using COUNTA rather than just COUNT because COUNTA also picks up text values while COUNT only picks up number values. So, when we run that, we can see 35 unique team names.
So that’s a pretty easy option to use. We didn’t need to write any functions. It’s very low code, but the fact that we have to hard code messes up our original code. That’s not great for me. So, let’s try another option.
Now, this one is related to the Power pivot and the Data model. We’re going to create a pivot table report, and that’s going to let us count those unique values. So, let’s insert a pivot table. We have our Data table here, which is called Teams. We’ll create it in a new worksheet and add it to the Data model.

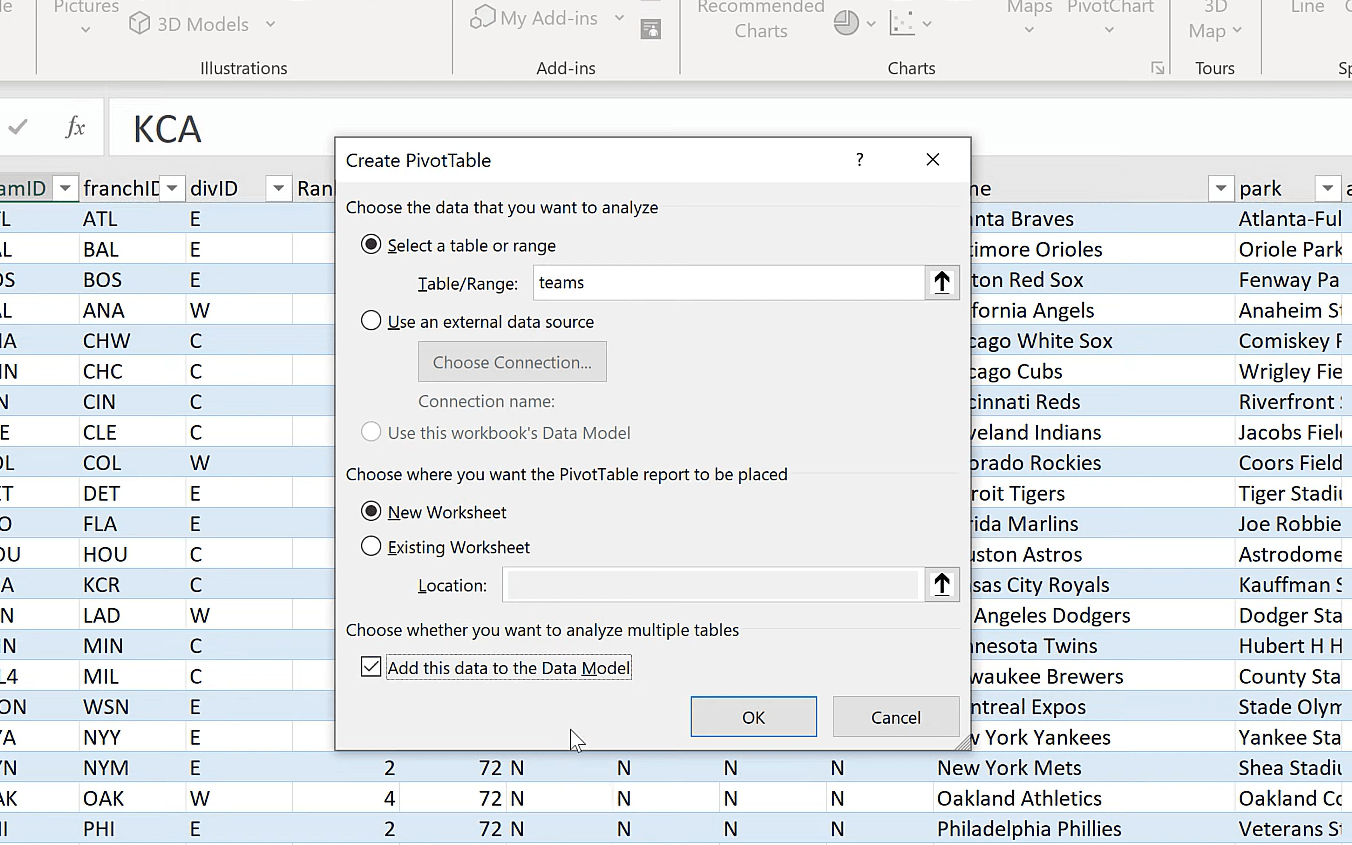
And if I click, OK, we’ll get what looks like a plain old pivot table. Now, I’m going to put the column, Name in my Value here.
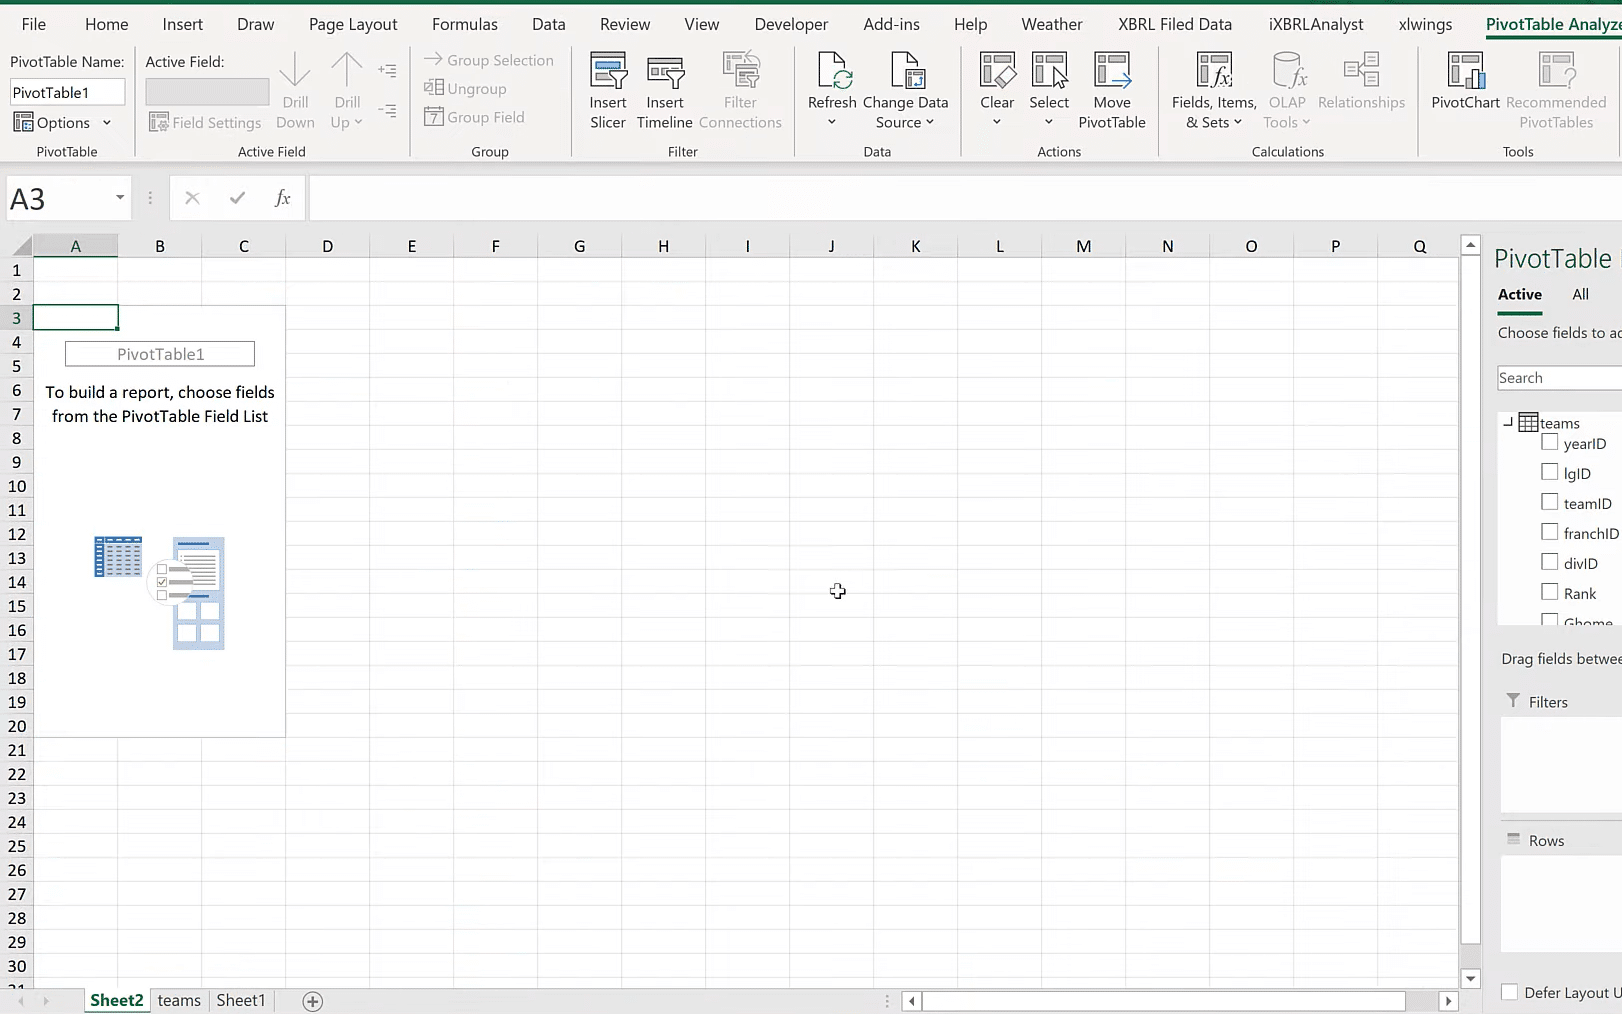
And then, I’m going to click on that Value field and summarize it. This is not available in the classic pivot table. This Distinct Count is only available in this Data model.
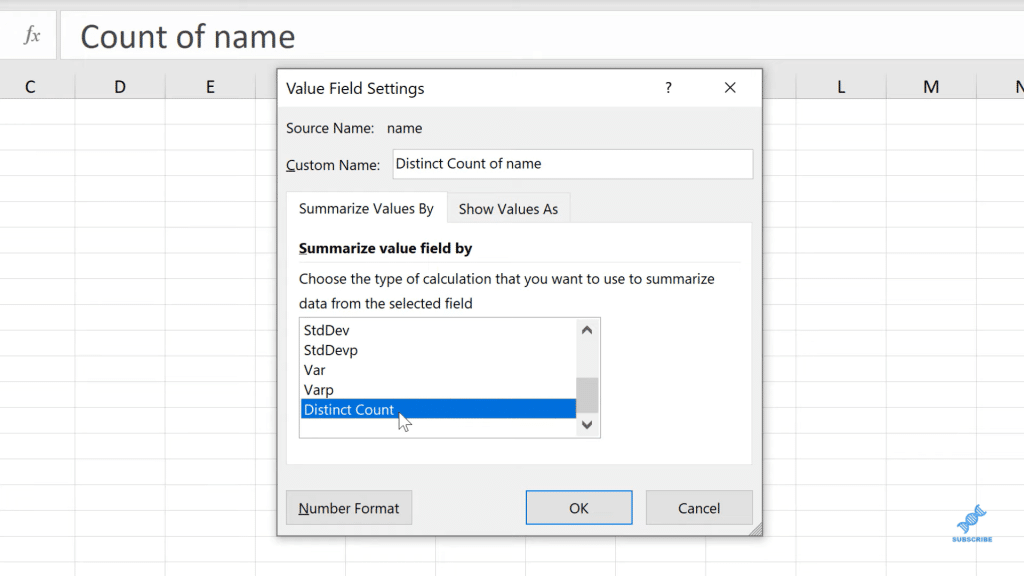
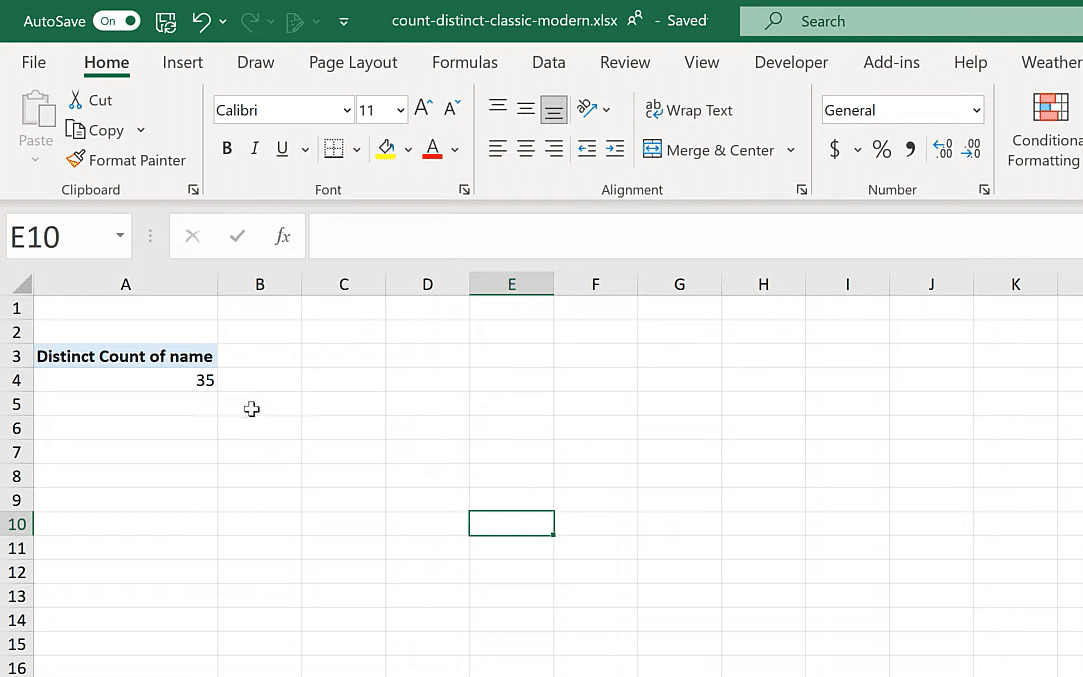
We’ll load this in and we get 35. So, there’s option B in Power pivot. This one’s been around for almost 10 years now. It’s not really well known, but it’s very powerful. And if you’re using Power BI, you’re probably familiar with the Data model, Dax, etc. The same basic infrastructure is being used here in Excel.
The final method that I want to show you is by using Dynamic arrays. These are pretty brand new, and you may not have them yet, depending on what version of Excel you use. This is only for 365.
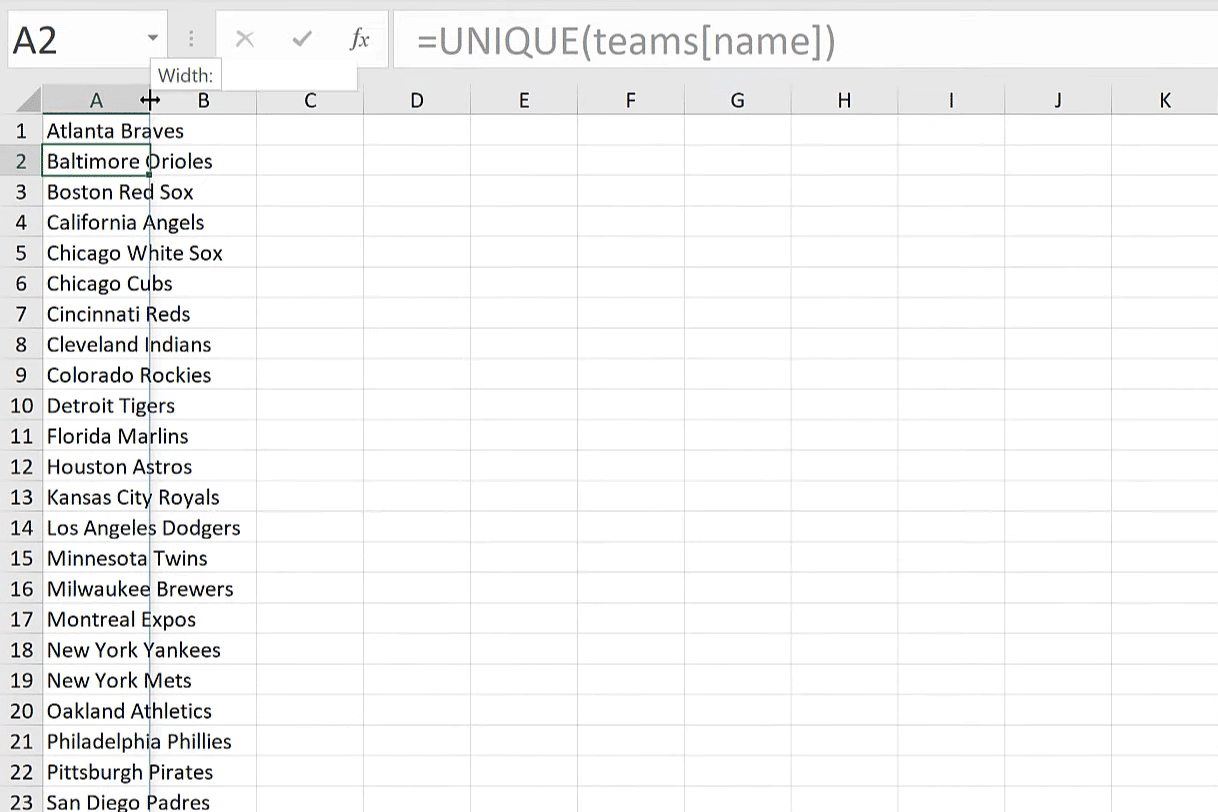
So, I’m going to use UNIQUE, which is going to return all the unique values in an array.
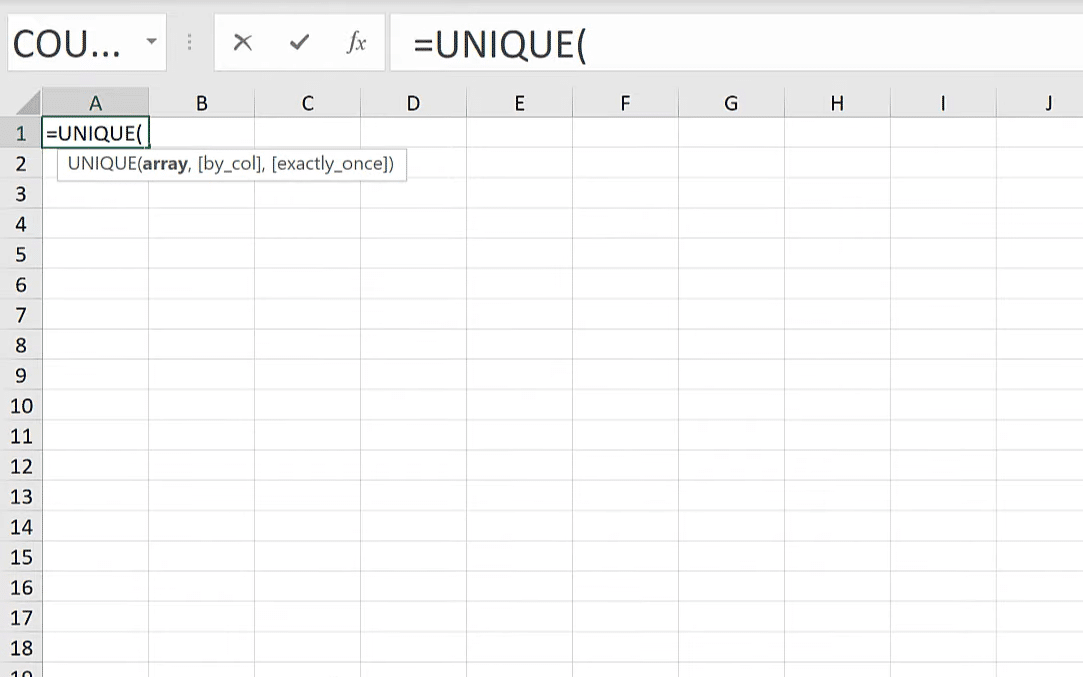
Then, I’m going to select the Name column, and this gives us a dynamic array. In this case, we’re using a formula. We didn’t have to manipulate the source data. We can see where the source data is.
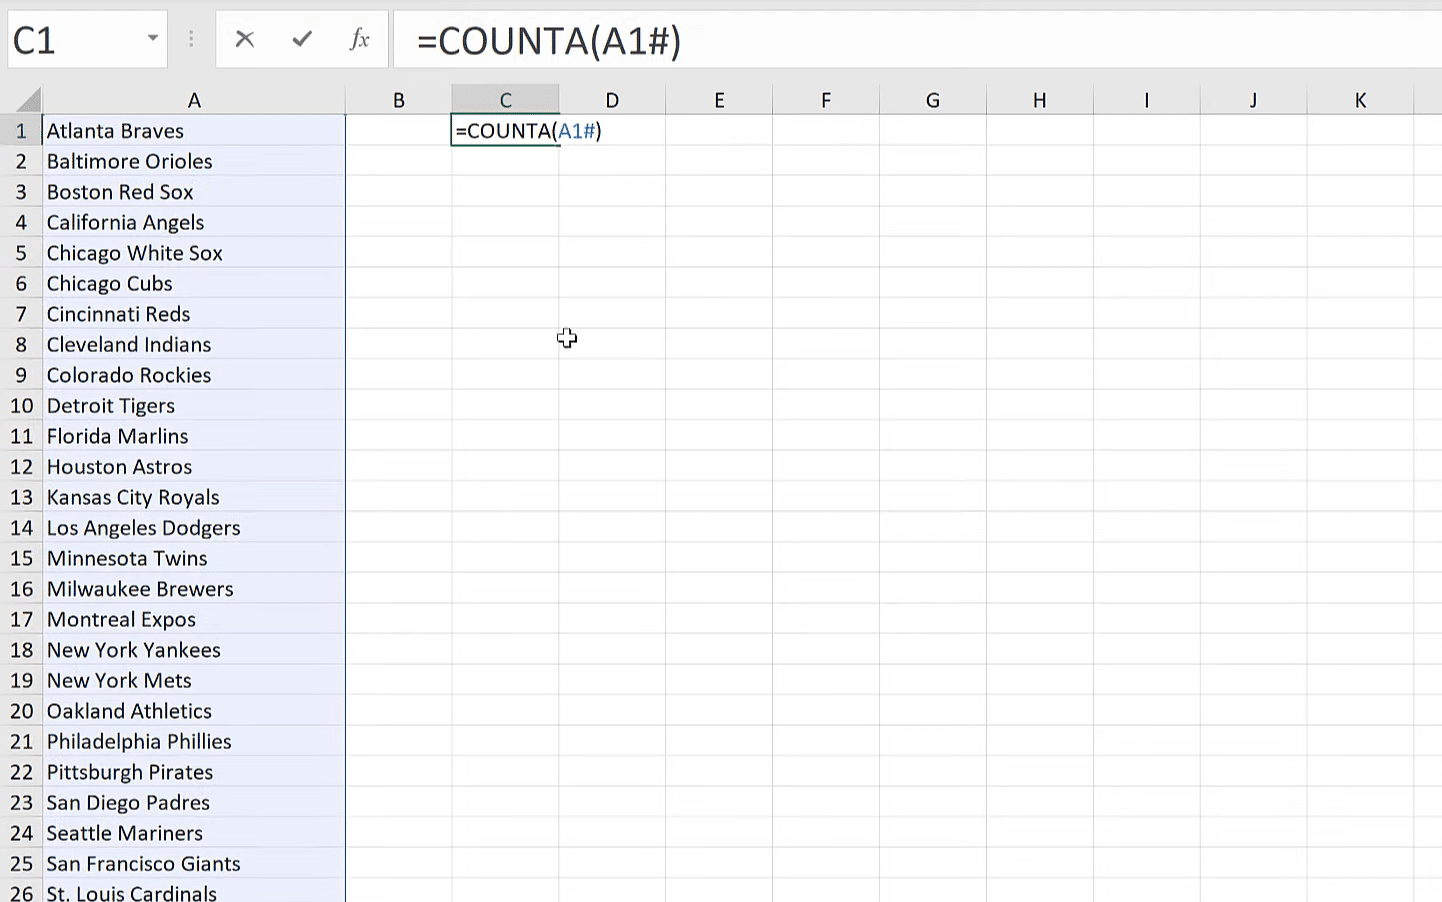
From here, I can do a COUNTA. Now, notice when I select this entire range, there’s this pound sign. This is the dynamic array spill operator. When I do this, it’s telling Excel that I want to operate on the dynamic array that’s associated with this cell; not the cell itself, per se, but the dynamic array started in that cell.
These dynamic arrays are really only a couple of years old and generally released more in a matter of months to most users. This is a new way of doing it.
***** Related Links *****
Counting Customers Over Time Using DISTINCTCOUNT In Power BI
Power BI Analysis Using DAX: How Many Unique Products A Customer Bought
Proportion And Frequency Tables In Excel
Conclusion
I’ve shown you three different ways to count distinct values in Excel. We started with the classic Remove Duplicates approach. We just have to use the menu. There are no functions involved, however, it doesn’t make me comfortable that we have to copy and paste. There’s not a lot of integrity when we do it.
Then we get to the data model, which is pretty cool. This is also menu-driven, with no formulas, and it’s dynamic. Not everybody may know about this though, and we do have to refresh the data if we wanted to get updates. We use Pivot tables or the Pivot Table Report, as it’s called now with Power Pivot.
And then, we got to the very modern method, which uses the unique function, Dynamic Arrays. This is formula-driven, which may be a pro or con, depending on who you ask. The big downside of this one is that it’s a little verbose. We are using two functions. Also, the fact that it’s not as common to have this function available.
If you have other ways of doing this, let us know. We would love to see them. There are always different ways to do things in Excel.
All the best!
George


