
In this tutorial, I go through an average results analysis technique. I dive into some types of procurement & purchasing analysis that you can do with Power BI. You may watch the full video of this tutorial at the bottom of this blog.
Specifically, we’re going to look at the average monthly purchases a business may make.
I go through which DAX formula combination you need to be able to calculate averages in a monthly context. I also show you how you can combine these formulas or functions with the data model. By doing this effectively, you can quickly extract information across a range of different dimensions.
Whether you want to analyze your monthly purchases by division, region or according to each manager, all of this is possible with Power BI in an effective and efficient way.
You don’t need to write different formulas to do it.

What you can do is leverage the data model that you’ve built for a procurement type scenario. You can bring in different elements or different dimensions from these various tables that you have in your data model and overlay them with the formulas that you have created.
Additionally, you can branch out even further from that. For instance, you can analyze the difference in purchasing over time for any of these different dimensions in your data. You can include many time comparisons and time intelligence type techniques in the analysis as well.
So in this example, we look at things on an average basis. Instead of looking at every individual purchase, we want to see how the average purchases in our departments are going. I’ll show you how you can use a combination of techniques to actually work this out using Power BI.
Working Out Average Monthly Purchases
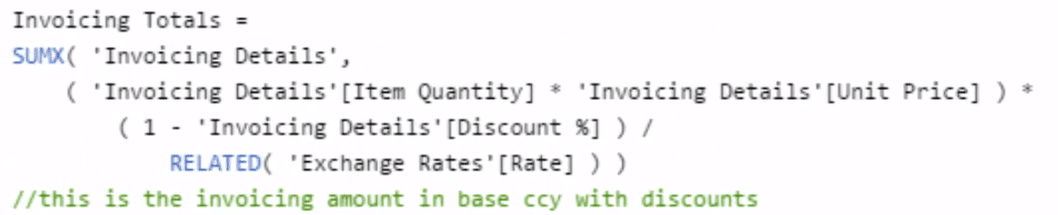
First of all, I’ve created a measure to get the total amount of invoicing that we’re doing. Here’s the formula:
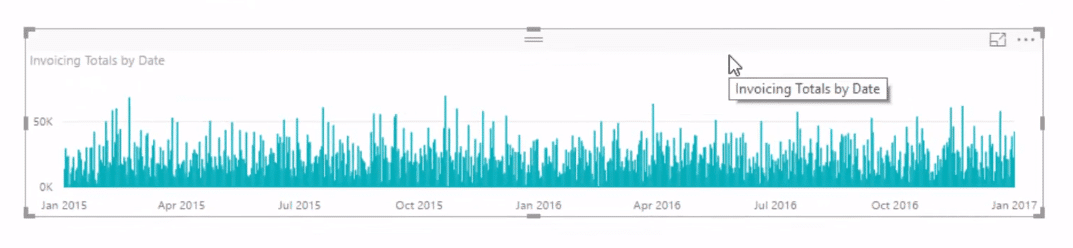
So now we work out averages through time. We’ll look through time and see what time frame we are making purchases. In this case, we have all the way from January 2015 to January 2017.
We simply drag our Date table into our axis and we can see our Invoicing Totals by Date.

Now we want to work out how much we are invoicing per month on a department basis. To see that insight, we grab the Invoicing Totals then drag in our Department into the axis.
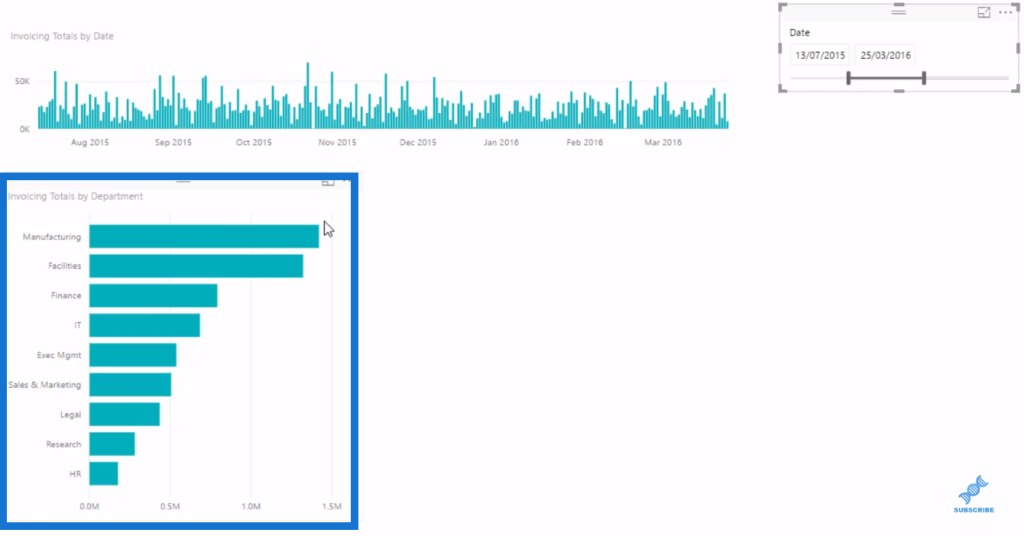
It’s also easy to overlay a slicer from our Date table, where we can easily change it and look at certain time frames, which will impact both the context and the results.
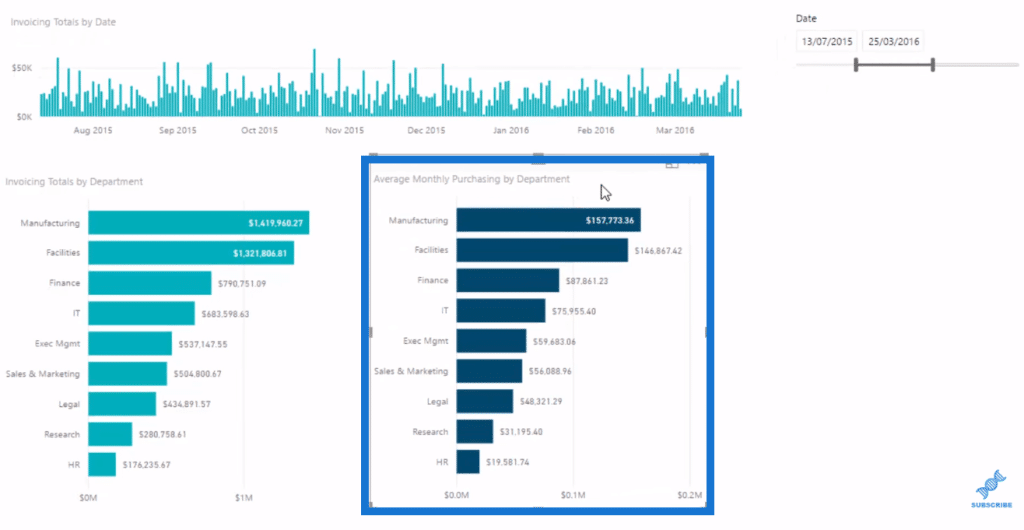
But say for instance, within this date context, we want to see on average in the months here, how much we are actually spending per department. To do this, it just takes an understanding of how to use the AVERAGEX function and what virtual table we want to place inside that function.
So we go create a new measure and call it Average Monthly Purchases. We’ll use AVERAGEX, then inside we put a virtual table of every single month. We’ll find our Month and Year dimension inside our Date table and that is going to do the iterating for us.
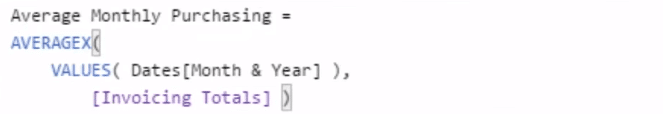
AVERAGEX is an iterating function and so we need to give it a table to iterate through. In this case, we’re giving it a virtual table of every month and year. And that’s what’s going to create the average because it’s only going to calculate the amount of months in years inside this context.
Then, we add our invoicing measure and we’ll see that now we have an average. We format it and change the color to make it stand out.
Comparing Average Purchasing Over A Time Period
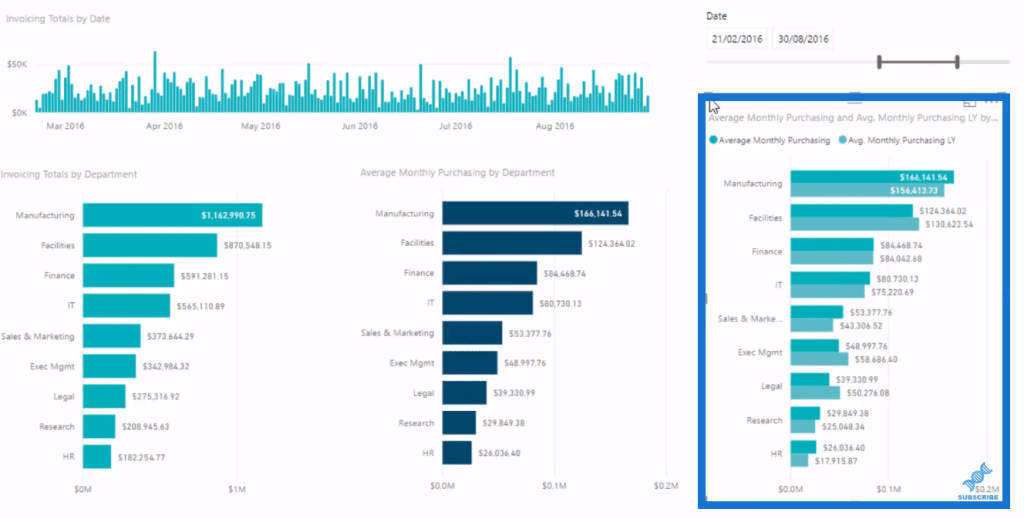
It’s good to see the average purchasing, but it would also be a great thing to see and to compare average purchasing over a previous time.
To do this, we simply just expand on what we have here. We start from our simple measures, and then branch out to more DAX techniques to get more insights.
We’ll call our formula Average Monthly Purchases LY and we’ll use the CALCULATE function of our Average Monthly Purchases. We’ll have DATEADD and DATES, and the number of intervals is -1 – then we go YEAR.

Based on this context, we can now compare our Average Monthly Purchases over the time frame we have selected versus exactly that same time frame from the previous year.
***** Related Links *****
Understanding How The AVERAGEX Function Works
DAX Calculations: Total Of Average Results
Analyse Procurement Purchasing Decisions In Power BI Using DAX
Conclusion
I have run through all of the steps indicated above in this tutorial. If you can relate to this scenario, I’m very confident you will learn a lot about how Power BI can be used to optimize decisions around these sorts of purchasing scenarios.
And what’s great about this in Power BI is that once you learn the technique, you can easily apply it to many different data scenarios.
Time comparisons don’t change no matter what data scenario you’re working on and very quickly you can get some pretty cool insights. You can even branch out if you want to go further with your Power BI average analysis.
All the best!

Sam


