In this post, I run through how to use SAMEPERIODLASTYEAR, a time intelligence function, to compare results from this year with those of last year. You may watch the full video of this tutorial at the bottom of this blog.
If you want to start creating compelling reports with strong insights into information over time, then you’ve got to know how to use all the variations of time intelligence functions.
Some are easy, but others are much more advanced and can be difficult to use. In this post though, I want to take you back to where to start.
It’s important to get a really good base understanding of how these functions work, especially how they work with the CALCULATE function. Combining these two types of function is where the real power comes from.
It’s also very common to want to compare data or your results over two time frames, so I want to show you how this is done.
How To Use SAMEPERIODLASTYEAR?
Calculating and comparing the difference between the current year data and the previous year’s is really easy. You need to follow only three simple steps using DAX to achieve this in Power BI. Let’s dive right into the first step.
Step 1
The first thing that we need to do is to work on our initial measure. For this particular example, we’re going to look at our total sales.
Going back to our fact table, we can see that we have a total revenue column.
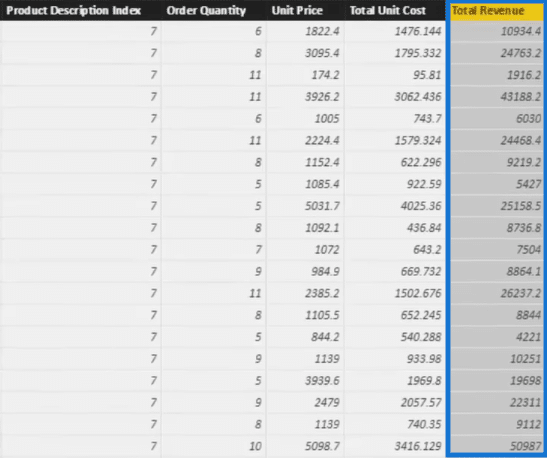
We’re going to create a total sales measure summing up the data in our total revenue column. This is how our formula will look like.

After dragging the total sales into the canvas, it will show the total of all the sales.
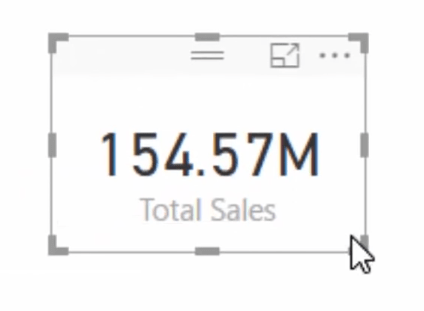
To review the total sales by date, we need to add a date column into the table that we have created.

Step 2
Now that we have a total sales table that shows the daily sales, we can already calculate and compare current year sales and the sales in the previous year.
The next step that we need to do now is to create a new measure. This is where the time intelligence function, SAMEPERIODLASTYEAR, comes in.
Let’s call this measure Total Sales LY or Total Sales Last Year. We’re going to use SAMEPERIODLASTYEAR inside of CALCULATE.
Below is the formula for our new measure.

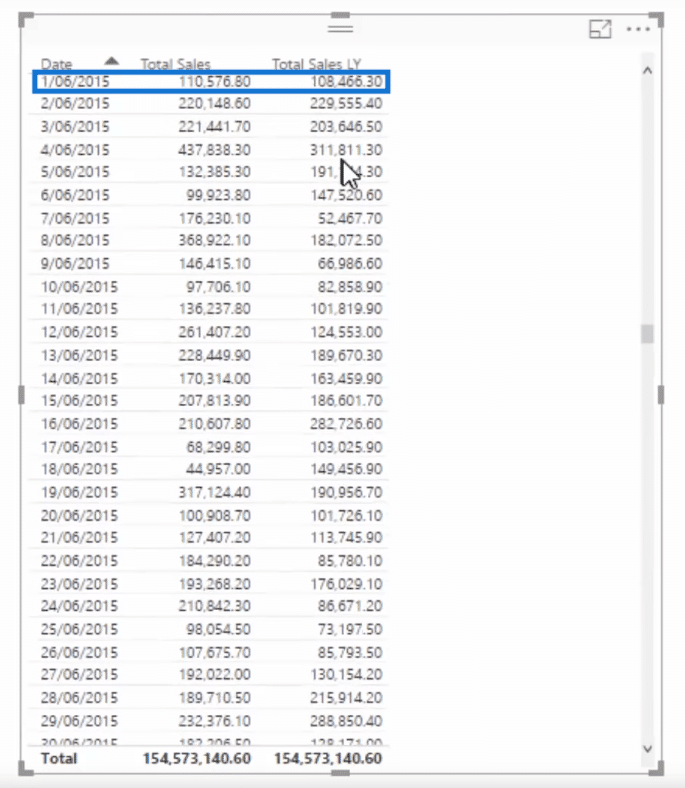
If we drag Total Sales LY into our table, the previous year’s sales will then be included.
If we look at the 1st of June 2015, for example, the total sales is 110,576.80 while the total sales the previous year is 108,466.30. You can check if this figure is correct by looking at the 1st of June 2014 data.
Step 3
The last step in our process is to calculate the difference between sales this year and our sales last year. We’re going to create another measure for this. Let’s call it Diff. Between TY and LY or difference between this year and last year.
Since we already have the other measures that we need, all we have to do is to subtract total sales last year from the total sales.

This is how our table will look like after including the new measure. You’ll notice that in the first half of the table, the last column is repeating the data in the total sales column. And then we get the correct results from the first of June 2015 onward.
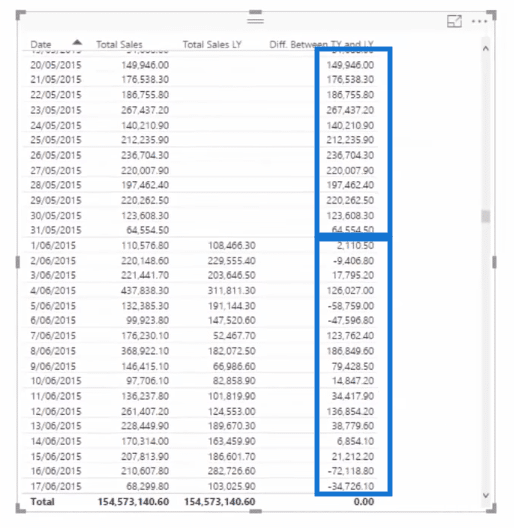
We therefore need to add some logic here so that our new formula will become like this one below.

Now that we got that fixed, you’ll notice now that there’s no result in the upper part of the table but we still get the correct results starting from the first of June 2015.
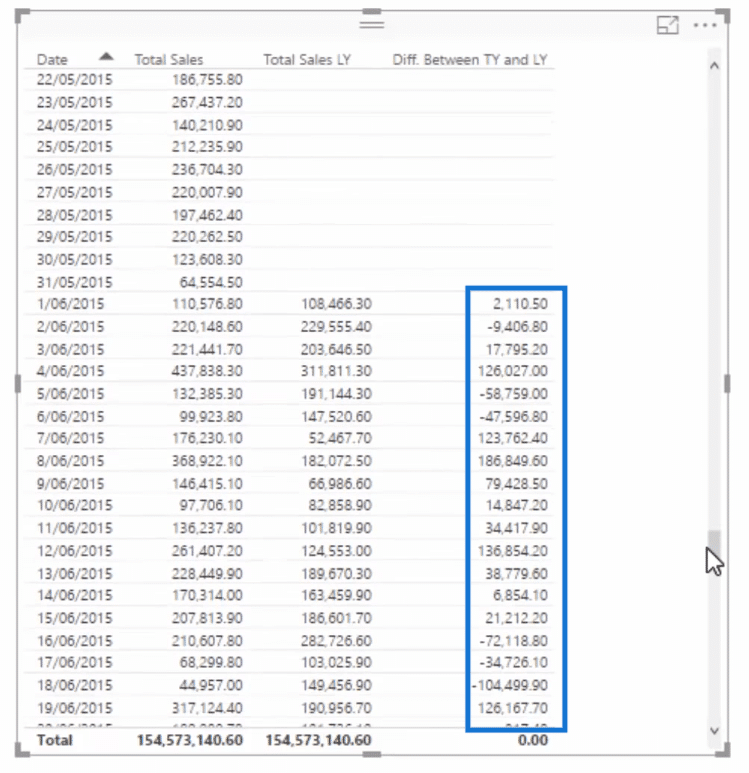
After calculating the difference between the sales this year and the sales last year, we can now create our visualizations.
Turning Your Calculation Into A Visualization
We can turn our calculation into a visualization just like any other calculation.
Our visualization can be filtered by any time frame, but in this case, let’s look at 2016.
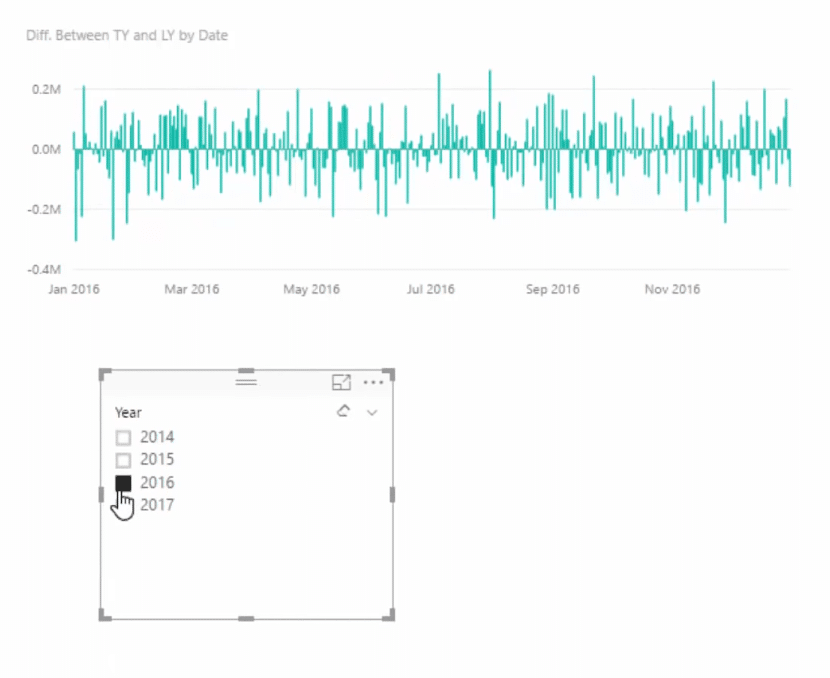
You’ll notice that our visualization above shows the daily perspective.
If we also want to look at the monthly perspective, we can do so very easily. All we need to do is to just copy and paste the same visual, grab the MonthInCalendar, and then our second visualization will look like this one below.
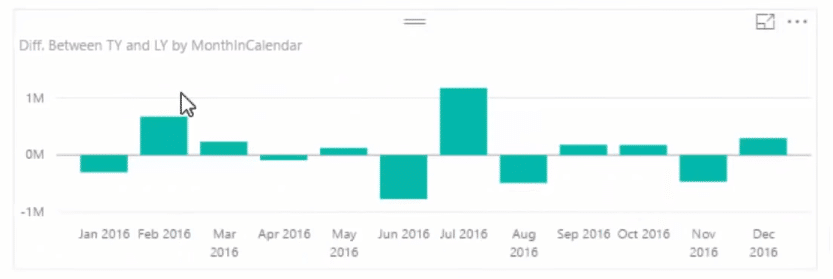
Keep in mind that we are still using the same calculation and we’re just looking at different perspectives. So it’s really very easy to do this in Power BI.
Branching Out Into More Advanced Calculations
You can also branch out into more advanced calculations once you’ve completed the first steps.
The insights are practically limitless – you can calculate things like the difference between time periods, the percentage change from last year, the best and worst performers… the list goes on.
You can start finding valuable insights very quickly that historically are very difficult to achieve with tools like Excel. You certainly could do it, but your formulas would have been far, far more complex than within Power BI.
***** Related Links*****
Calculating Percent Profit Margins Using DAX in Power BI
Calculate Financial Year To Date (FYTD) Sales In Power BI using DAX
Calculate Consecutive Weekday & Weekend Days In Power BI Using DAX
Conclusion
In summary, looking at data or information over time in Power BI is really easy because of the different time intelligence functions available. Understanding how they work, especially together with CALCULATE, is really important since this will enable us to create compelling reports.
To calculate the difference between the sales this year versus last year, we used the SAMEPERIODLASTYEAR function and followed three very simple steps:
- Creating the Total Sales measure
- Creating the Total Sales Last Year measure
- Calculating the difference between the two measures
Turning our calculation into visualizations is also easy and Power BI allows us to present them at different perspectives.
Thanks for checking this post.
Cheers,
Sam


