In this blog, I’ll be discussing some more advanced DAX functions to demonstrate what’s possible in Power BI. You may watch the full video of this tutorial at the bottom of this blog.
This tutorial will teach you how to visualize the profit contribution of different client tiers using advanced DAX functions.
Calculating Total Profits
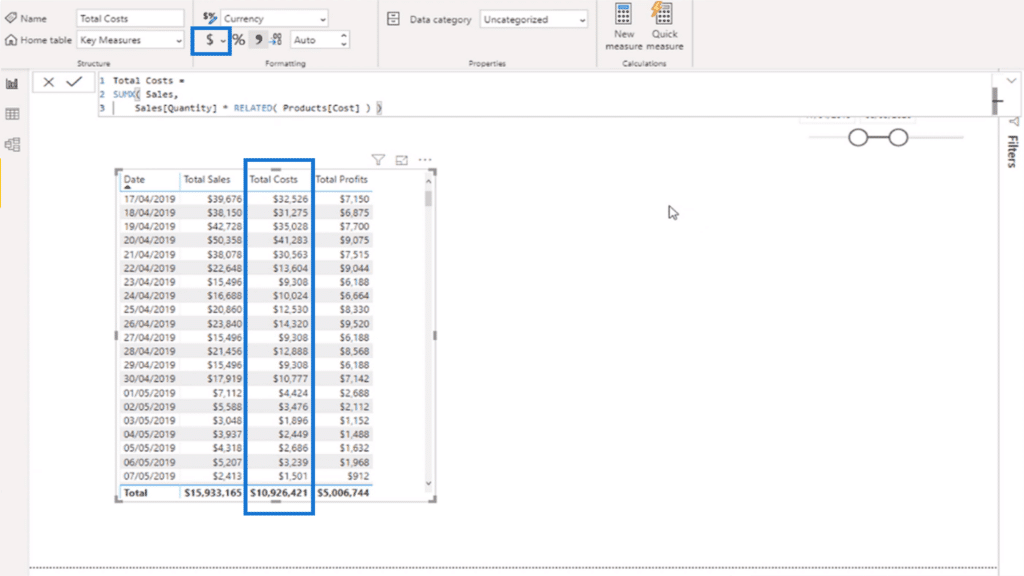
I’m going to start by creating a new measure and renaming it as Total Costs.
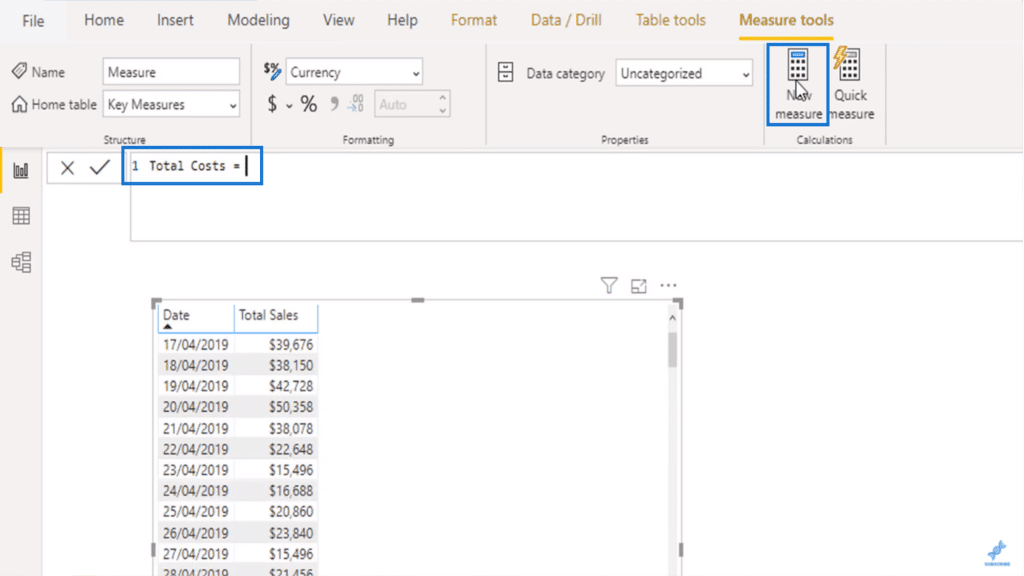
To get the cost, you need to use the SUMX function, which returns the sum of an expression evaluated for each row in a table.
Add the Sales table and multiply each sales quantity to the corresponding product cost.
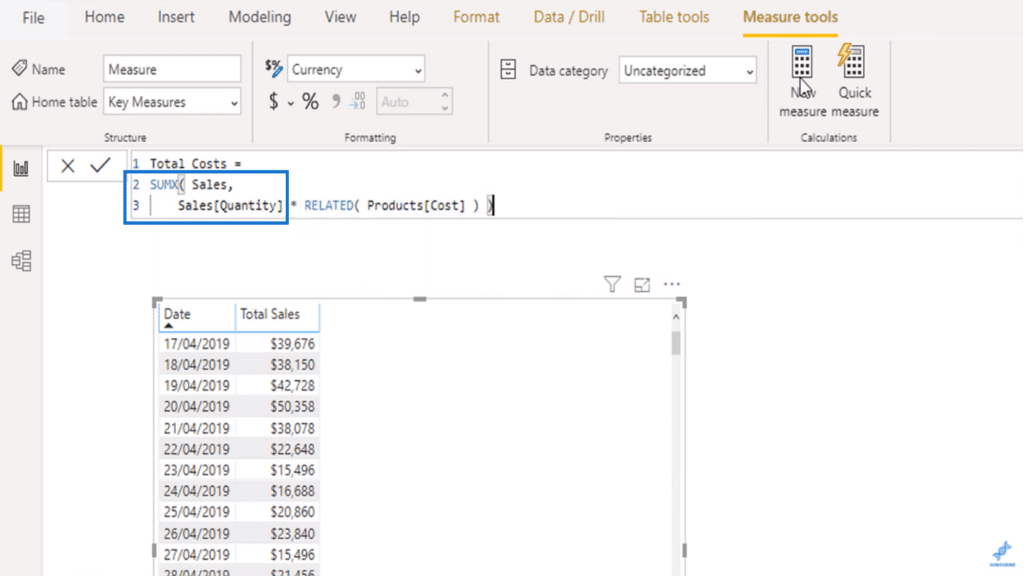
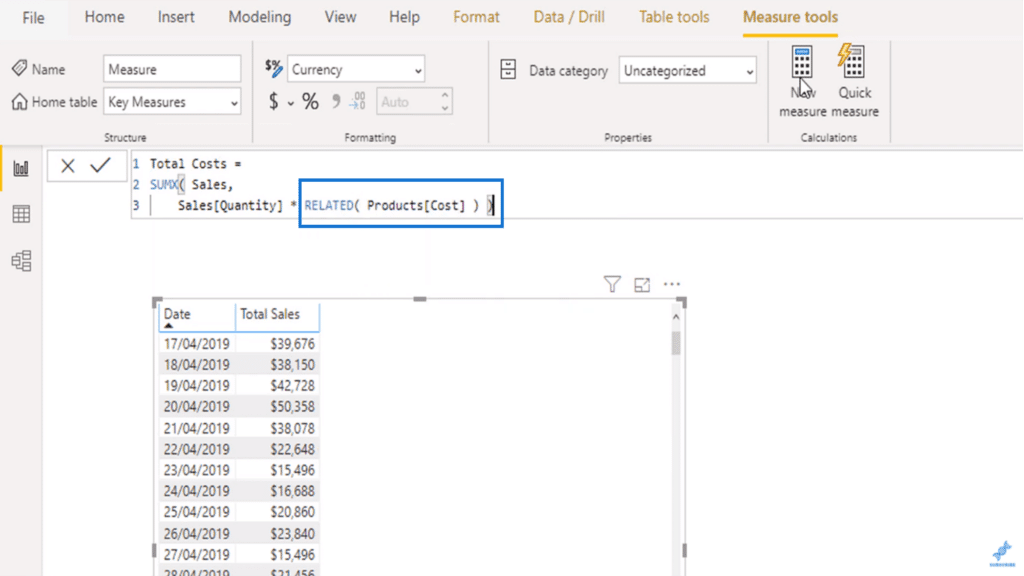
You will need to use the RELATED function to call on another table, particularly the Products Cost table, to achieve this.
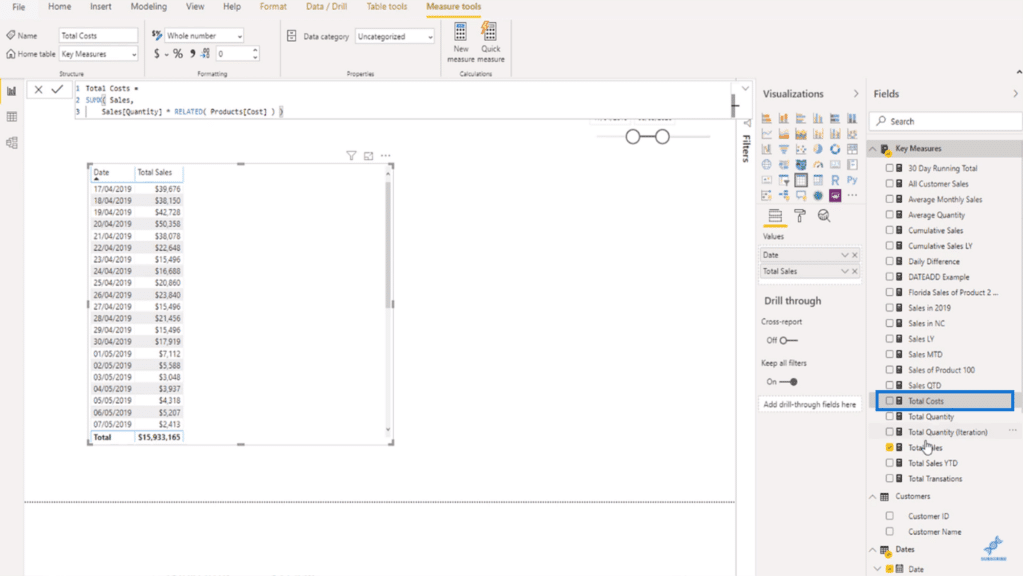
Hit enter and wait for the calculation to appear on your Key Measures.
From here, you can branch out easily to Total Profits. Create a new measure and subtract Total Costs from Total Sales.
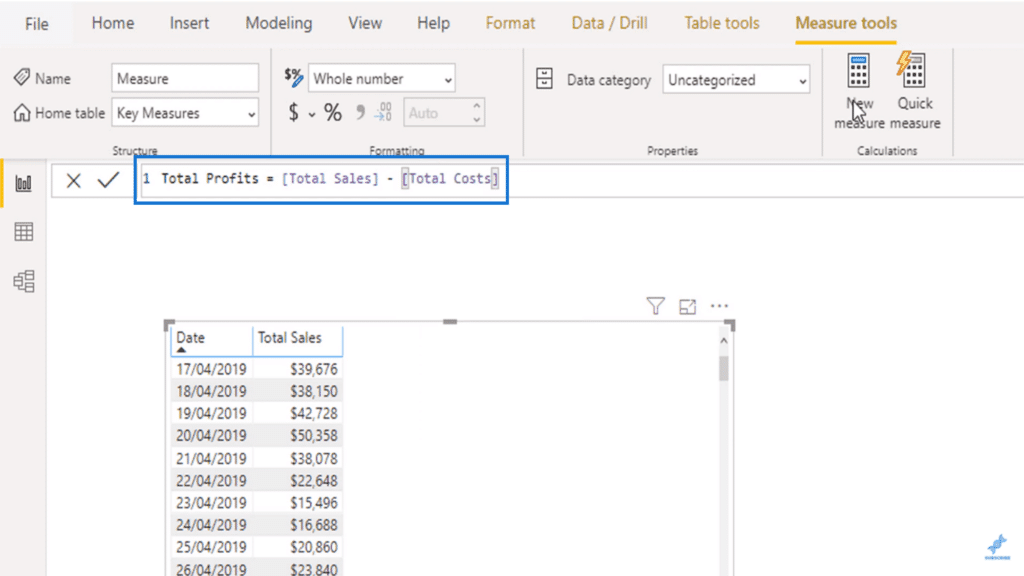
As you may have noticed, you don’t have to reference anything in the table anymore.
This is the beauty of measure branching: you can reference measures within measures rather than having to rewrite advanced formulas repeatedly.
This methodology is a far more effective way to do complex calculations and it will save you a lot of time.
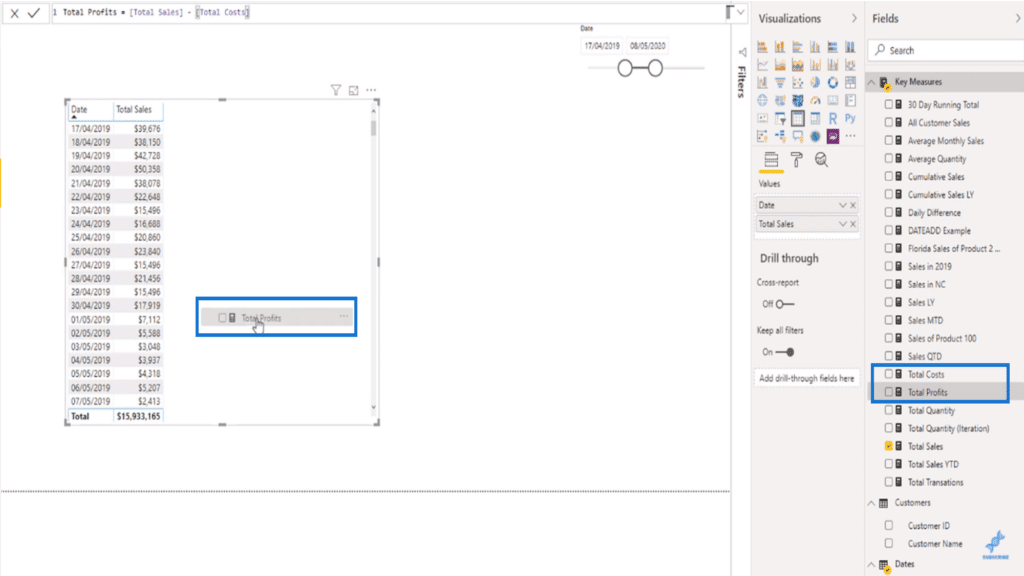
Now I’m going to drag the measures for Total Costs and Total Profits into my table.
I also like to fix the format right away just so my data is organized.
Select ‘Currency’ in the format drop down menu or click the currency symbol.
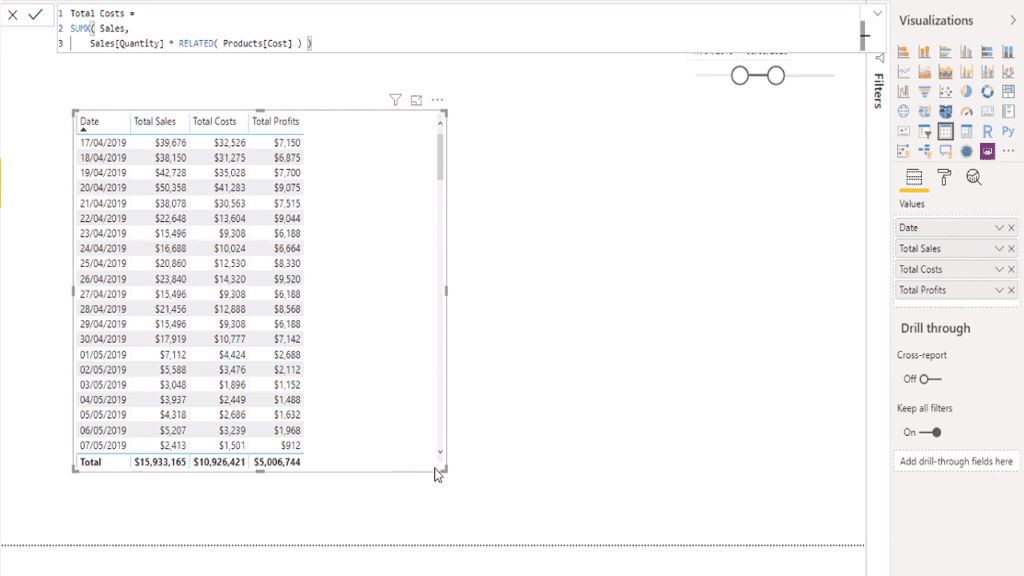
You now have Total Sales, Total Costs, and Total Profits. The next step is to identify who in this time selection are the top clients, the mid-ranged customers, and the rest.
Creating A Supporting Table
After setting up my basic measures, I’m going to create a supporting table.
This will enable me to create dynamic groupings based on custom logic.
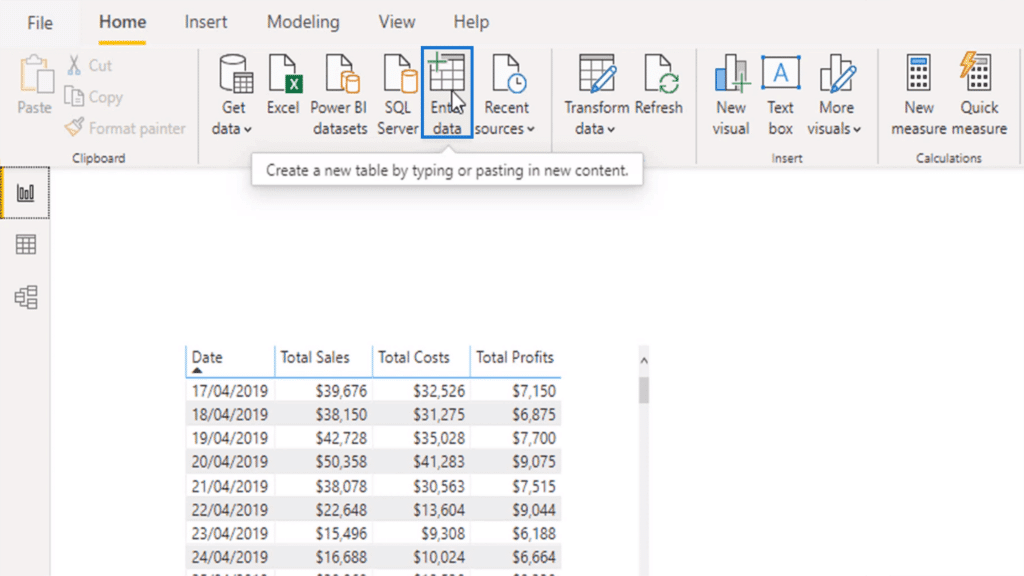
Click ‘Enter data’ to add a new table.
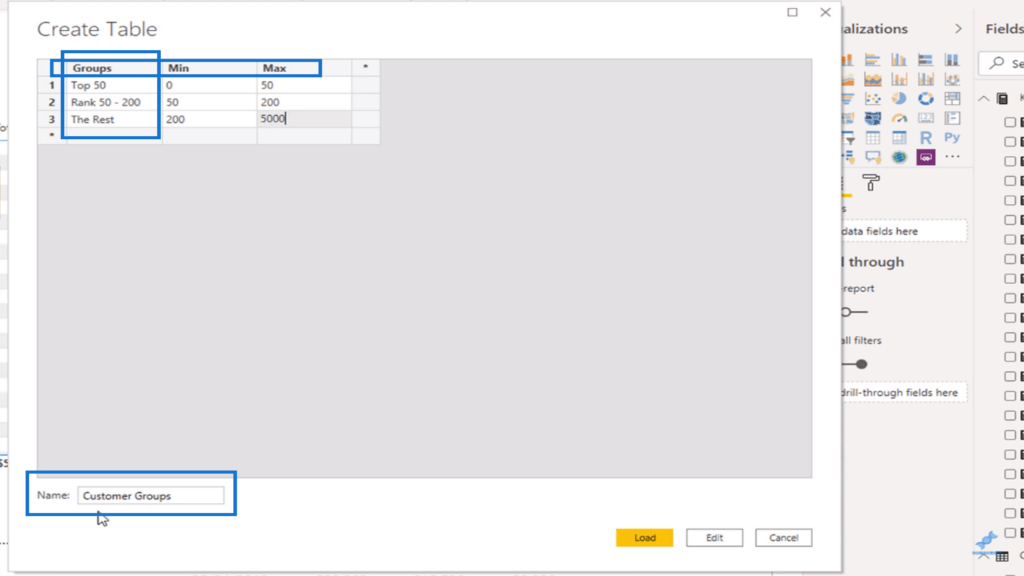
Name the supporting table “Customer Groups” and add columns ‘Group’, ‘Min’, and ‘Max’.
Afterward, group the clients if they belong to the Top 50, Rank 50-200, and The Rest. Indicate the minimum and maximum ranks of each group as shown below.
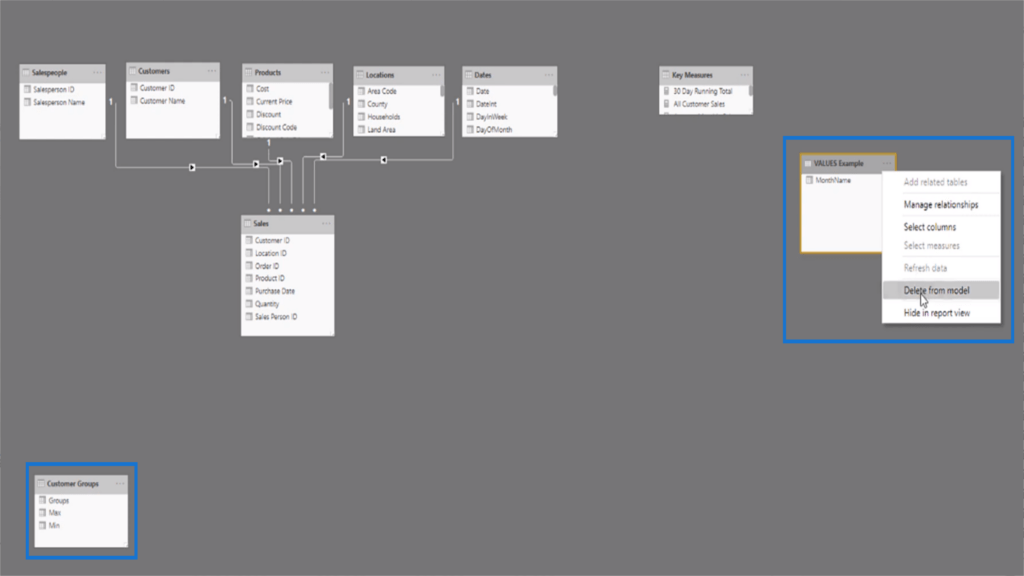
Whenever you create a new table in Power BI, it’s best to check and organize your data model so you have an overview of how everything is connected.
In this example, I deleted irrelevant measures and dragged my supporting table to the bottom.
As you can see, it has no relationship with my core data model. The goal is to run logic through this table based on the ranking of my customers. This step will require advanced DAX functions in Power BI.
Using Advanced DAX Functions
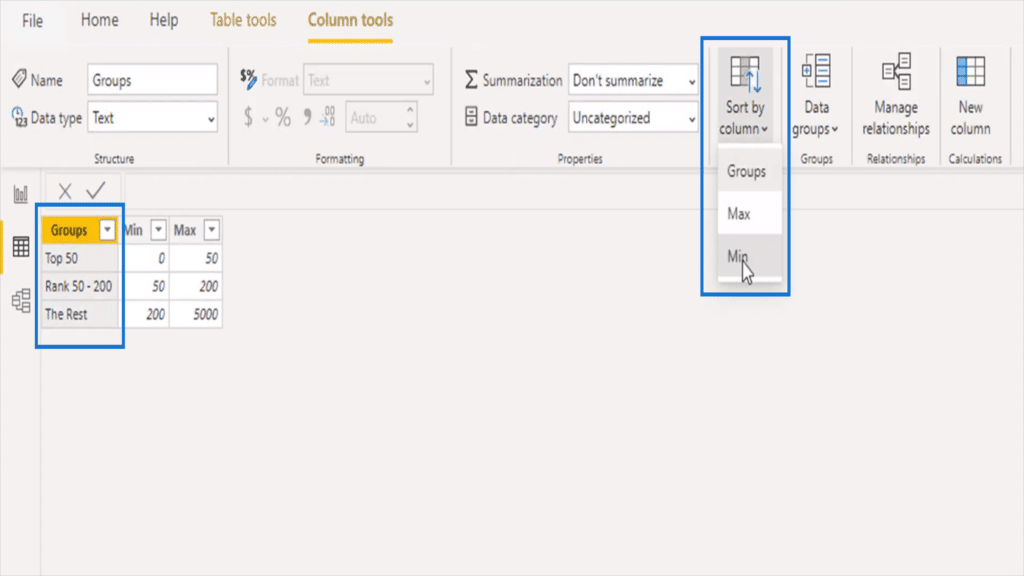
To start, I’m going to sort my supporting table.
Go to the column tools of the Customer Groups table and sort the Groups column according to the minimum ranking. I like to do this because the data will make more sense later on.
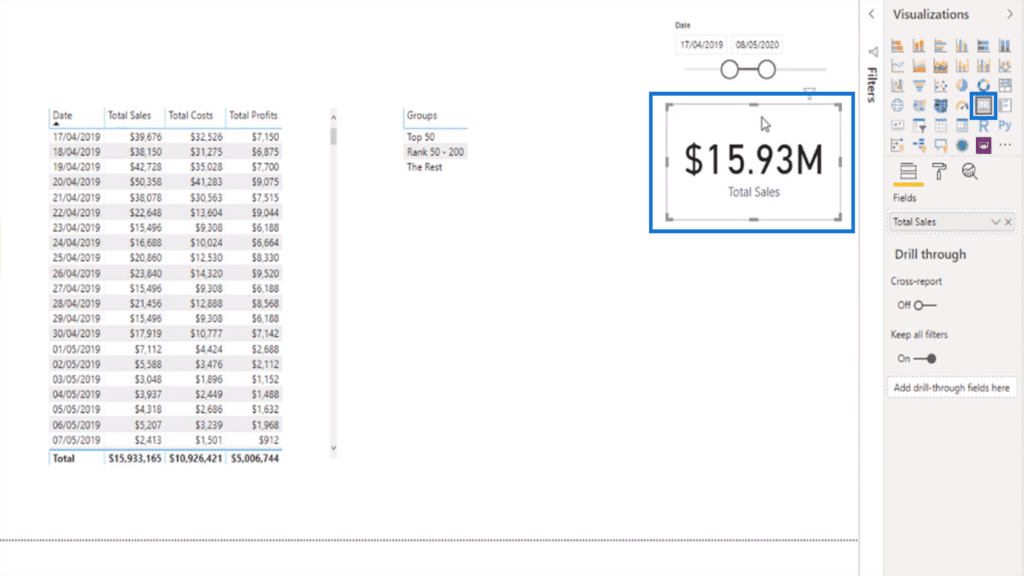
Before proceeding, I’m going to make some visualizations. I went ahead and transformed my Total Sales into a card.
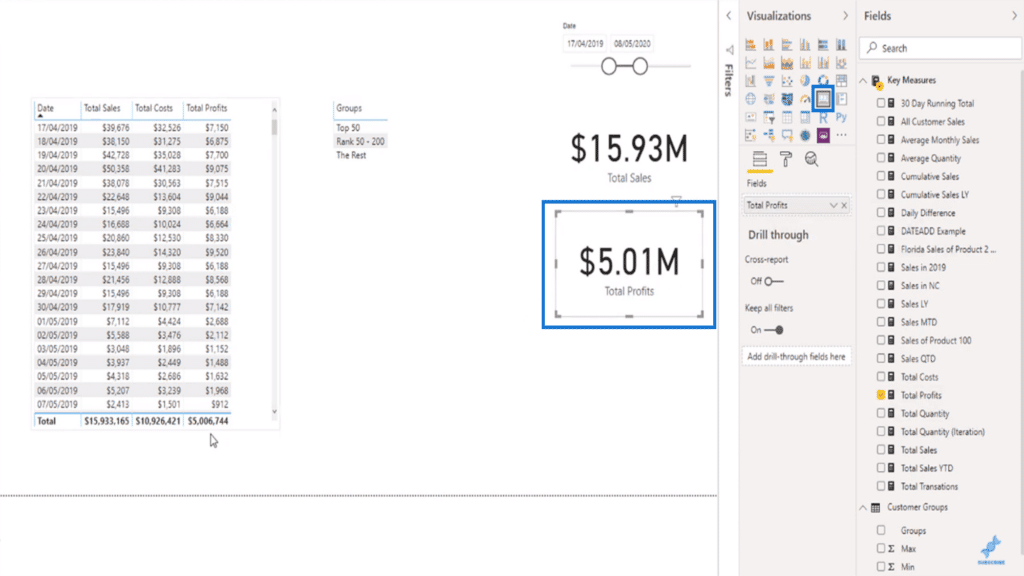
Then I did the same for Total Profits.
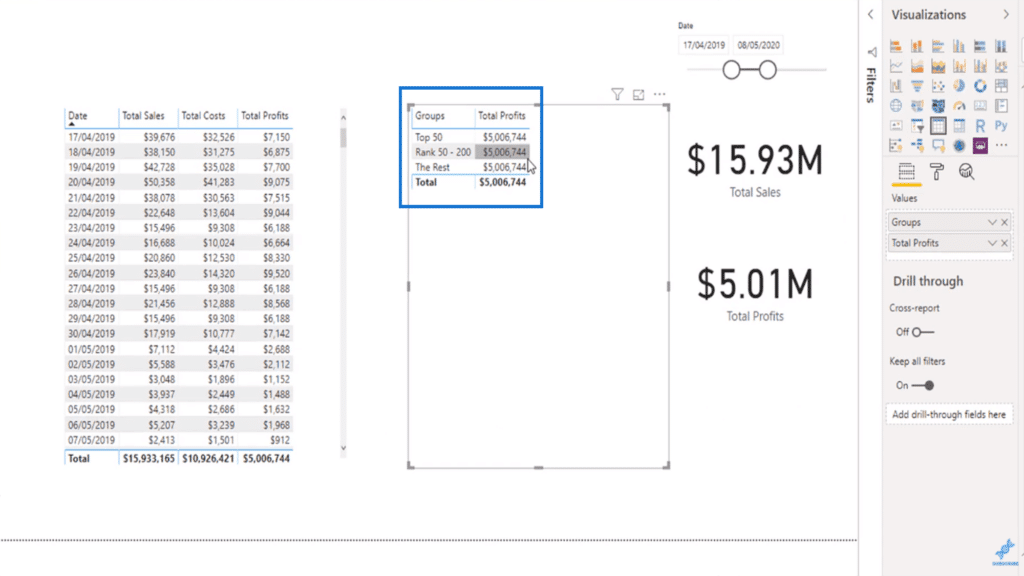
With all that set up, I’m going to bring in my Total Profits measure inside the Customer Groups table.
Since there is no relationship between the two, you’ll see that the Total Profits of $5.01 million goes across every single customer group.
To fix this, I’m going to create a new measure and write an advanced formula. While it is complicated, using advanced DAX functions in Power BI will make this achievable.
I’m going to show you the entire formula for Customer Group Profits first and then I’ll explain what each line does.
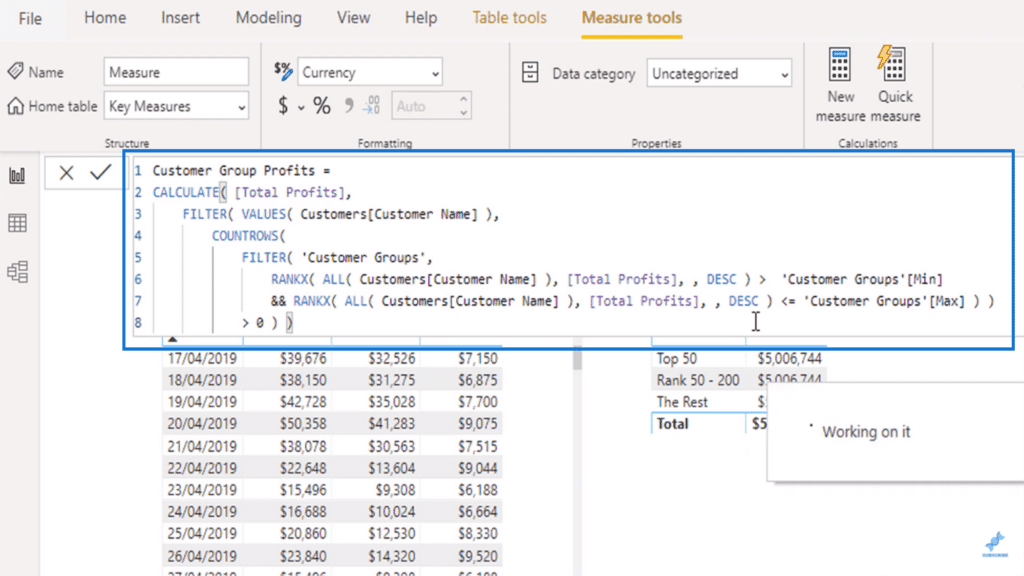
Running the advanced DAX function and inserting the measure into your table will give you the Total Profits of each customer group.
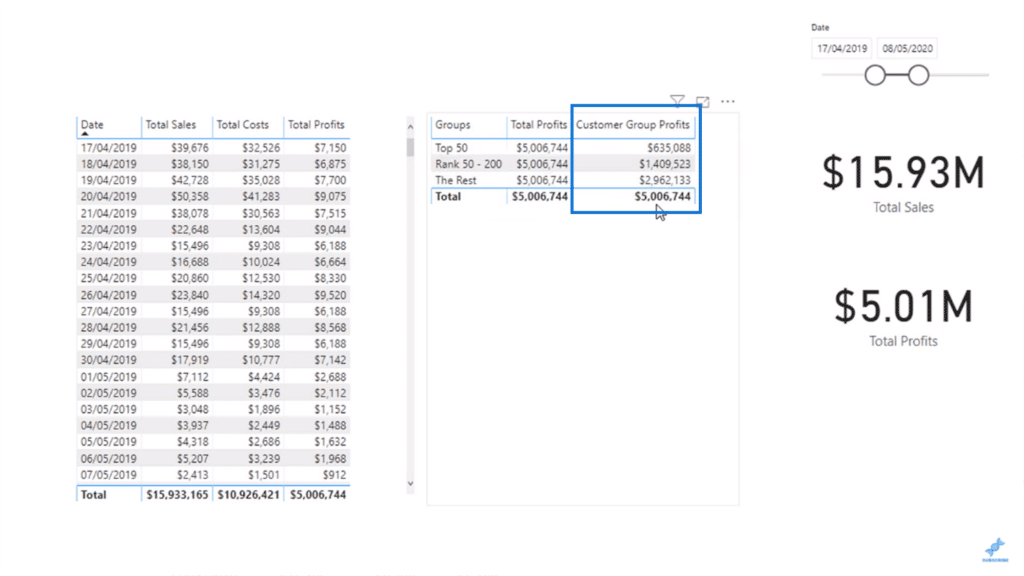
So how did this happen?
The formula generated context to relate the supporting table to Total Profits.
The CALCULATE function was used to call on Total Profits but in the context of a modified filter.
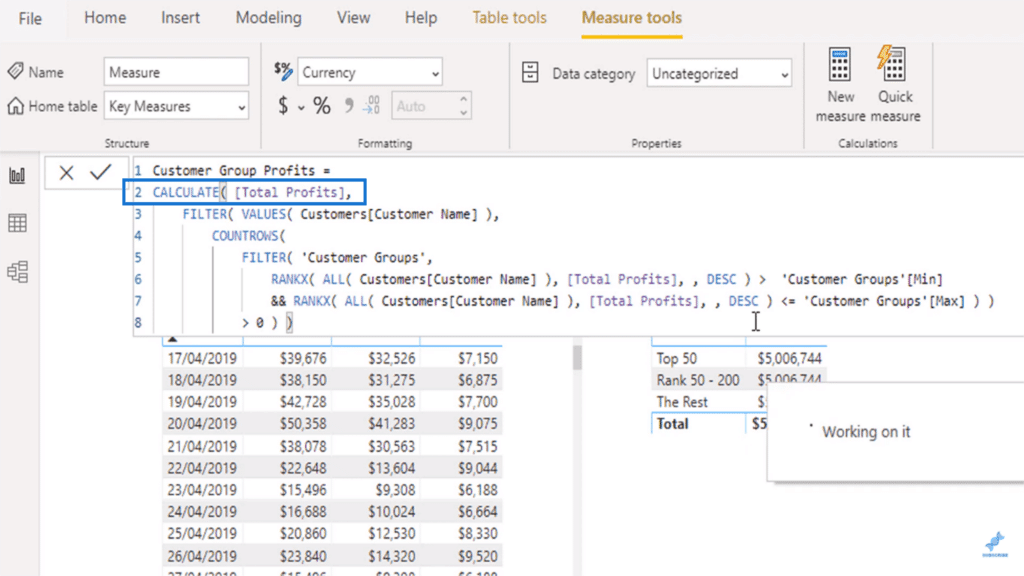
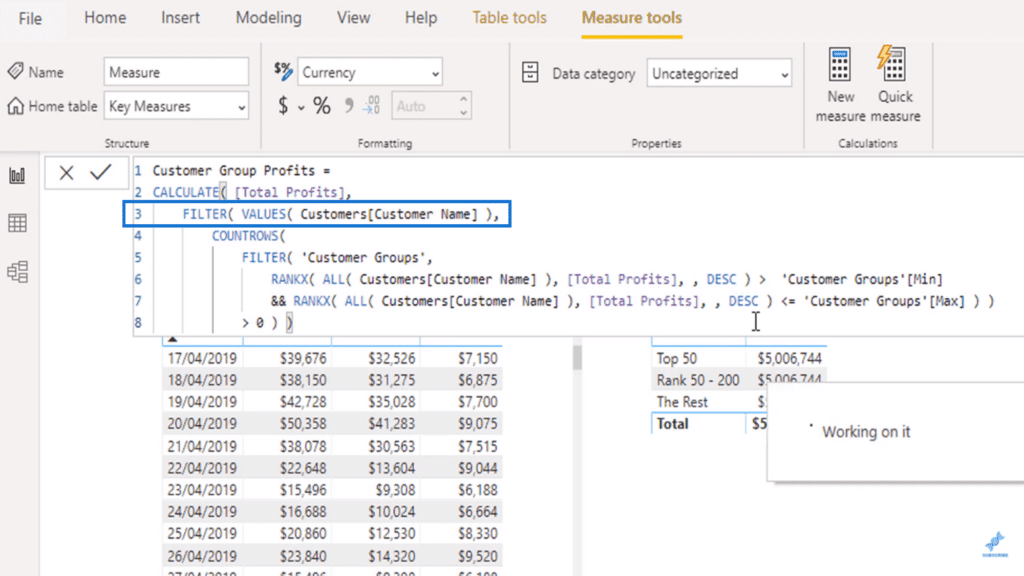
Using VALUES, the advanced DAX function iterated profits per customer by calling on each Customer Name.
Moreover, FILTER enables it to add a table function. In this case, it’s bringing up my list of customers.
Data was filtered further using RANKX. This function worked out the ranking of every customer based on Total Profits.
It also determined if a customer’s ranking is greater than the minimum ranking of each customer group or less than or equal to the maximum ranks. This way, each entry fell only within one group without any overlap.
In short, RANKX was responsible for sorting customers into their appropriate Customer Groups.
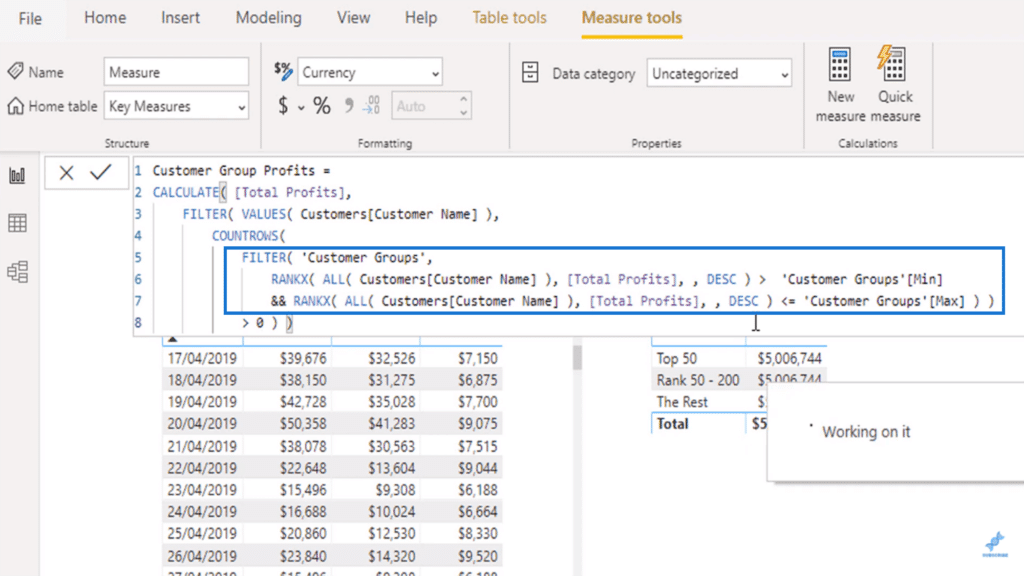
Meanwhile, COUNTROWS specified that if there is one more row remaining in the table, the customer should be included in that particular group.
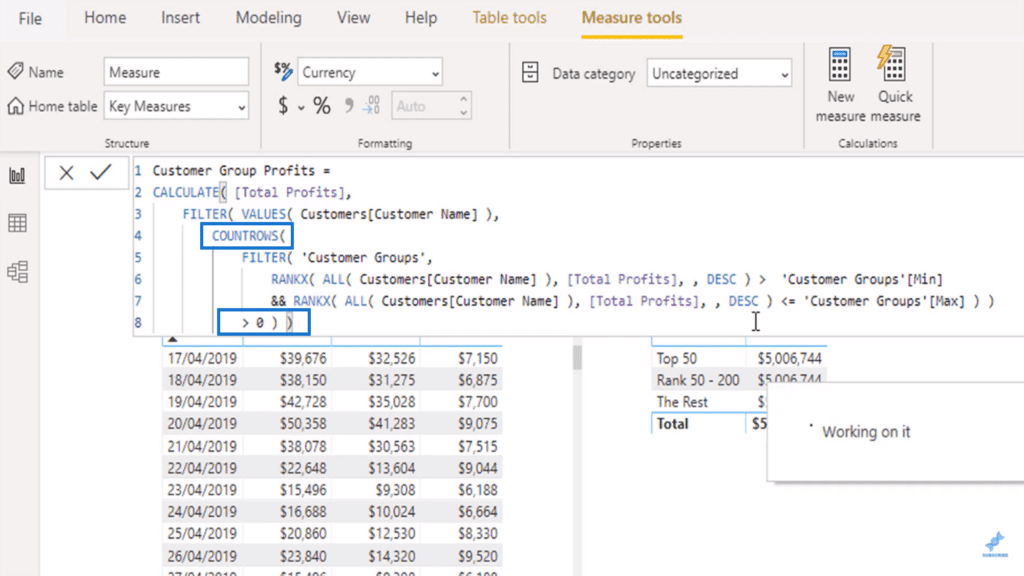
In the end, you’re able to go through every customer and evaluate if they fall within the minimum and maximum ranks of a particular row. This will place them either in the Top 50, Rank 50-200, or The Rest.
These advanced DAX functions make it possible for the Customer Group Profits column to show the total profits of a specific customer group.
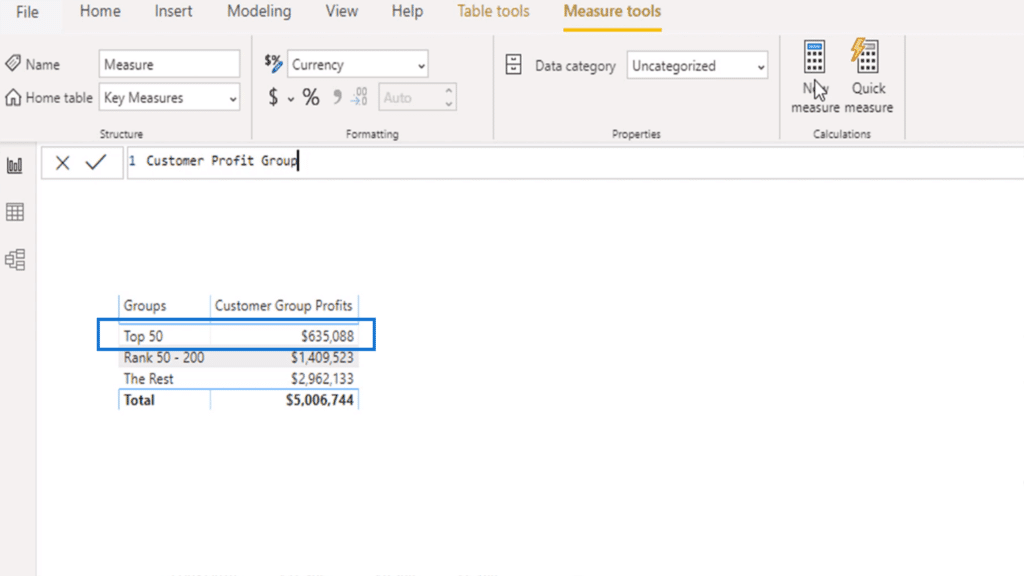
Calculating the Percentage Contribution Of Each Bracket
The analysis can be taken further by calculating the percentage of profits per customer group.
For this, you’ll need too create a new measure called Customer Profit Group Percent.
Use DIVIDE to get the percentage of the Customer Group Profits by the Total Profits. The Total Profits always evaluates to $5M in this context.
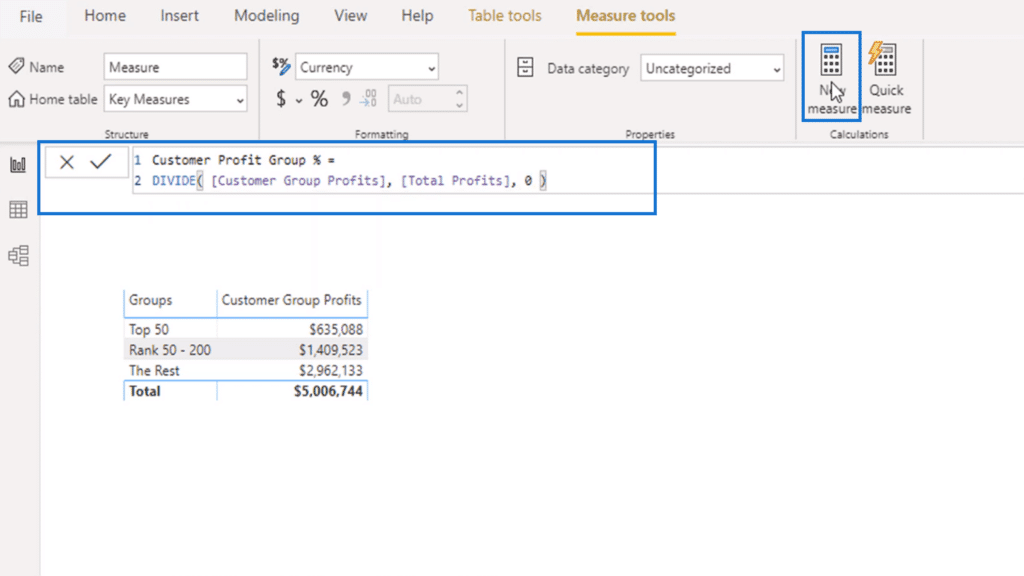
Drag the measure into your table and fix the format.
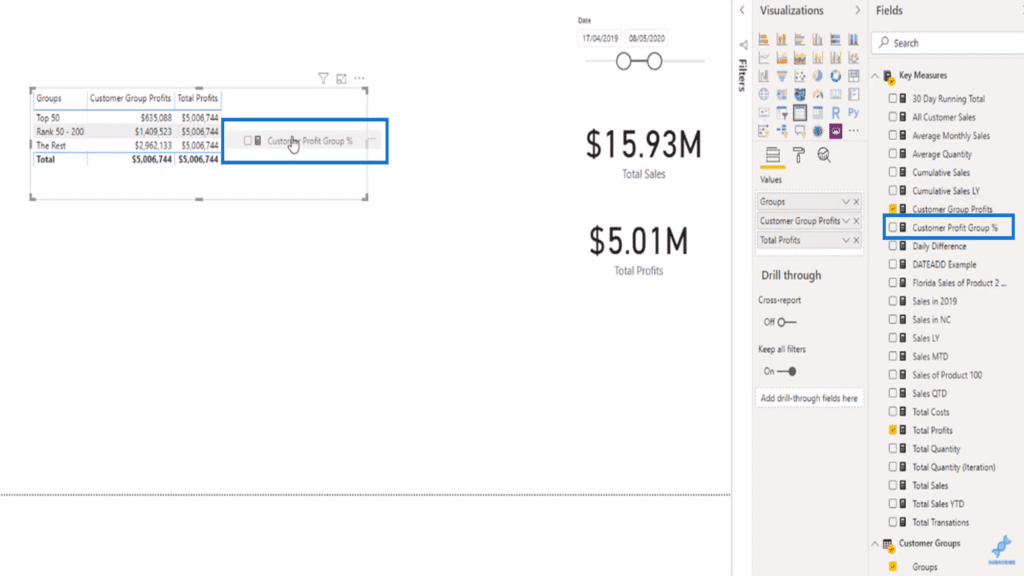
Now you have a column for the Customer Profit Group Percent. As you can see, its values are what you get when you divide the profit of a specific customer group by the Total Profits.
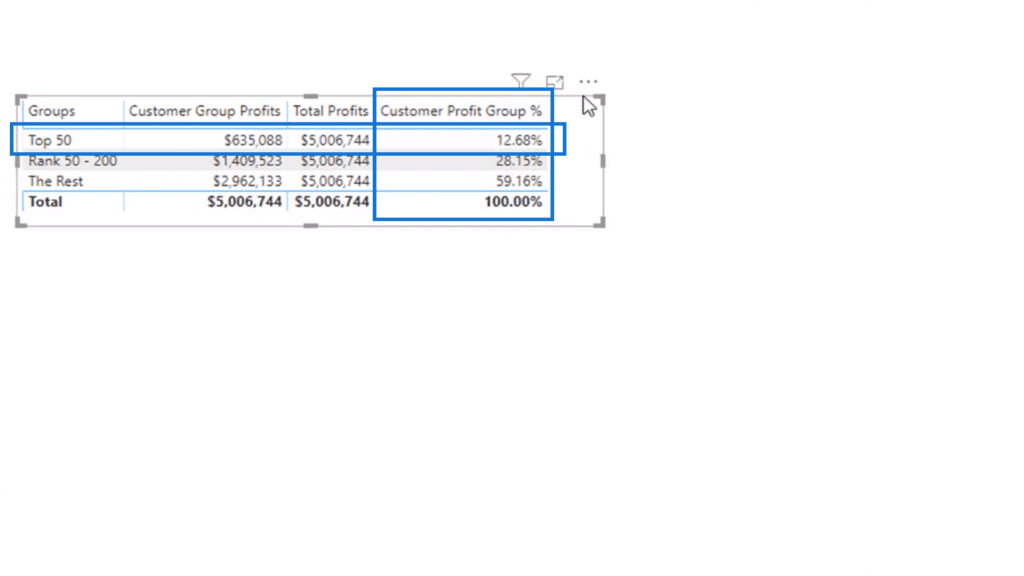
You can actually remove intermediary columns like Total Profits and the advanced DAX function will run the calculation just fine behind the scenes.
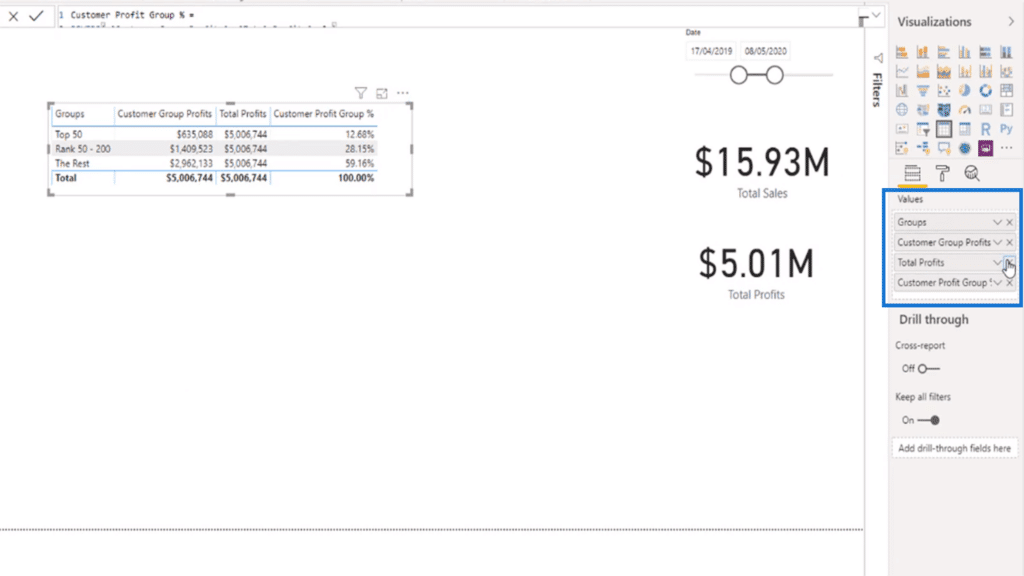
What’s great about this is you can add additional context then make visualizations of the result. Just copy the table and then drag fields into Values.
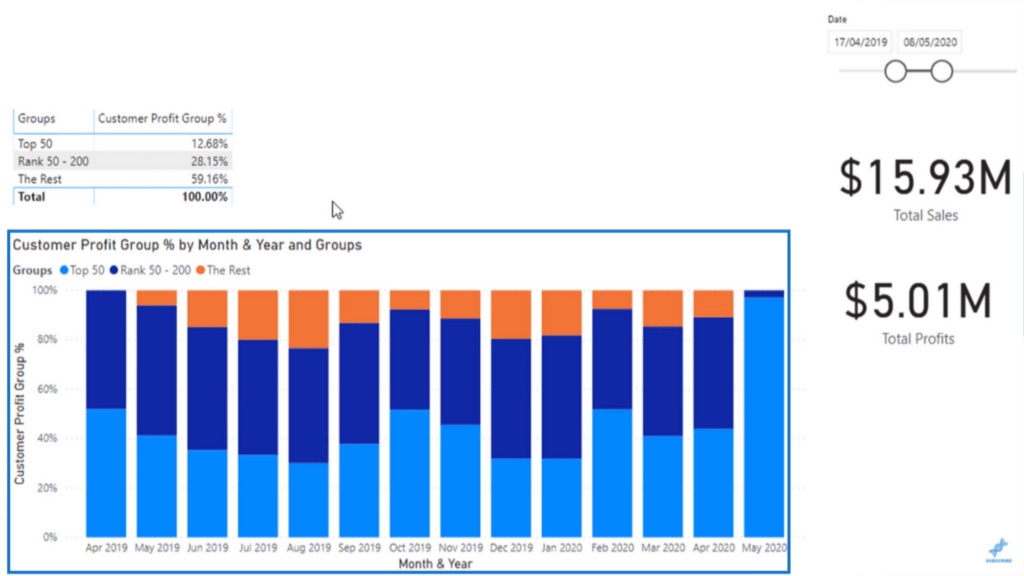
Here, I added Month & Year and turned it into a percentage chart.
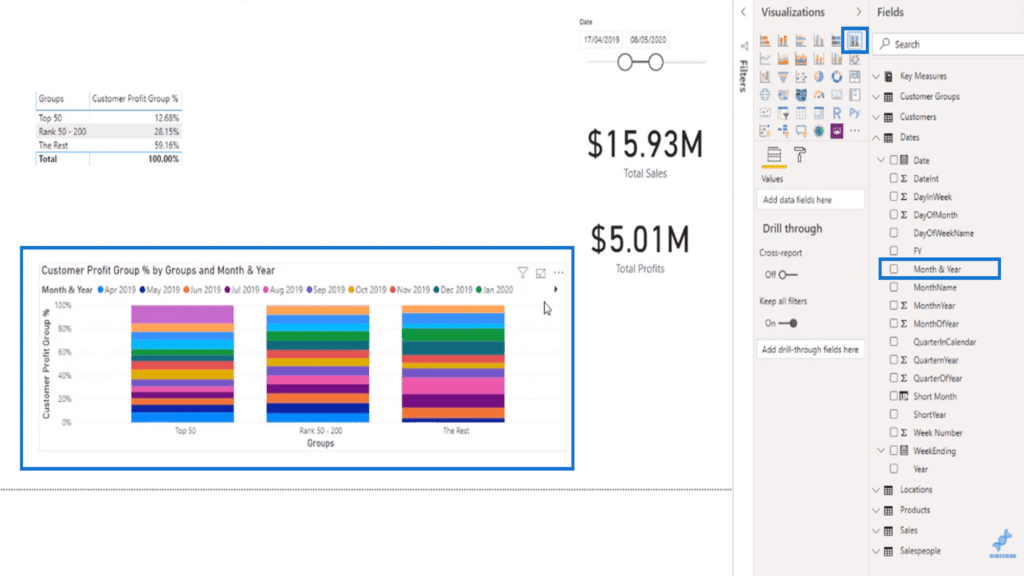
I swapped around which fields go into the axis and legend. Month & Year needs to be on the Axis while Groups should be placed on Legend.
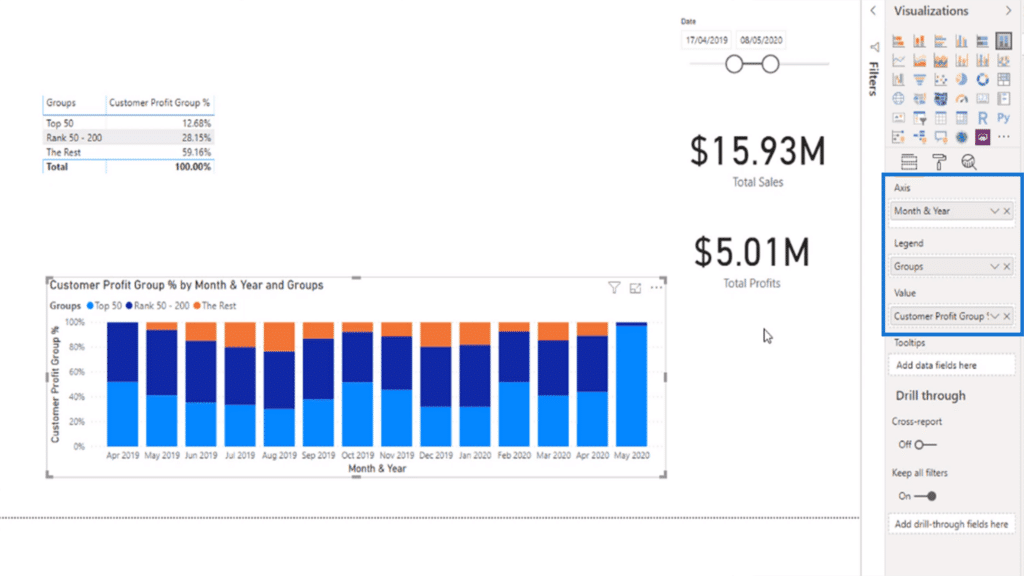
What I have now is a bar graph that shows which customer group gives the most profit per month and how the trend changes over time.
***** Related Links*****
Manage Multiple Date Calculations In Your Fact Table – Advanced Power BI Technique
Optimizing Your Power BI Formula Using Advanced DAX Functions
Data Segmentation Techniques Based On Any Measure – Advanced DAX
Conclusion
Advanced DAX functions are valuable tools in Power BI. They are versatile and can give you rich insights for your reports. Hopefully this tutorial has given you an idea of how to use them in your own context.
In the next blog posts, I’ll discuss what else you can do with advanced DAX functions. Until then, try exploring this example on your own.
All the best!
Sam


