For today’s blog post, I’ll come up with a solution that will address data granularity issues. At Enterprise DNA, we are believers of getting your hands dirty. Our ongoing series, Problem of the Week, is all geared towards putting what you’ve learned into practice. We don’t think there’s a faster way to learn Power BI than rolling up your sleeves and getting into it. You may watch the full video of this tutorial at the bottom of this blog.
For Problem of the Week #4, we were asked to take some summarized data and create a daily fact table using power query. We have quite a lot of content currently available on Enterprise DNA that covers something along these lines using DAX. For those of you who’ve taken the certification, one of the key modules is the budgeting analysis. One of the things discussed in this module was how to split the budget into daily granularity, so feel free to check it out.
Starting With The Power Query Editor
It was interesting that most people took the same approach with their solutions. In this post, I’ll break it down how I tackled it. Let’s go to the power query editor. Starting with the summarized view, the first thing I did was to make sure that these are in a date format and decimal number format.

The first step was to know the number of days between the start date and the end date. This will help me get the daily values I will need for my Cost, Consumption, and Emission columns.
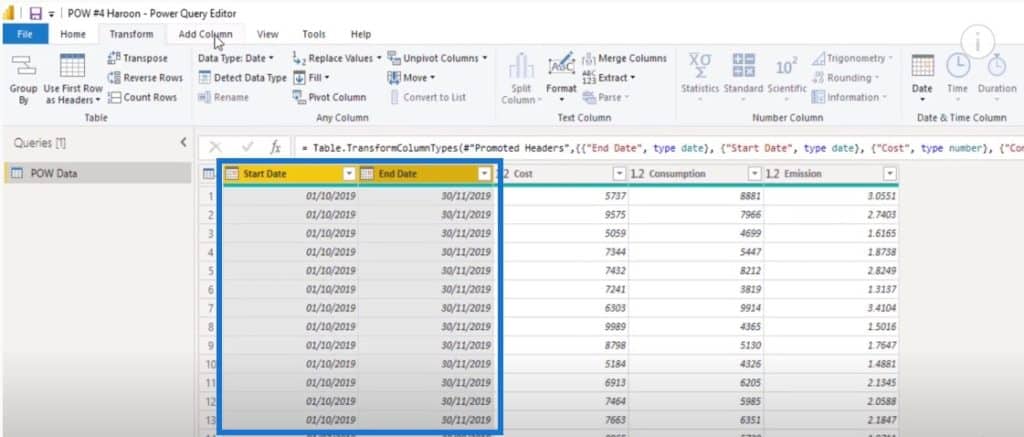
There are multiple ways to do this in Power BI. This is the way that I did it.
I added a new column and called it Duration, then added End Date minus Start Date.

The results look pretty good. We have the Duration column.

The next thing to do is to create a column of dates so that every date between 1/10 and 11/30 is in one column. I can quickly create a list by turning this into a whole number.


Adding a Custom Column
All that’s left to do is add a custom column. I’ll call this column Date and use curly brackets to create a list of the start date all the way up to the end date.

The result has given me that list. I can expand to new rows or extract the values.

In this instance, I choose to expand to new rows. Our list now is from 1/10 going all the way up to 11/30.

I can now get rid of these two columns because I no longer need them.
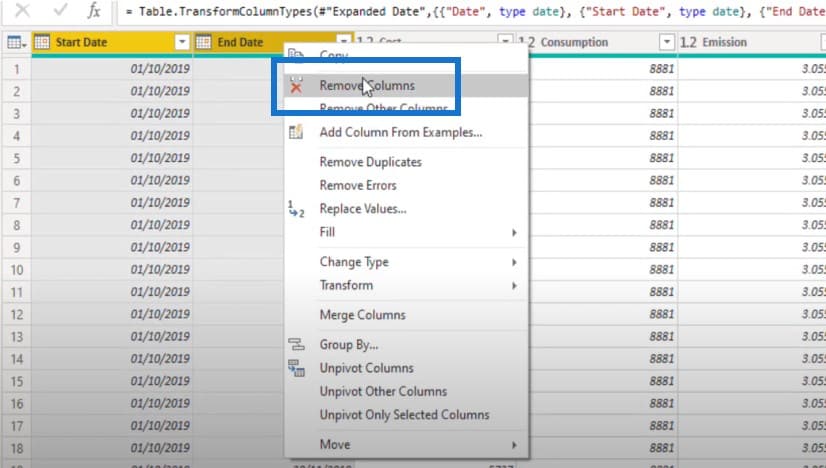
I now have a nice, orderly Date, Cost, Consumption, and Emission columns.

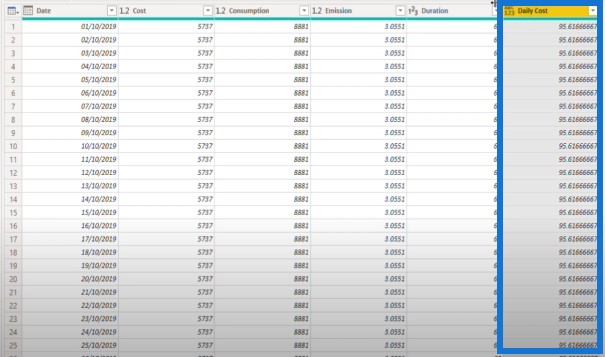
I need to create another custom column and call it Daily Cost, where the Cost will be divided by Duration.

The result looks right to me.
I need to do this again for the other two columns: Consumption and Emission. Then I need to get rid of all the columns that I don’t need.
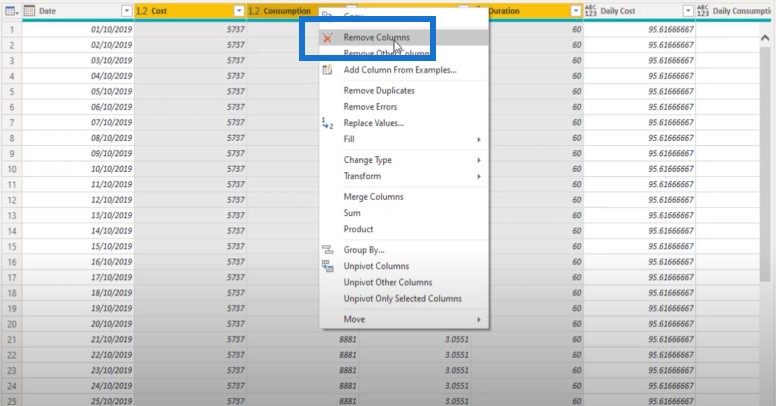
Now, I have a Daily Cost, Daily Consumption, and Daily Emission. I can even rename these columns to just Cost, Consumption, and Emission. I have this single date table that I can now connect to a date table and be able to do standard time analysis.

This was how the problem was covered. However, there was a particular comment on Melissa’s entry that I also wanted to highlight here.

I think that this is a key point. Some of the steps I’ve covered here were repeated multiple times. You could easily bundle these daily calculations into one step as Melissa did here, and I highly recommend that you review her work as well.
***** Related Links *****
Managing Seasonality In Your Budget Analytics – Advanced Power BI
The Ultimate Budget Allocation Formula For Power BI Analysis
Sales Vs Budgets Insights – Extended Budget Allocation Formula
Conclusion
I hope you can get to play around with this technique, and I hope that you can use this for your own reports. By addressing granularity issues in your data, you’ll be able to create more data points and drill down on the finer details of your reports.
Haroon
[youtube https://www.youtube.com/watch?v=qV5Fqs4d87w&t=16s?rel=0&w=784&h=441]


