In this tutorial, you’ll learn how to make a customer dashboard more intuitive using time intelligence in Power BI.
This is the second step when creating a customer deep dive dashboard.
When creating visualizations, you’ll most likely have to compare different time periods. This could be a comparison between the cumulative sales for two simultaneous years. So, you need to start writing more complex or advanced logic inside your DAX formulas.
Creating The Time Intelligence Measures
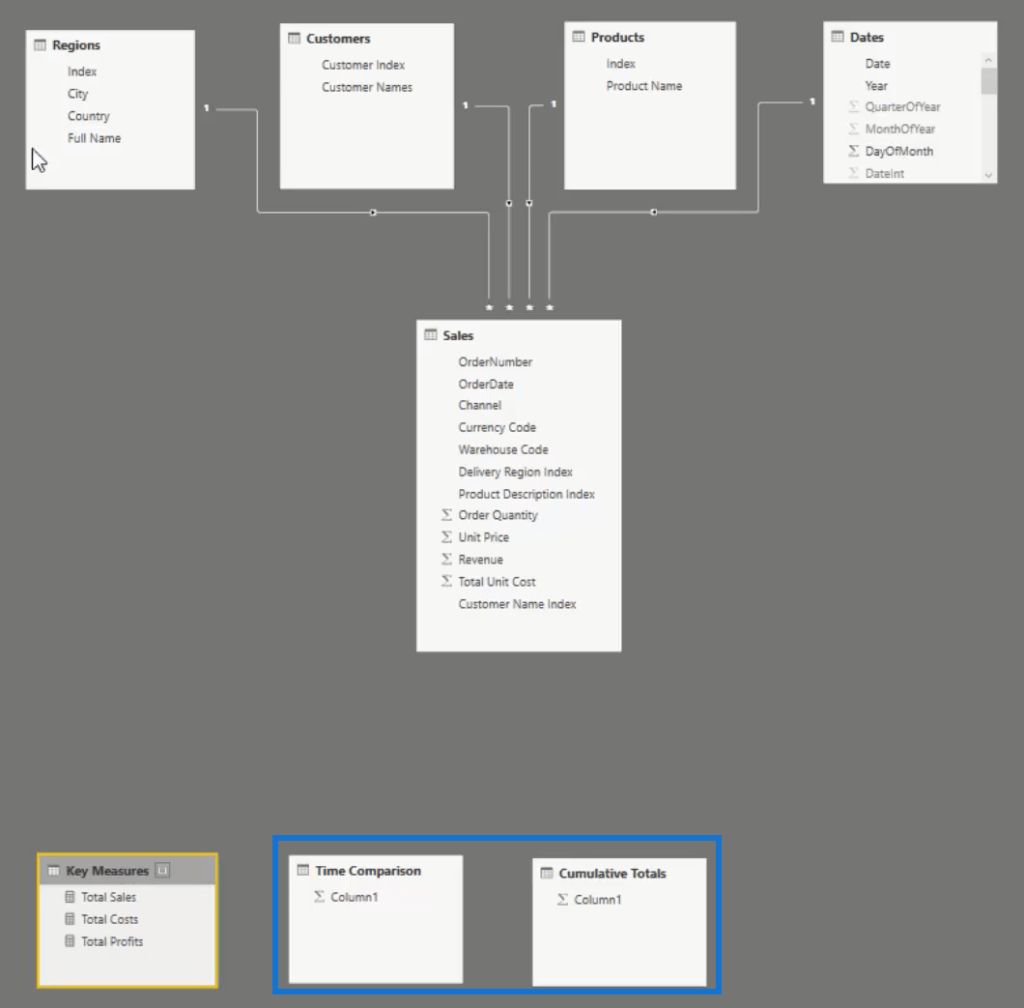
To start, create a couple of measure tables to reference your formulas. Call the first table Time Comparison and the second Cumulative Totals.

If you jump back to the data model, you’ll see the measure tables. They don’t have any relationship with your data model. So, put them at the bottom.

You can compare one period to another period. To do that, first get rid of Total Costs and Total Profits in the table. Next, look and focus at the total sales for 2nd quarter in 2016.
Comparing Different Periods
Make a new measure and call it Sales LY. Use CALCULATE and input Total Sales. The CALCULATE function is always used at the beginning of time comparison formulas. Next, use the function SAMEPERIODLASTYEAR and put in the Date column.

If you drag this measure in the table, you’ll get this year’s sales versus last year.

If you want to go back to the sales two years ago, copy and paste the previous formula, and call it Sales 2Yrs Ago. However, instead of using SAMEPERIODLASTYEAR, use the function called DATEADD, put in the Dates column, and jump back to 2 years.

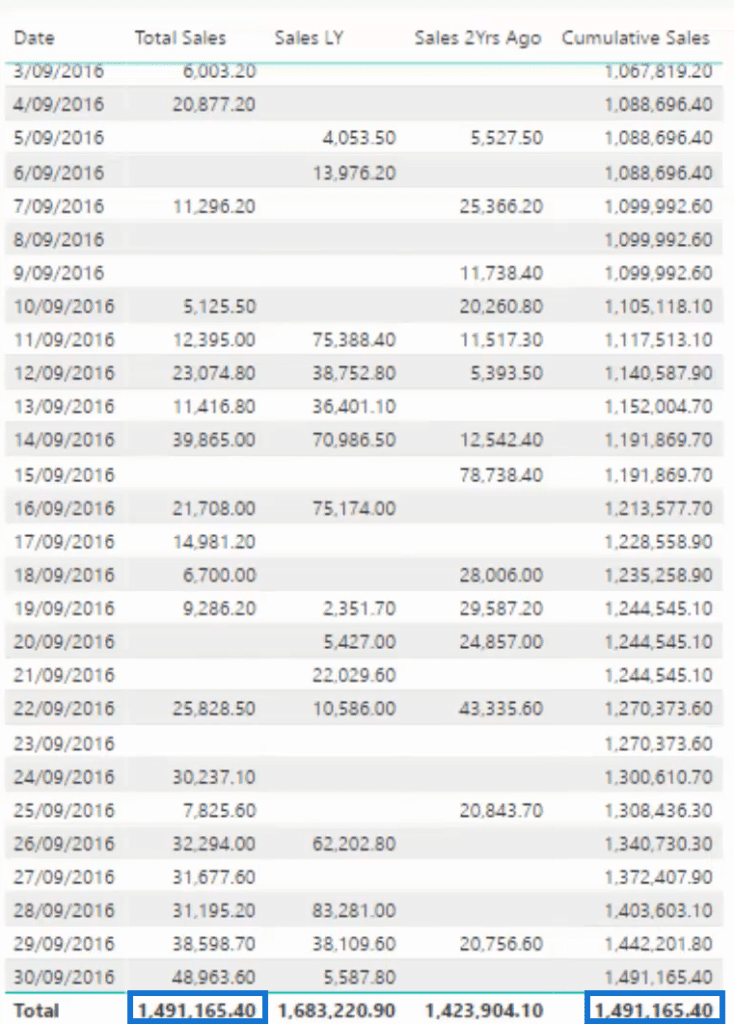
If you drag this into the table, you’ll see that you have sales for this time period and the sales from 2 years ago.

This table can be turned into a visualization but it would be hard to extract any insight out of it.

What you can do instead is turn these into cumulative totals because they allow you to identify the trends over time cumulatively. That’s why you have the Cumulative Totals measure table.
Quickly do that by understanding that there’s a pattern to this. You can reuse it by copying and pasting it into any model you have or sub in a different measure.
Creating Cumulative Totals
Create a measure and call it Cumulative Sales. Next, type these functions:

This formula creates these accumulations as you work down the dates. The ALLSELECTED function releases or gets rid of the context in the date table for the selection chosen.
If you change ALLSELECTED to ALL, you will see how the results change significantly. ALL function gets rid of any date and context. It jumps back all the way to 2014 and starts the cumulative total from the first date it made a sale.
With this, you’ll now get the cumulative total for the total sales in a selected timeframe.
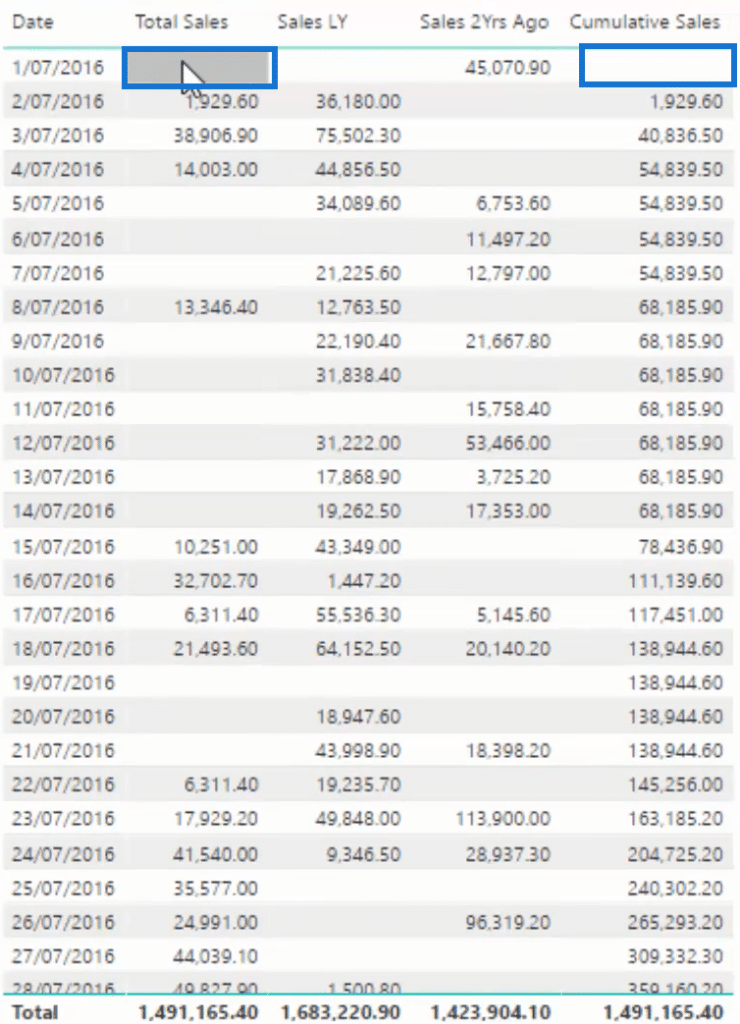
Turn it back into a table and place the measure in it. You can see that the Cumulative Sales column is accumulating over time on whatever timeframe you select. If you change the timeframe, it will always start at zero and then accumulate.
The total of the cumulative total pattern and the overall total at the end of the selection is the same.

Also, you can see that there’s no result on the first row because there’s no sale on the first day of this quarter.

Now that you’ve created cumulative sales for this time frame, you can also create cumulative sales for last year and two years ago. You can copy and alter the measure from before.
Change the title, and put the measure for sales last year in CALCULATE.

Do it again for the cumulative sales 2 years ago.

Transforming Measures Into Visualizations
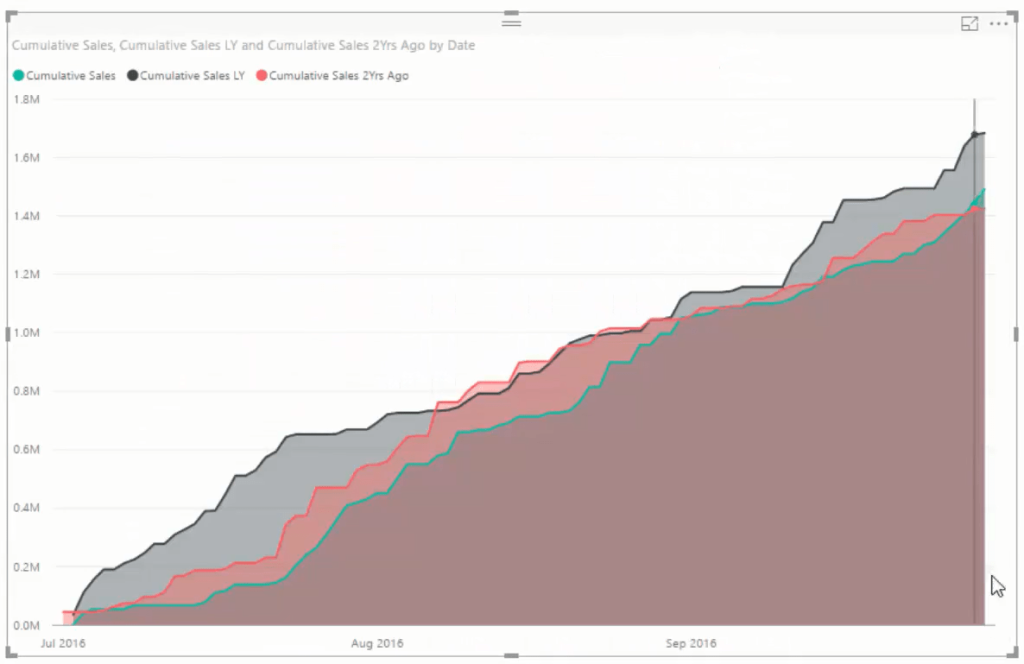
It’s incredible how quick you can achieve that insight. Now, you have the cumulative sales for this year, last year, and 2 years ago. If you get rid of the other columns except the cumulative sales tables and turn it into a chart, you’ll get this stunning visualization.

Conclusion
By implementing time intelligence calculations in your customer dashboard, you can select different time frames and groupings of customers and see how each visualization changes.
They will look more compelling and produce good insight. And by using cumulative amounts, you can see how the trends are forming in sales.
All the best,
Sam
***** Related Links *****
Common Time Intelligence Patterns Used In Power BI
Comparing Any Sale Versus The Last Sale (No Time Intelligence) – Advanced DAX In Power BI
The DATEADD Function: The Best And Most Versatile Time Intelligence Function In Power BI
***** Related Course Modules *****
Dashboarding & Data Visualization Intensive
Data Visualization Tips
Time Intelligence Calculations
***** Related Support Forum Posts *****
Cumulative Total With Time Intelligence
Data Modeling Based On Custom Time Intelligence Format
Time Intelligence Help (Previous Month Calculation)
For more time intelligence queries to review see here….


