When it comes to data analysis, having a solid grasp of the various statistical measures can make all the difference. Among these measures, the median holds a unique position.
It offers a different perspective than the mean and is particularly useful when dealing with skewed data or outliers.
To calculate the median in Excel, you use the MEDIAN function. First, select the cell where you want the median value to appear. Then, type =MEDIAN( followed by the range of cells containing your data). For example, if your data is in cells A1 through A10, you would type =MEDIAN(A1:A10). Press Enter, and Excel will calculate and display the median value of the data in the specified range.
In this article, we’ll walk you through the process of calculating the median in Excel.
We’ll provide you with a step-by-step guide to help you master this essential statistical measure.
Let’s get started!

What is a Median?
The median is a measure of central tendency that represents the middle value in a data set when the values are arranged in ascending order.
If the data set has an odd number of observations, the median is the middle value. For example, in the set [3, 5, 7, 9, 11], the median is 7
If the data set has an even number of observations, the median is the average of the two middle values. For instance, in the set [3, 5, 7, 9], the median is the average of 5 and 7, which is 6.
3 Methods to Calculate Medians in Excel
In this section, we will cover 3 methods of calculating the median in Excel.
Specifically, we will go over the following methods:
MEDIAN Function
Array Formulas with IF
AGGREGATE Function

Method 1: MEDIAN Function
The most straightforward method of calculating the median in Excel is using the MEDIAN built in function.
The median function syntax is given below:
=MEDIAN(range) “range” is the set of numbers you’re calculating the median for.
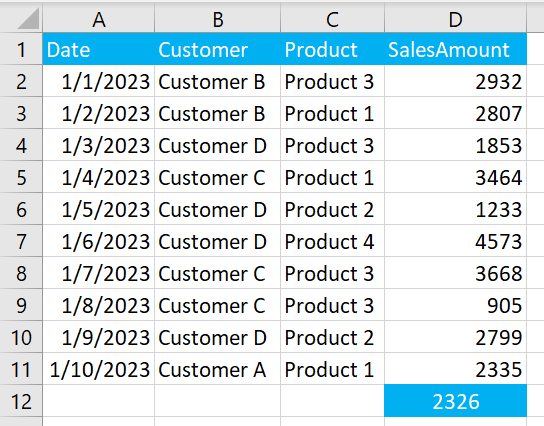
Suppose we have the following sales data:

We want to find the median of SalesAmount. To do this, you can use the following median formula:
=MEDIAN(D2:D11)In Excel, the formula looks like the following:

After clicking enter, Excel will display the median sales as shown below:

Method 2: Array Formulas with IF
For more complex scenarios, such as calculating the median for a subset of data based on certain criteria, you can use array formulas with the IF function. If returns logical values depending on the input.
The syntax of the formula is:
=MEDIAN(IF(range1=criteria, range2))This formula calculates the median of “range2” where “range1” meets the specified criteria.
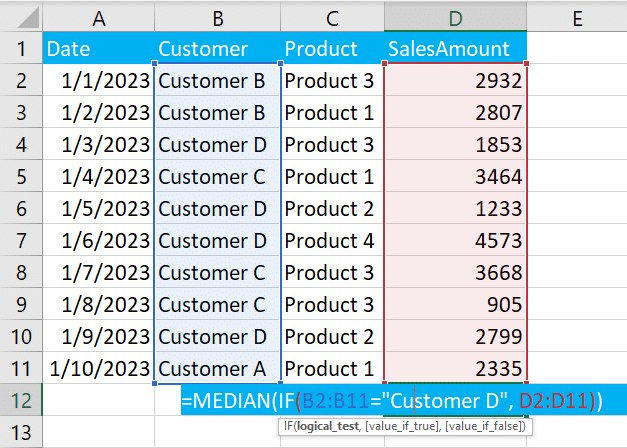
Let’s say we want to find the median of SalesAmount where the customer is D. SalesAmount consists of numeric values whereas the customer is a categorical column.
To find the median values, you can use the following formula:
=MEDIAN(IF(B2:B11="Customer D", D2:D11))In Excel, the formula will look like the following:

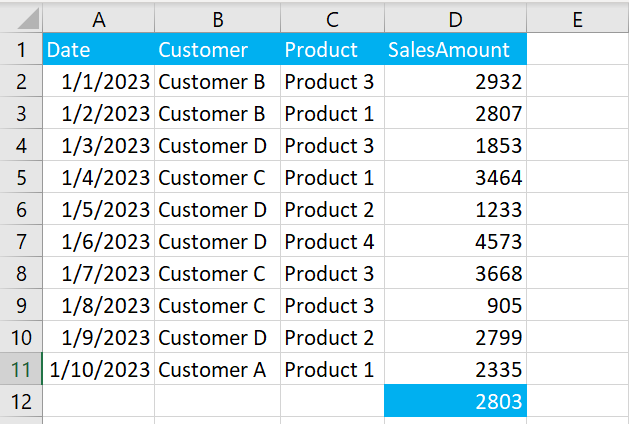
When you click enter, Excel will display the median according to your specified condition in an empty cell.

Method 3: AGGREGATE Function
The AGGREGATE function can be used to calculate the median while ignoring errors or hidden rows.
The syntax of the aggregate function is:
=AGGREGATE(12, options, range)The “12” specifies the median. The number 16 corresponds to the MEDIAN function within AGGREGATE. “options” is a number specifying which values to ignore, and “range” is the data range.
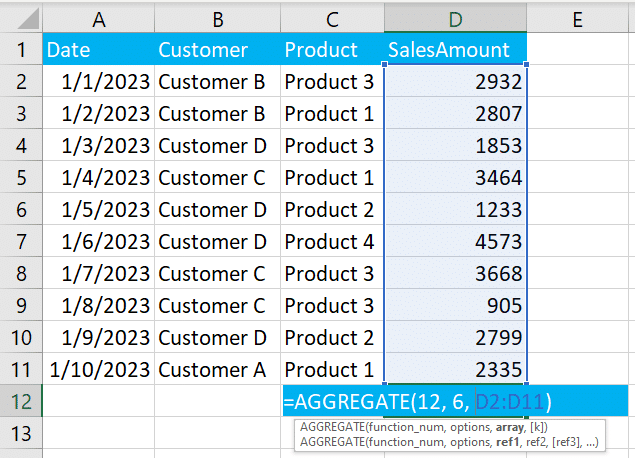
To calculate the median of SalesAmount using the AGGREGATE function, you can use the following formula in any empty cells:
=AGGREGATE(12, 6, D2:D11)16 specifies that we want to calculate the median. 6 tells the function to ignore error values, like #DIV/0!. D2:D11 is the range of the ‘SalesAmount’ column.

When you click enter, Microsoft Excel will calculate the median according to your defined conditions.

Learn the difference between Excel and DAX formulas by watching the following video:
Final Thoughts
Calculating the median in Excel is an essential skill for data analysis. It allows you to identify the middle value of a data set, which is particularly useful when dealing with skewed or outlier-filled data.
With the above three methods, you can compute medians in any scenario or project.
Furthermore, knowing the basic statistical functions in Excel opens doors for more advanced statistical and financial analysis, which is key in the modern data world.
Frequently Asked Questions
In this section, you will find some frequently asked questions you may have when calculating the median.

How do I calculate the median in Excel for grouped data?
To calculate the median for grouped data in Excel, you can use the MEDIAN function with an array formula.
First, you’ll need to create a new column that repeats the values according to their frequency. Then, apply the MEDIAN function to this new column.
What is the formula for calculating the median in Excel with multiple criteria?
To calculate the median in Excel with multiple criteria, you can use the MEDIANIFS function.
This function allows you to specify multiple criteria and find the median value that meets all the specified conditions.
Can you explain the steps for calculating the median in Excel using the VLOOKUP function?
The VLOOKUP function is used to look up a value in a table and return a corresponding value in a different column.
It is not directly related to calculating the median.
How to calculate the median in Excel pivot tables?
To calculate the median in an Excel pivot table, you can use the Value Field Settings options. Right-click on the pivot table cell, choose Value Field Settings, and then select Median from the available summary functions.
How to calculate the median in Excel 2016?
In Excel 2016, you can calculate the median using the MEDIAN function. Simply type =MEDIAN(array) in a cell, where array is the range of cells containing the data, and press Enter.
How do I calculate the median in Excel for a sample?
To calculate the median for a sample in Excel, you can use the MEDIAN function. The median is a robust measure of central tendency and is less sensitive to extreme values than the mean.


