Today, I’m going to walk you through an outstanding Power BI automation using Elgato Stream Deck. We’re going to talk about the types of actions that can be automated and advanced scripting options in Stream Deck. I’ll show you how to build the ultimate Stream Deck profile – perform an array of common Power BI tasks at the push of a button. You can watch the full video of this tutorial at the bottom of this blog.
I was doing some posting on LinkedIn, and I found out there was a lot of interest in this tool, so I got really deep into this. Originally, this was intended for video streamers. It was intended to control camera and onscreen effects. It’s got some sound effects as well. You can use it as a soundboard.
I started exploring what else we could do with it, and I found that it’s an incredible automation tool. I started thinking, could this really be used to automate Power BI in an interesting way? And I found out that we could actually use it as a Power BI automation tool.
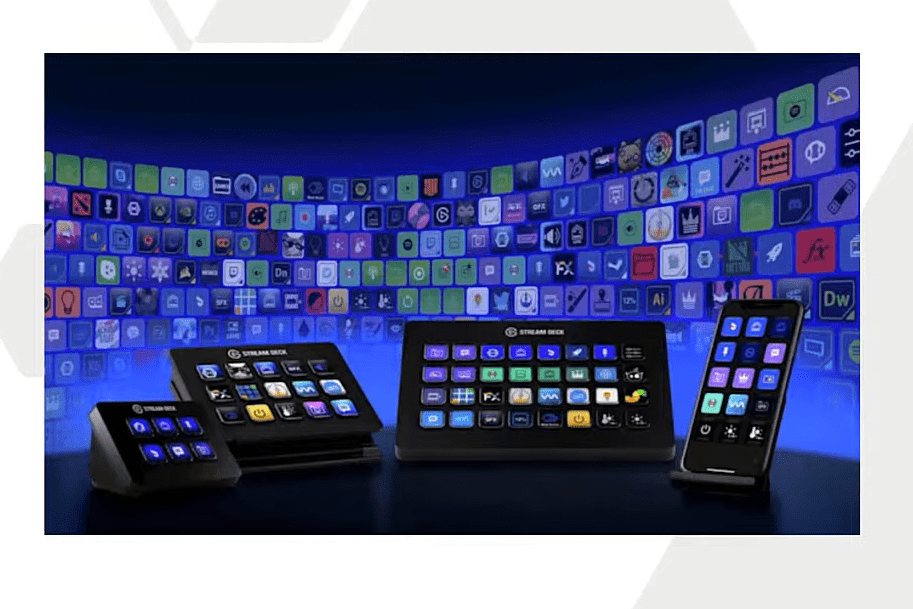
It’s an incredible combination of your web bookmarks, Windows shortcuts, program snippets, Power Automate Desktop, and a lot of other organizational and automation tools that you can integrate together into a common interface. But just to be clear, I have no association with Elgato. I just think this is an awesome product and I wanted to explore with you what are the possibilities of this tool and how you can maximize its use for Power BI.
We’re going to talk about the types of actions you can automate using your Stream Deck. We’re going to discuss how you can organize your information because that determines how efficient it’s going to be in terms of accessing the information you need and the automation that you need. There are a number of ways that the software gives you to organize, and there are better and worse ways to do that.
So let’s get started.
How To Use Stream Deck As A Power BI Automation Tool
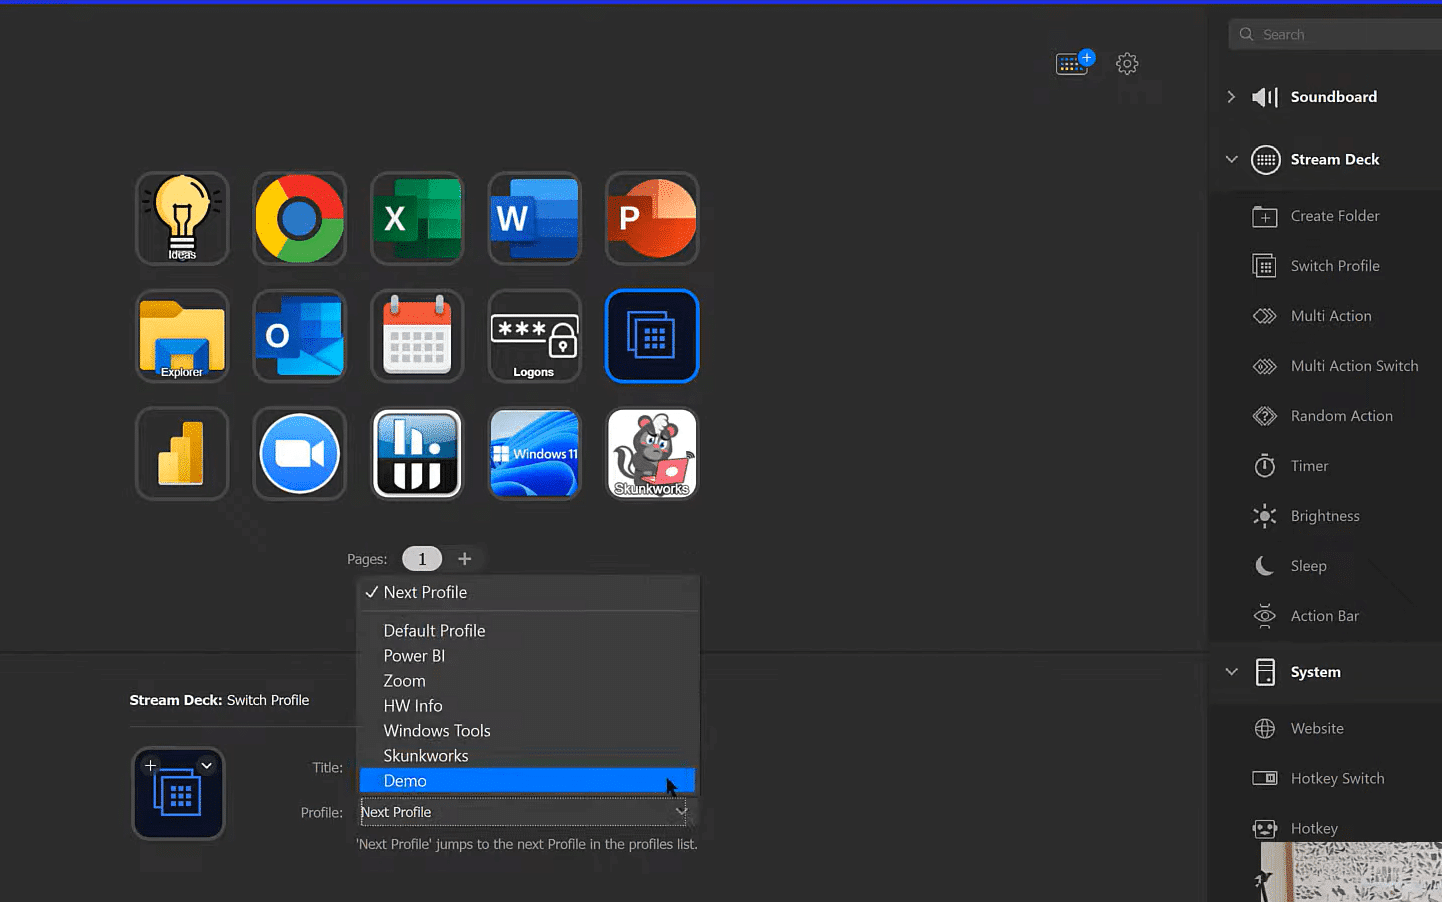
I’m going to use my Stream Deck for this demonstration. This is my top-level screen. For the moment, I’m still modifying it in a continuous way as we go. I’ve got an assortment of capabilities on the top level. You’ll see here, that this says Default profile, and so this is what it defaults to when the system comes on. The first button is called Ideas. It opens a notepad file that I use just to write down ideas for videos, LinkedIn posts, for just potential webinars and seminars, etc.
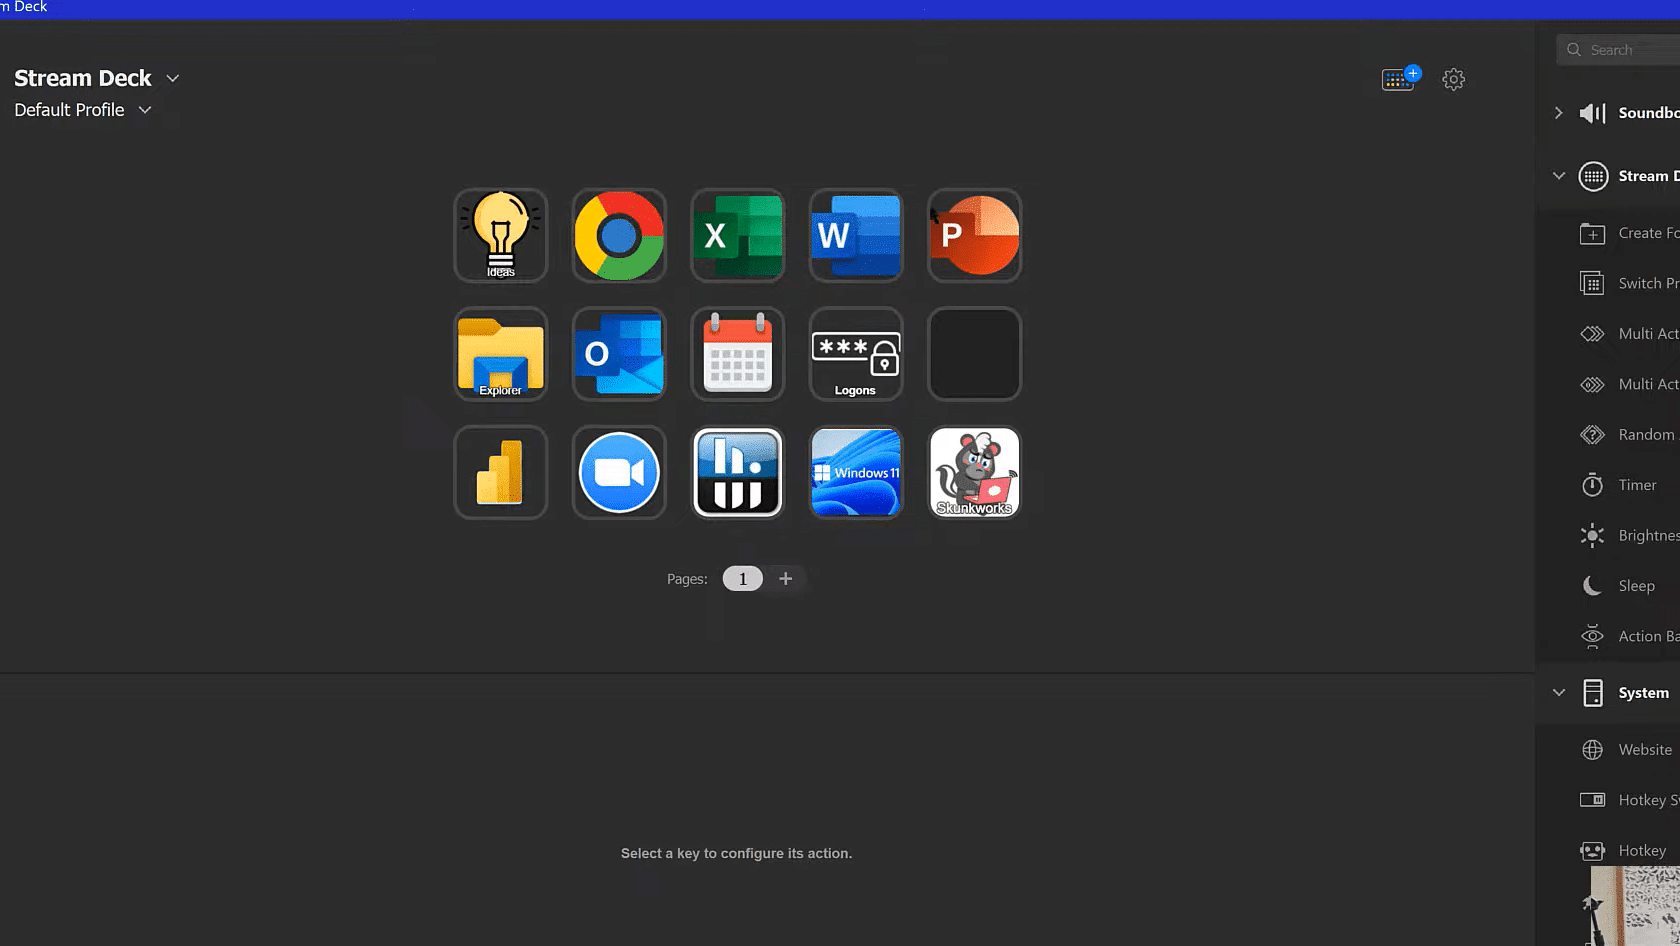
The top ones are app launchers. The next one down is Explorer, which is a folder button. This drills down into a set of common folders that I use. Then I got my email and calendar. This is a separate folder that drills down into some login information because you can have Stream Deck enter text for you.
And then, this is where it gets interesting. These are profiles, which are the top level of the organization. Profiles are kind of groups of common functions, and you can have an infinite number of profiles. So, let’s jump into my Power BI profile.
I got a folder for M for code snippets, the M code formatter, the Microsoft reference guide, and then just a series of websites that I find really useful as references for additional code snippets or problem-solving. For DAX, I got the External Tools, a bunch of code snippets, website reference, the SQL BI Dax formatter, and then a super macro to implement the DAX formatter, and a lot more resources and databases.
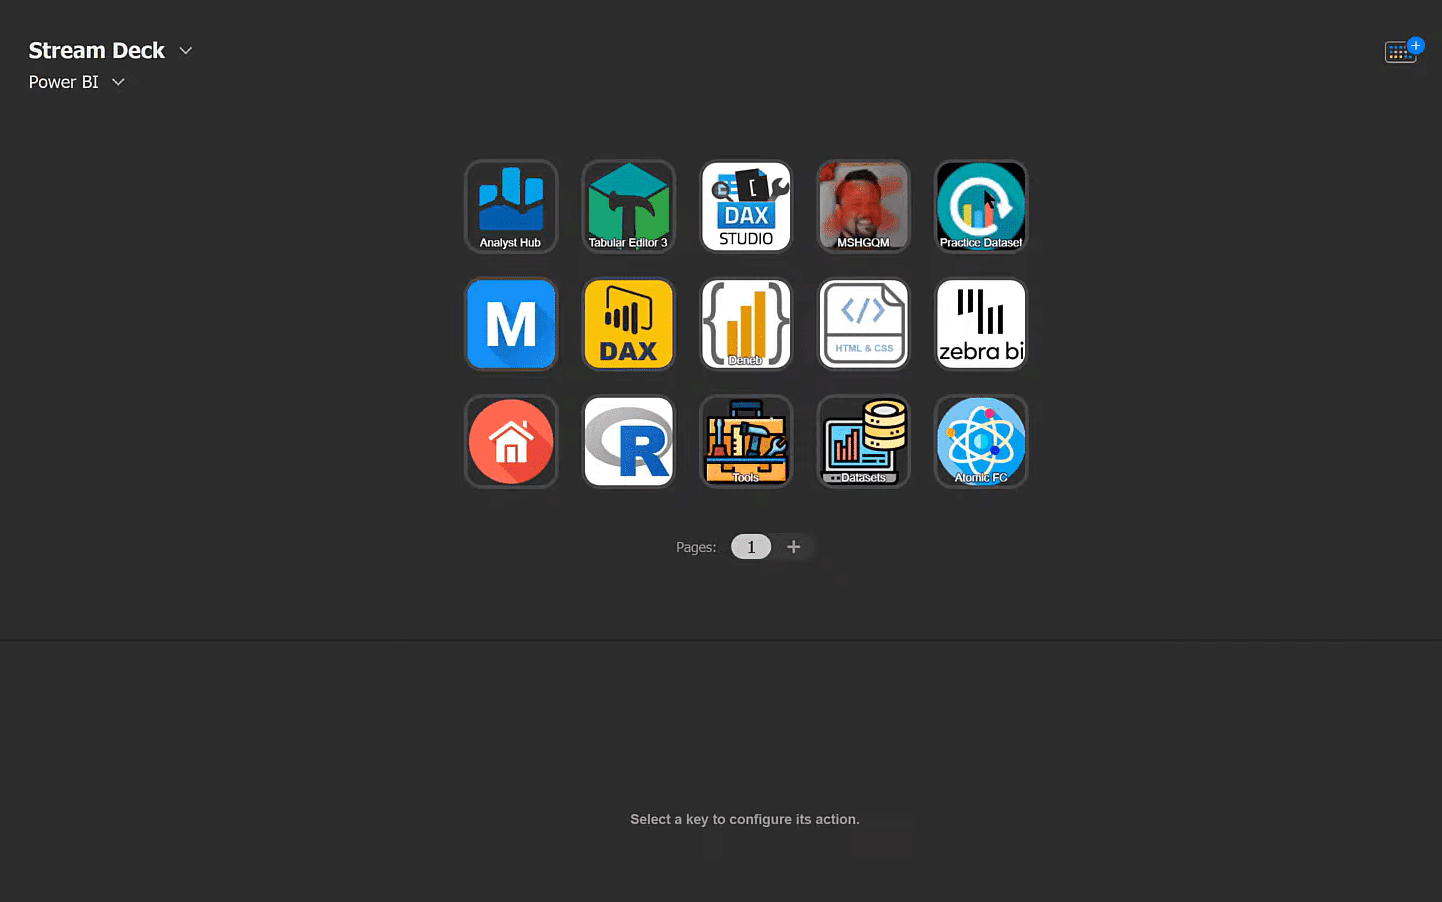
I recommend organizing your information by starting with Profiles, being at the top-level organization. Then, you can have folders within Profiles. You can also have pages but try to avoid multiple pages. I find it a little awkward in the navigation.
Now let’s try to create a new Profile. Let’s just call it Demo.
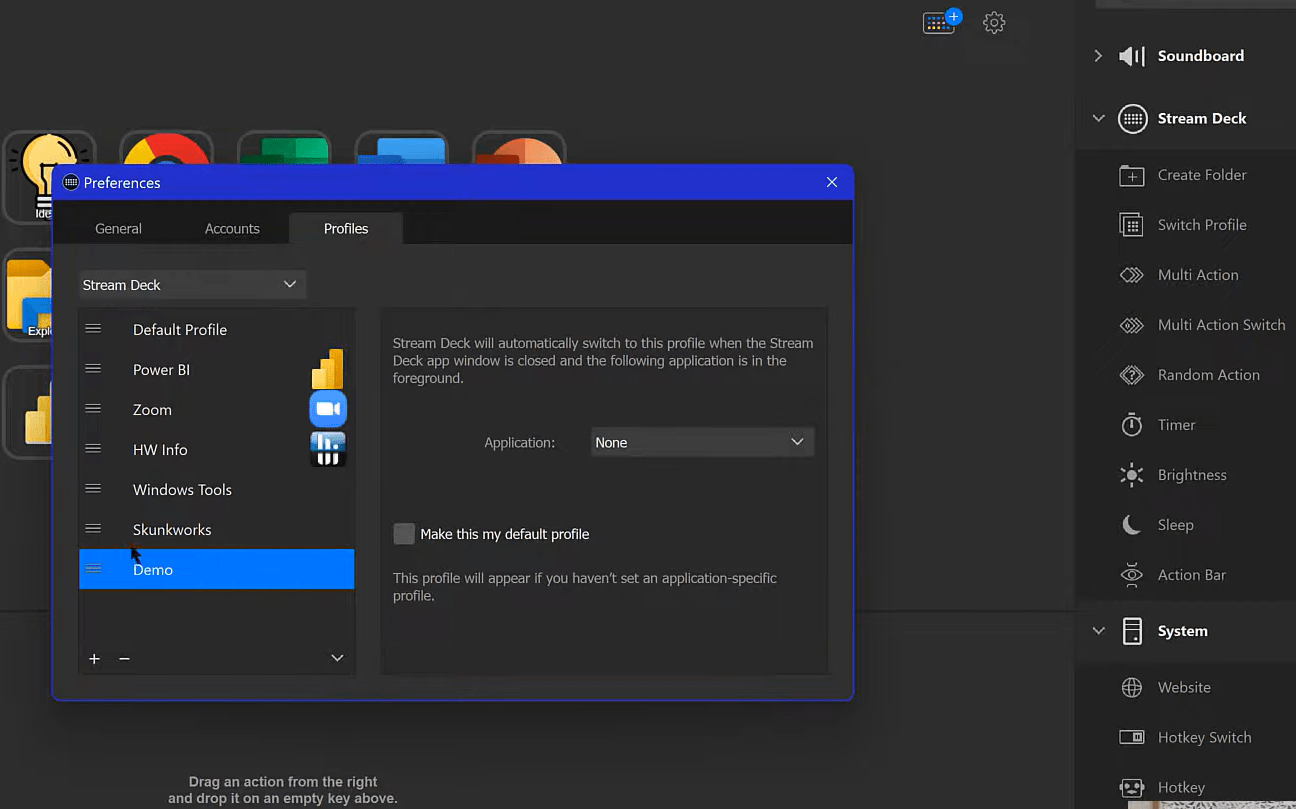
On this right-hand side are all the different functions that the software has actions for. For a profile, we can just click and drag that Switch Profile, and then we have this information screen for the button. We have an option here for Profile. We can either say Next Profile, or we can assign a particular profile to it. In this case, we’re going to assign the Demo profile we just created.
We can also assign icons in many ways. The program comes with kind of a large series of icons. We can add more through the store and the plugins. We can also create our own, but it’s time-consuming. What I usually do is go to flaticon.com and get icons there.
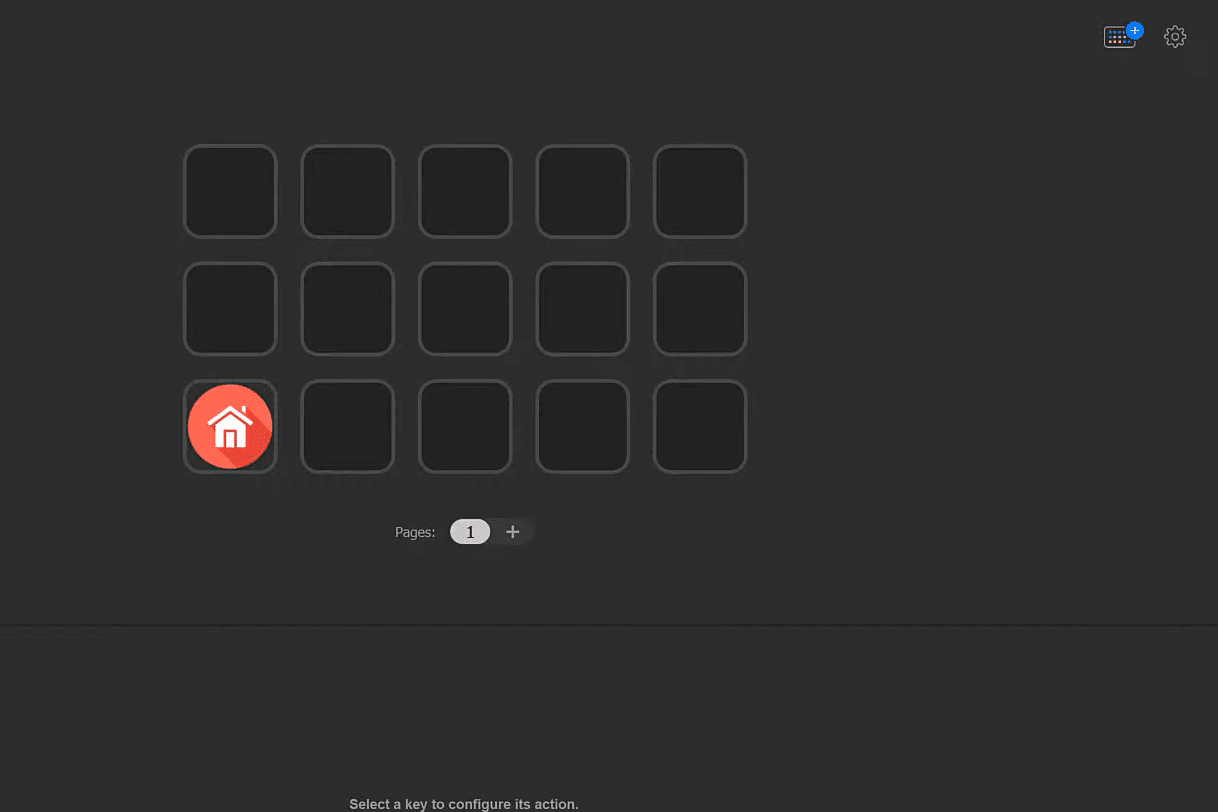
The first thing you want to do when you’re building out a profile is you want to add a navigation button to take you to the Default screen where you’ve got your other profiles. Otherwise, you’re going to paint yourself into a corner and get trapped in this profile with no way out. And so, this is an example of a Default screen I created.
We’ve got all sorts of options here. We can link to a website, open a program, add text, create a folder, etc. There’s a thing called Multi Action and Multi Action Switch, which let us combine different actions into a single button. There are some advanced buttons that we can access through plugins.
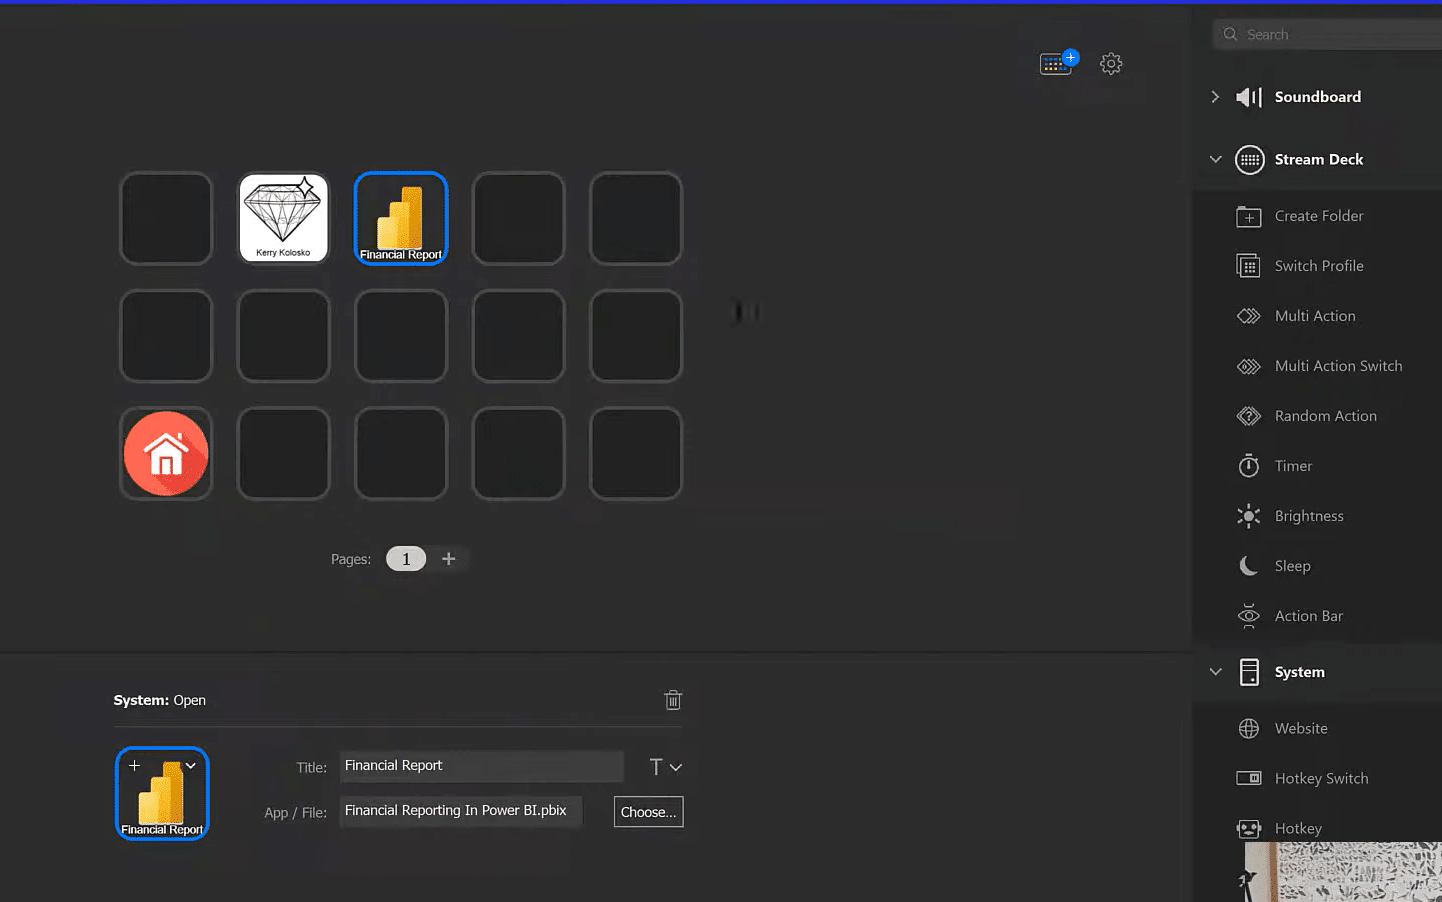
And now, when we click on these icons, say this Power BI report, it’s just going to fire up Power BI and then load that file directly. This is a great way to kind of organize and access your most used files.
The next thing I want to show you is how to add code snippets. We start by dragging the Text Action into a button, and then I’ve got a brief DAX measure that I can paste in here. We can title that as Top 5.
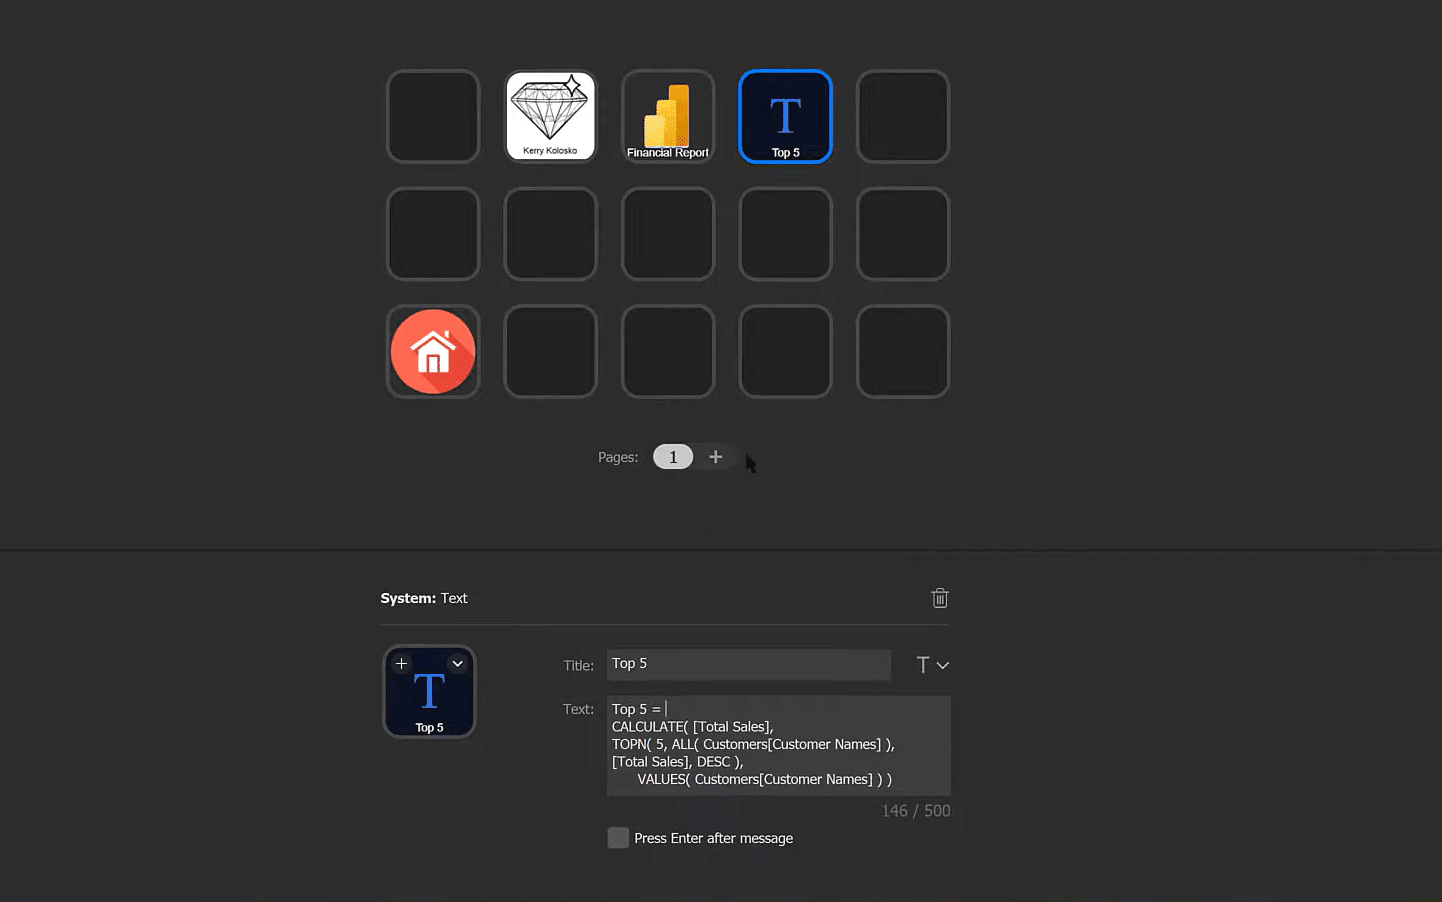
There’s a bit of a warning about DAX measures to be used as code snippets. If you use either a hard return or a shift hard return when it automatically enters that text in with the press of a button, the DAX Editor is going to read either of those returns as Enter, and in the DAX Editor that accepts the code. So, all you’re going to get, if you automate this button in the DAX Editor this way is Top 5 = and then it’s going to hit return and it’s going to accept that code.
There are two ways around that. One of which is you can basically enter your DAX measure without any hard returns, just all on one line. Then, you can format it using the Analyst Hub format or the SQL BI DAX Formatter, or a C# macro in Tabular Editor.
The other thing you can do is do your DAX measures in Tabular Editor where enter is not a code acceptance key. You can have it automated by just hitting that text button and the whole measure will enter with hard returns intact. So, that’s one warning when using code snippets for DAX, but it works great for M, C#, R, and Python.
Furthermore, we can also create a folder. It automatically creates this arrow button to take us out rather than strand us on that page. And what I usually do is add a button to drill up. When we’re in the folder, we can either drill up a level or back out to your default page.
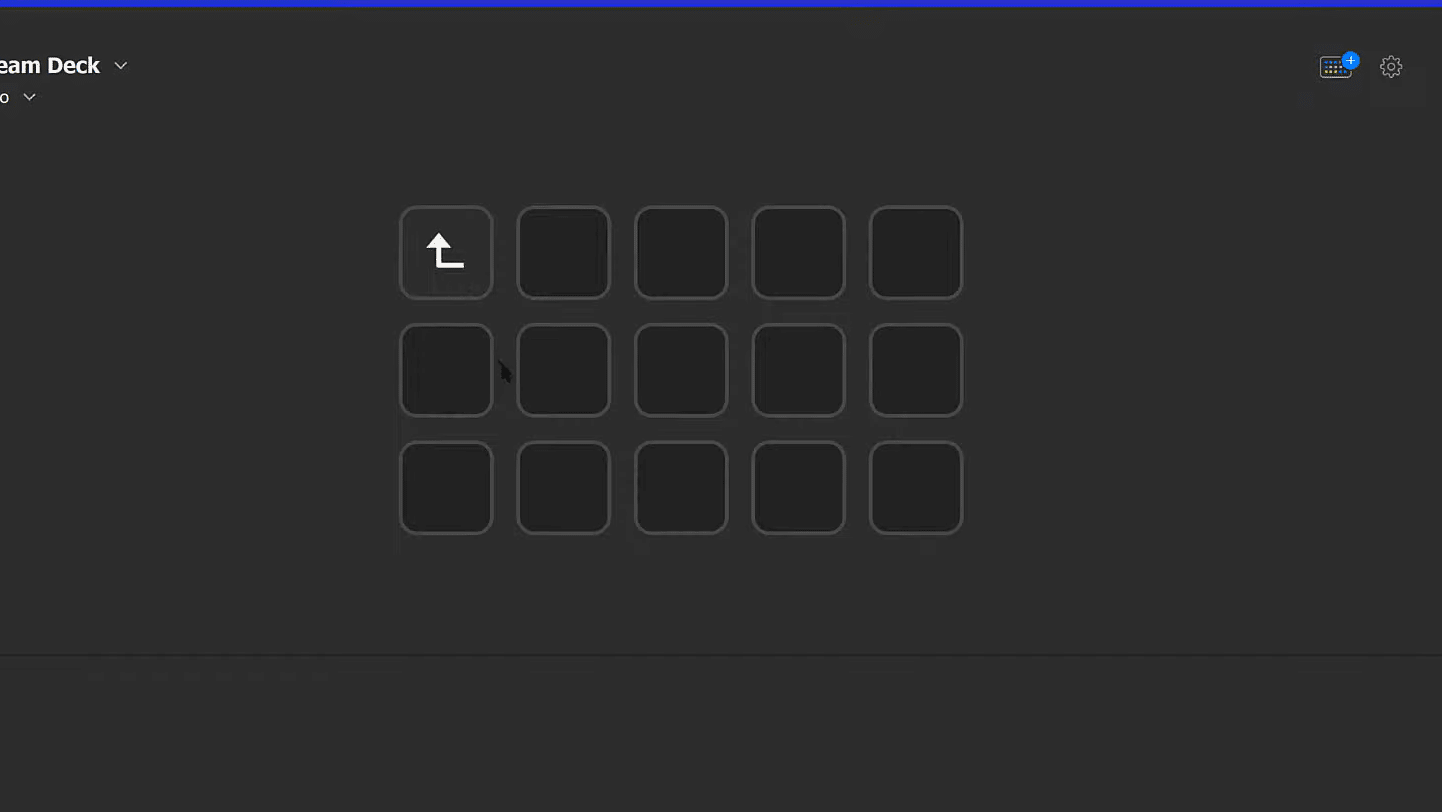
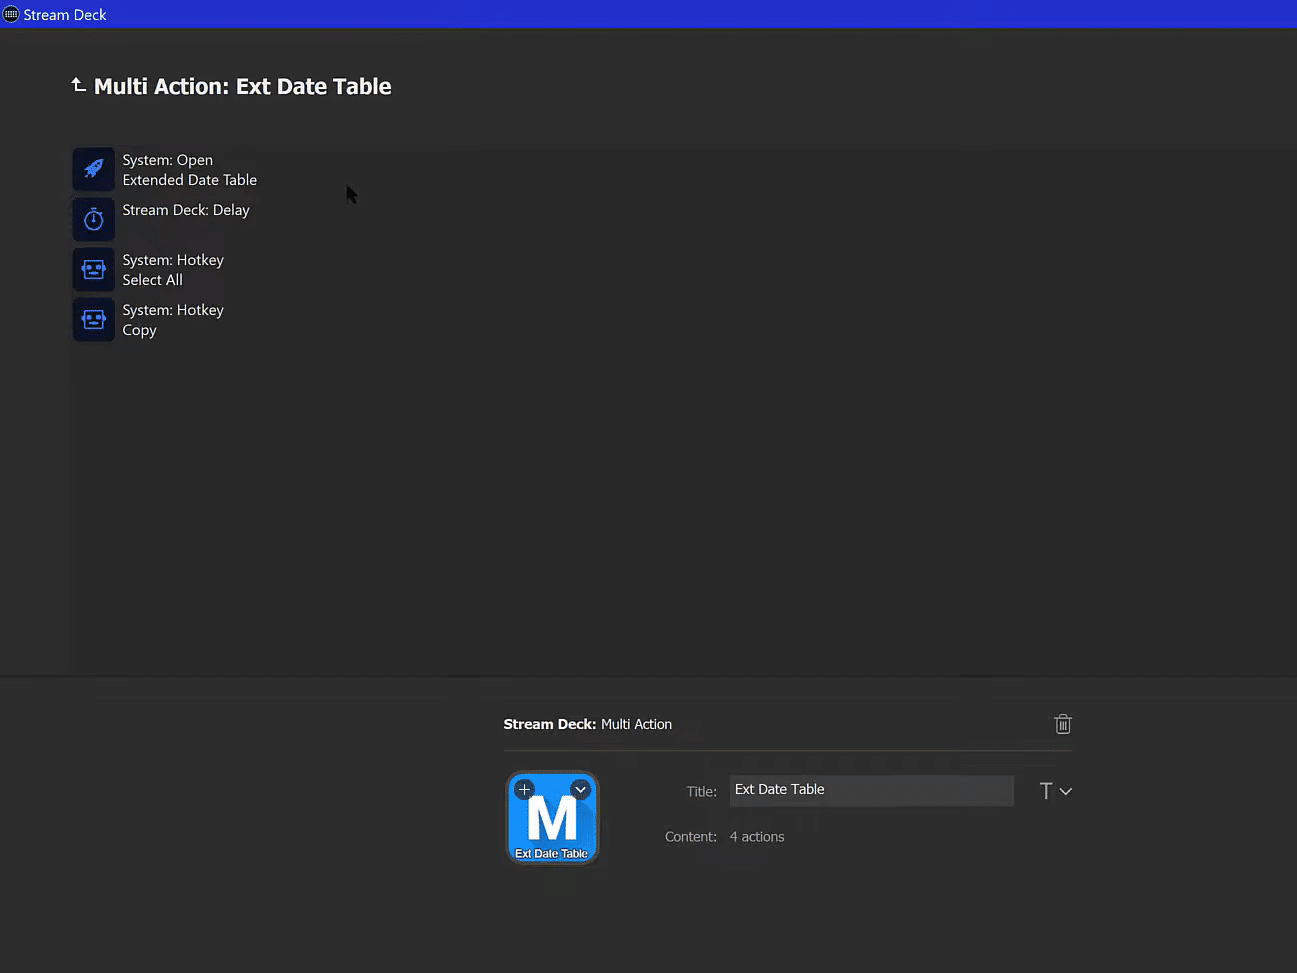
Next, I wanted to show you what’s called Multi Action. With Multi Action, you can string actions together into one cohesive button press. In this example, this is opening our Extended Date Table code. We can add a bit of a delay here and in this case, it’s 2000 milliseconds or 2 seconds. That is just so that it gives the computer a chance to open the file fully before executing the next command. So, it loads the text file, it then takes a slight delay, and then it takes a Hotkey action, which we just have Select All (control A) and a Hotkey Copy (control C).
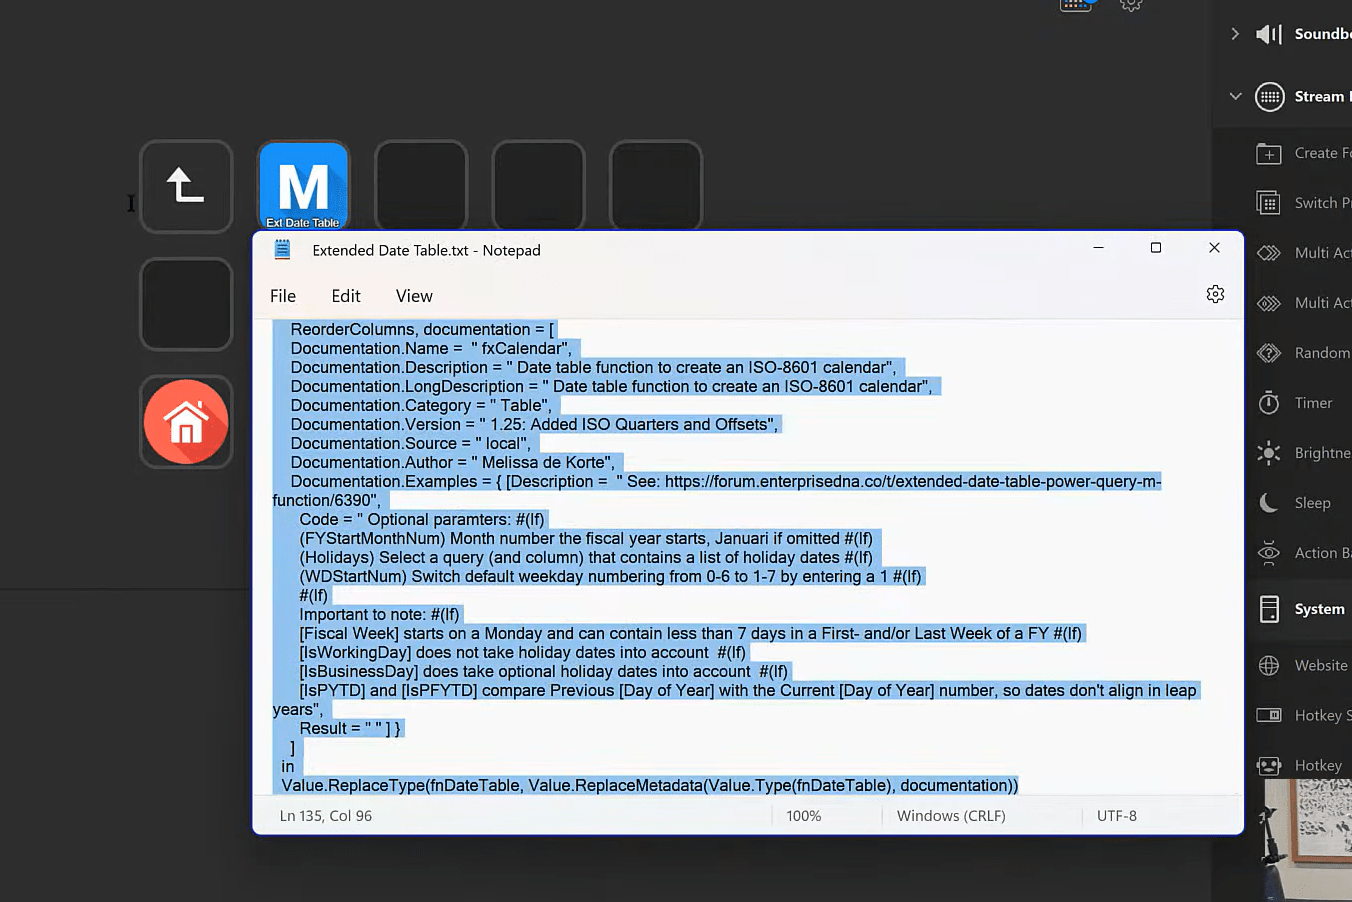
If we hit the Extended Date Table button, we’ll see the sequence in action. It pops open notepad, loads the Extended Date Table, selects everything, and then it copies it.
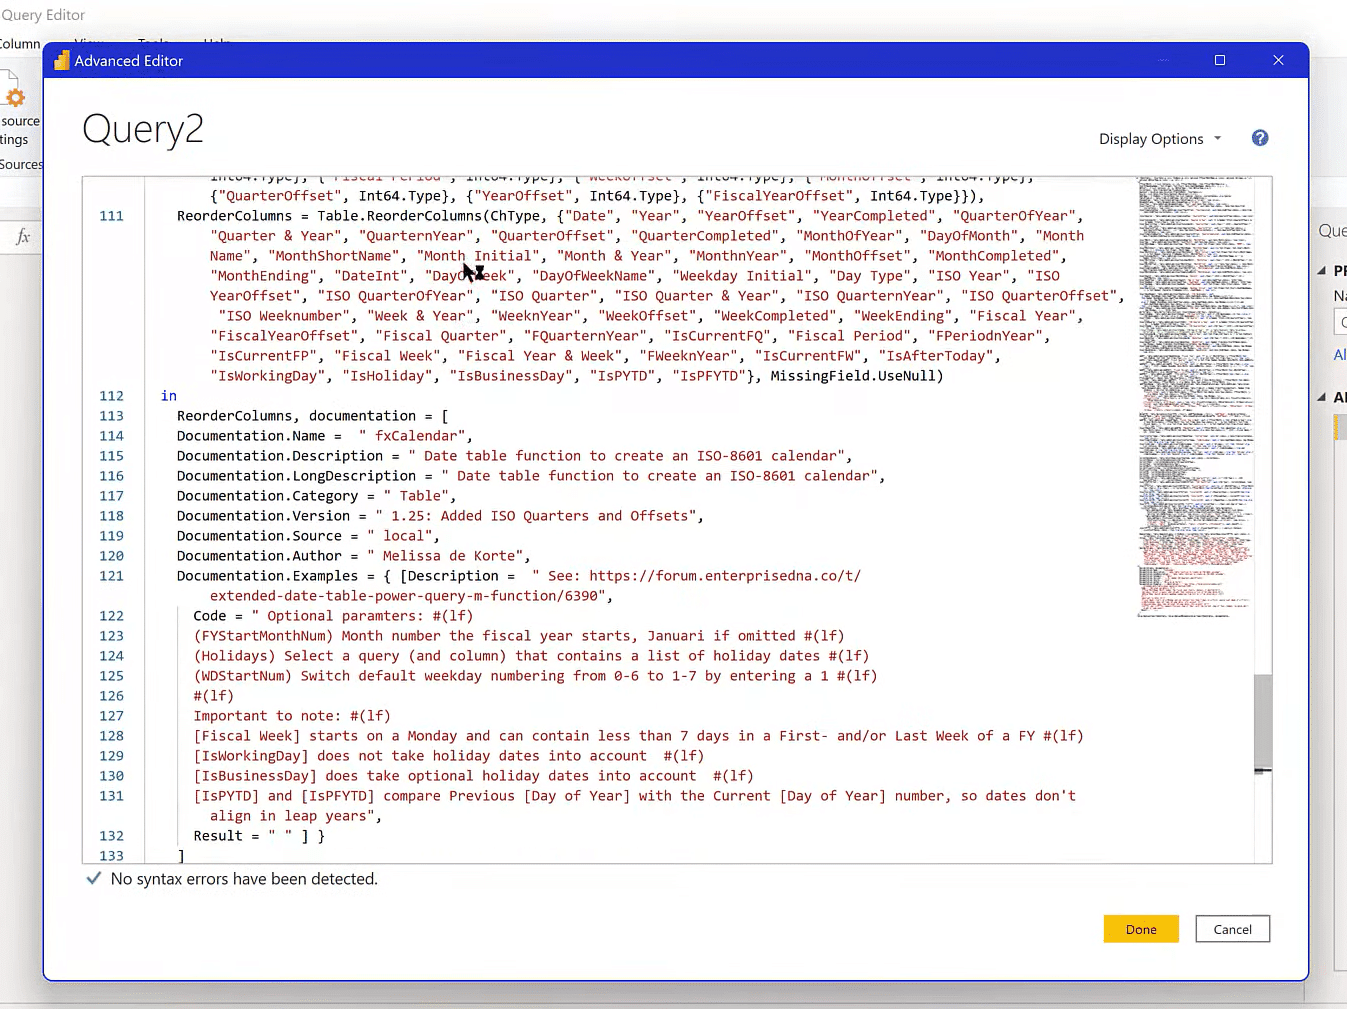
Now, if we go to Power Query and into the Advanced Editor, we can paste that in.
The next thing I’ll show you is plugins. There’s a whole series of plugins, which are worth looking through, but let’s look at SuperMacro. Install it and you can load it in.
SuperMacro is similar to Multi Action. It’s got keyboard commands and the scripting language around that. It has a tool called Mouse location that you can drop into your Stream Deck. It’s quite important if you’re going to be doing anything that involves simulating user actions. As I move the mouse around, it tells us what the X and Y coordinates are. There’s a function within SuperMacro that lets you place the cursor anywhere on the screen based on those mouse coordinates. If you hold it for a long press, it’ll copy those coordinates to the clipboard.
If we go to Power BI, we could trigger the External Tools using an open command. The problem with that is that if we were to open it directly, say open DAX Studio directly, we’re not going to have it load with the file. We want to simulate the user experience of going to the External Tools Menu.
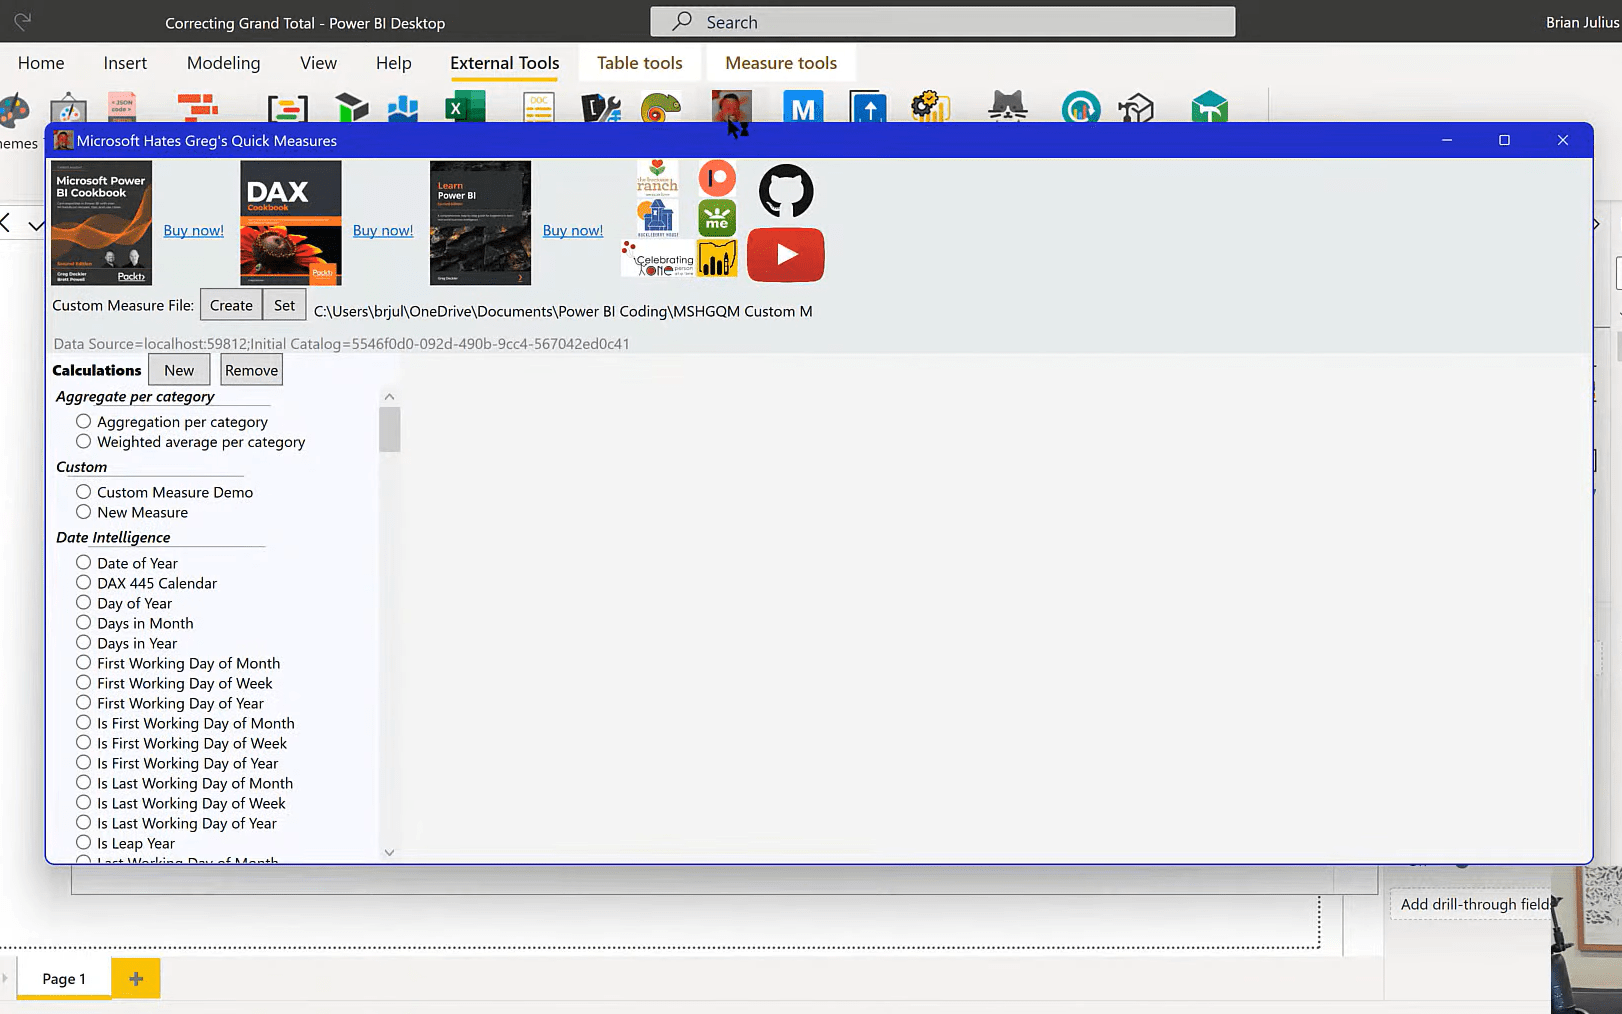
We can have that button programmed using SuperMacro. So, when we hit that button, it simulates the button press, and the mouse click and movement. We can simulate really any user action through this.
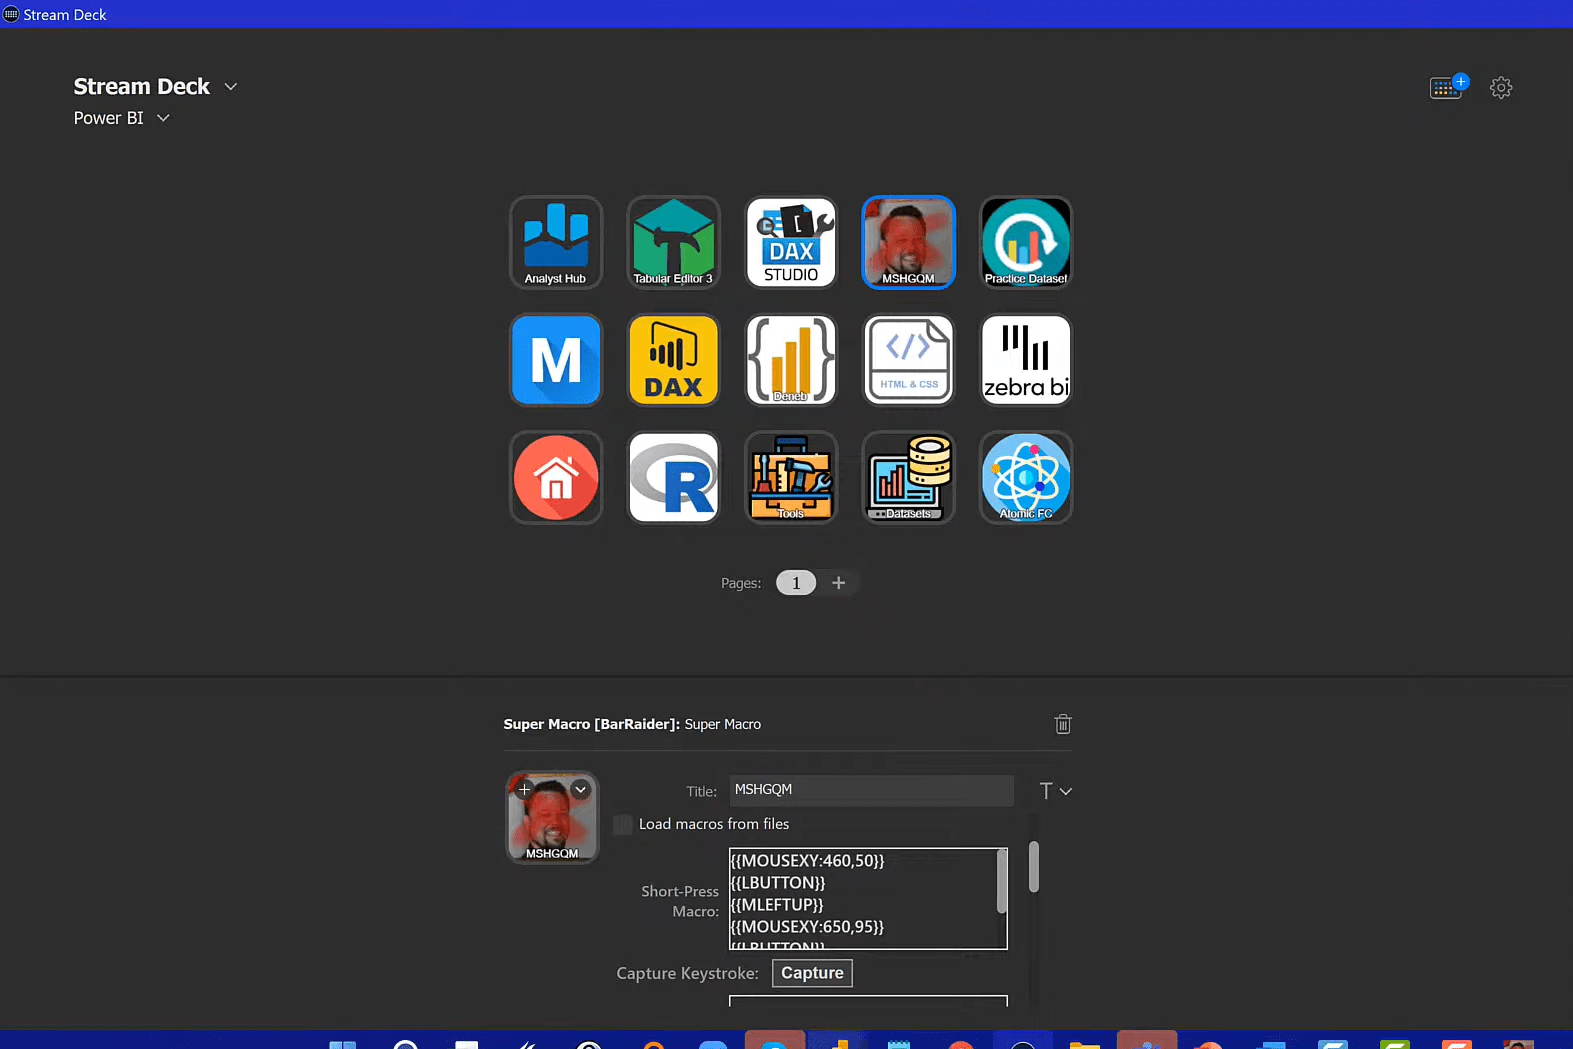
There’s a lot more you can do with this for Power BI automation. If SuperMacro doesn’t give you what you need, there’s another program called AutoHotkey. This is a super advanced scripting language open source. You can create AutoHotkey scripts and then just link those to your button using a Hotkey action. That is an open door to any type of scripting you want to do. You can trigger Power Automat flows, you can move Windows, you can grab Window Focus, etc.
***** Related Links *****
How To Create Automated & Dynamic Power BI Reports
How To Use Power Automate To Refresh Data In Power BI
Microsoft Power Automate: Workflow Automation
Conclusion
In this blog, you’ve learned how to use Elgato Stream Deck as a Power BI automation tool. You’ve learned about creating Elgato Stream Deck profiles, folders, buttons, and actions within those folders.
I think you’ll find that it’s pretty straightforward creating this. It can be a bit laborious, but once you get started, you’ll get the hang of it. Watch the full video of this tutorial for more details and check out the links below for more related content.
All the best!
Brian


