In this tutorial I want to show you some samples of Advanced DAX calculations in Power BI. After going through the basics, I’ll now demonstrate some advanced functions and formulas that are key to computing more complicated calculations.
I won’t cover every formula or function, but instead I’ll give you an overview of a few ideas so you can explore what DAX can do. You may watch the full video of this tutorial at the bottom of this blog.
Filtering Data By Date Using The Slicer
To start, I’m going to do a time comparison analysis on this sample data here.
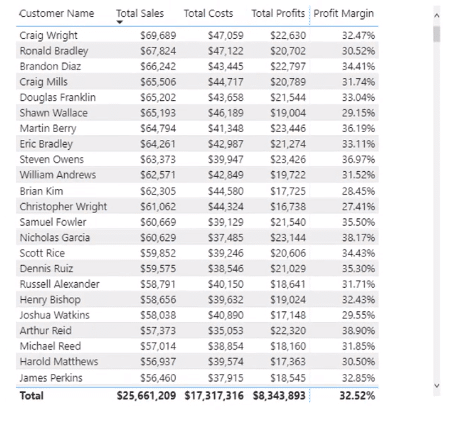
First, I’m going to bring in a filter for dates.
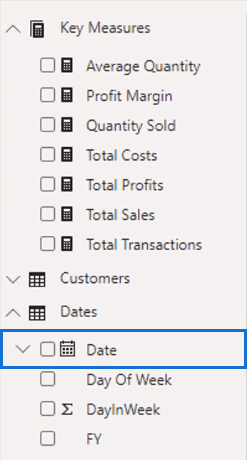
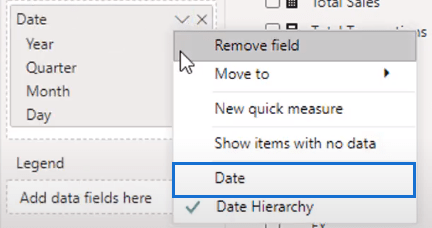
After that, I’ll select Date in the Field section to get rid of the hierarchy.
Then, I’m going to turn this into a slicer.
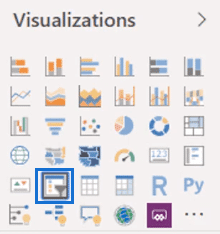
Once selected, the slicer will appear like this, enabling us to filter down to a different time zone.

Now you’ll see that the filtering is changing the results from our original data. So now, we’re looking at a smaller subset of information.
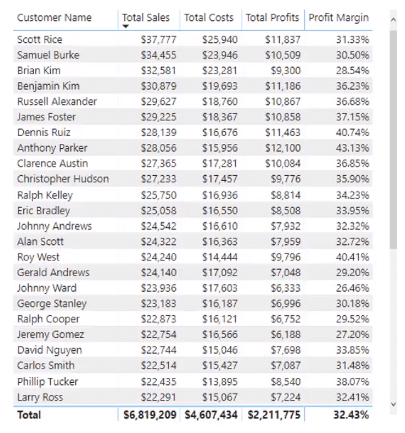
This is due to the changing context of these calculations because of the different time frame.
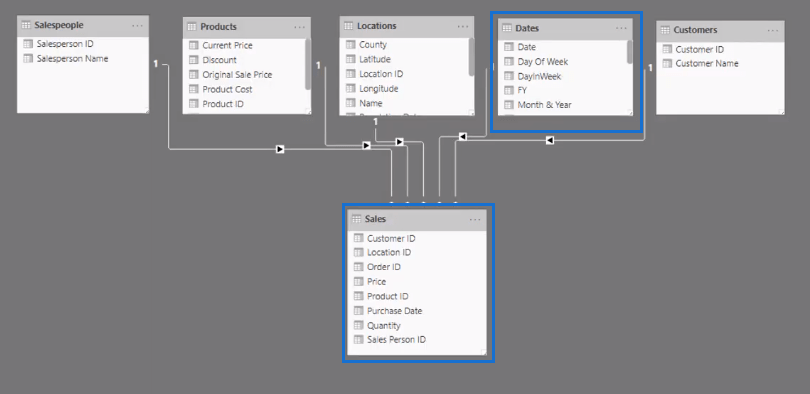
In the model, the time frame is being filtered in the Dates table and then it’s flowing down to the Sales table.
Next, I’m going to create a table of my dates with the hierarchy removed.
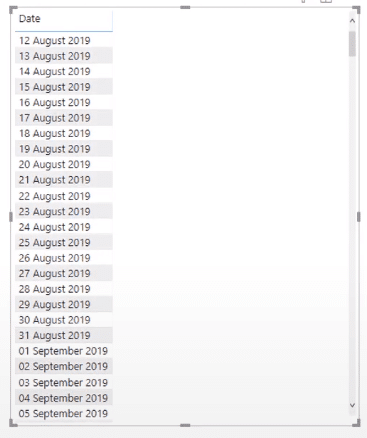
Another thing is that I don’t like this date format. So, I’ll change them by going over to the Tables area.
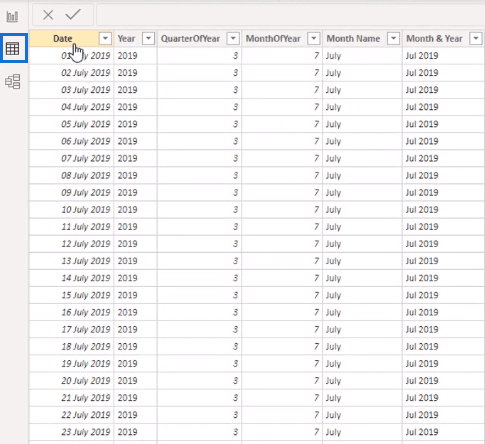
Then I’ll find my Dates table and highlight that column.
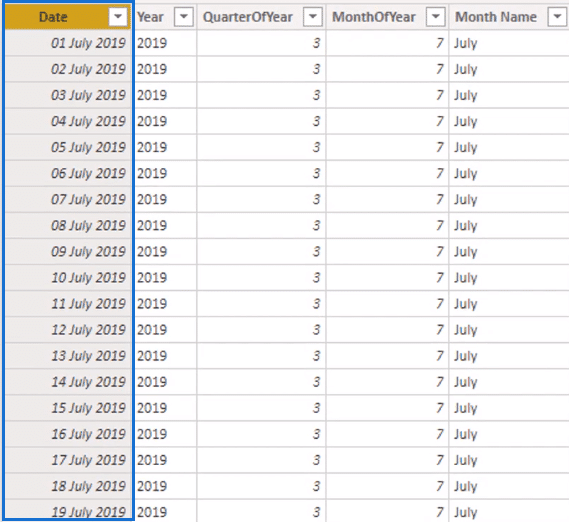
I’m going to change the format to date, month, and year. I know that in different areas of the world, the dates are in different orders but for this tutorial, I’ll use this format.
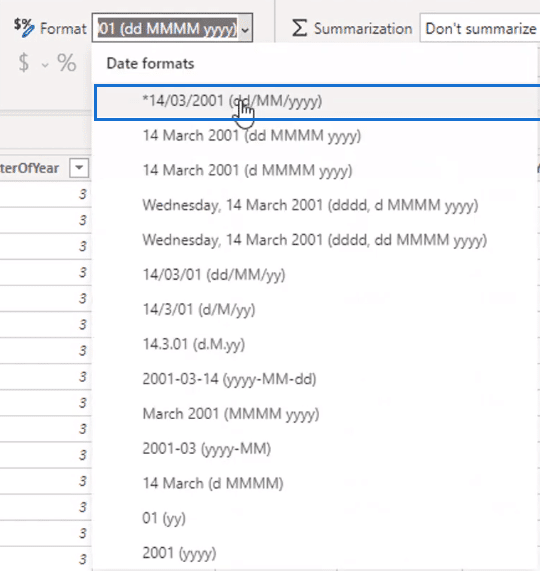
Now, my dates look like this because of the formatting adjustment I did and the filtering of the slicer.
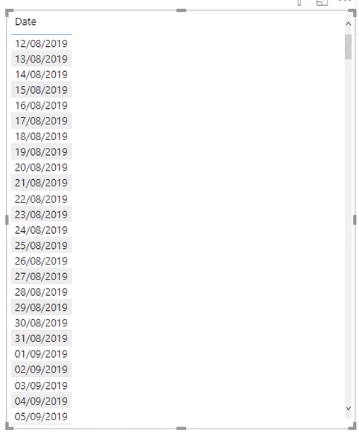
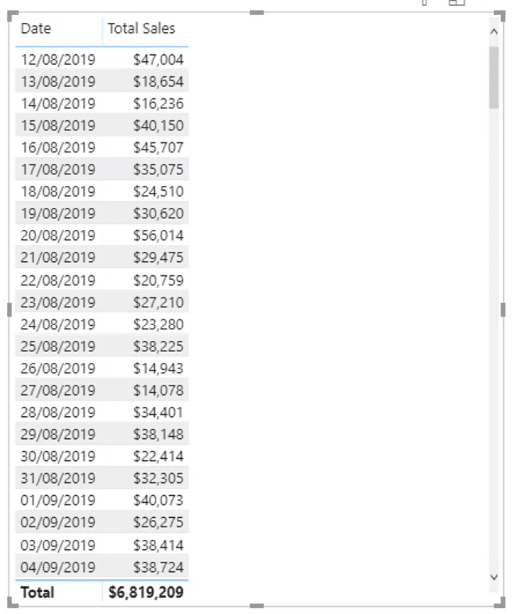
Next, I’m going to bring in my Total Sales. And now instead of seeing sales by customer, it’s showing sales by dates.
Time Comparison With Advanced DAX
Now I want to compare the data of the present date versus the data of the previous year.
To do this, I’m going to create a new measure called Sales LY for last year’s data and I’m going to use a function called CALCULATE.

CALCULATE enables me to change the context of the calculation.
CALCULATE is going to become your most used function in power BI and in the DAX formulas because it’s the start of any advanced analysis inside power BI.
Now, I’m going to input Total Sales.

I want to calculate my Total Sales, but I want to do it in a different context. So, I’ll use a function that enables me to change the filter.
For example, I can use a function called SAMEPERIODLASTYEAR and I can input the Dates column and enter the formula.

Now I can compare sales between this date and the same day last year, which is my current context. The context is derived from the function I used inside of CALCULATE.
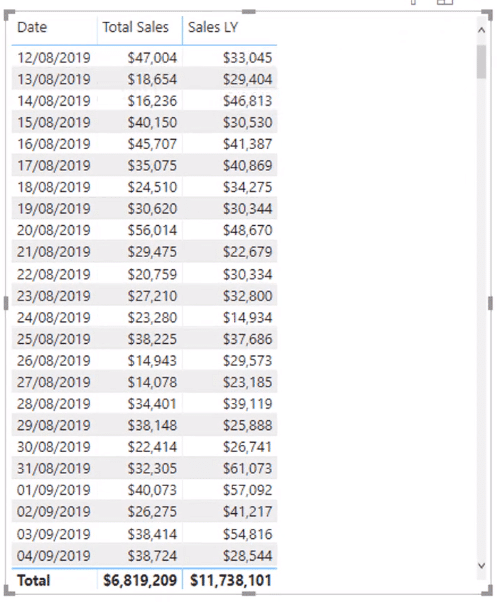
This is the first example of an Advanced DAX calculation.
Calculating Cumulative Total With Advanced DAX
Now, I’m going to show you another example of creating a Cumulative Total.
Cumulative Sales is calculated using this formula.

I’m going to use CALCULATE to compute for the Total Sales. But I want to do it in a different context.
So, I’ll use the functions FILTER and ALLSELECTED. Then I’m going to put the Dates table and below that, I’ll put the Date column as less than/equal to MAX Date.
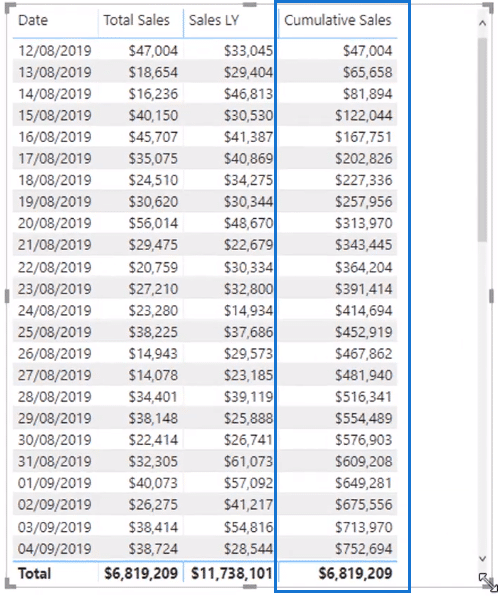
Now I have my Cumulative Sales.
This is what it looks like in a visualization.
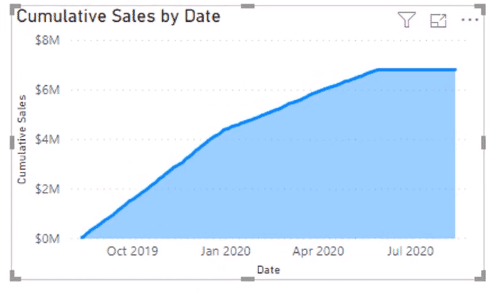
I can change the date context in the slicer and everything will update automatically for me.
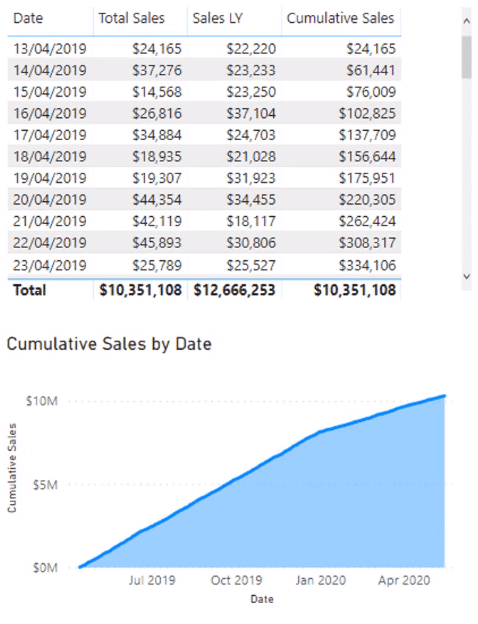
This is another example of measure branching. We’re branching into a cumulative subset of calculations.
What’s happening for each result in the Cumulative Sales is that the formula calculates the sum of the sales of the current day and every prior day.
That’s what this part of the formula is doing. It’s modifying the context of the calculation.

Advanced DAX calculations are dynamic. Not only do they change based on the date context but also, for instance, when I want to look at a specific customer.

It will then update all our formulas for that specific customer.
These formulas are built in a way that they are going to work seamlessly with the model that I’ve created. Additional filters can be layered on top of each other to create dynamic calculations.
Measure Groups In Advanced DAX
Measure branching is a big part of Advanced DAX calculations. So when we move away from key measures and move into more branches of measures, we can start creating new measure groups.
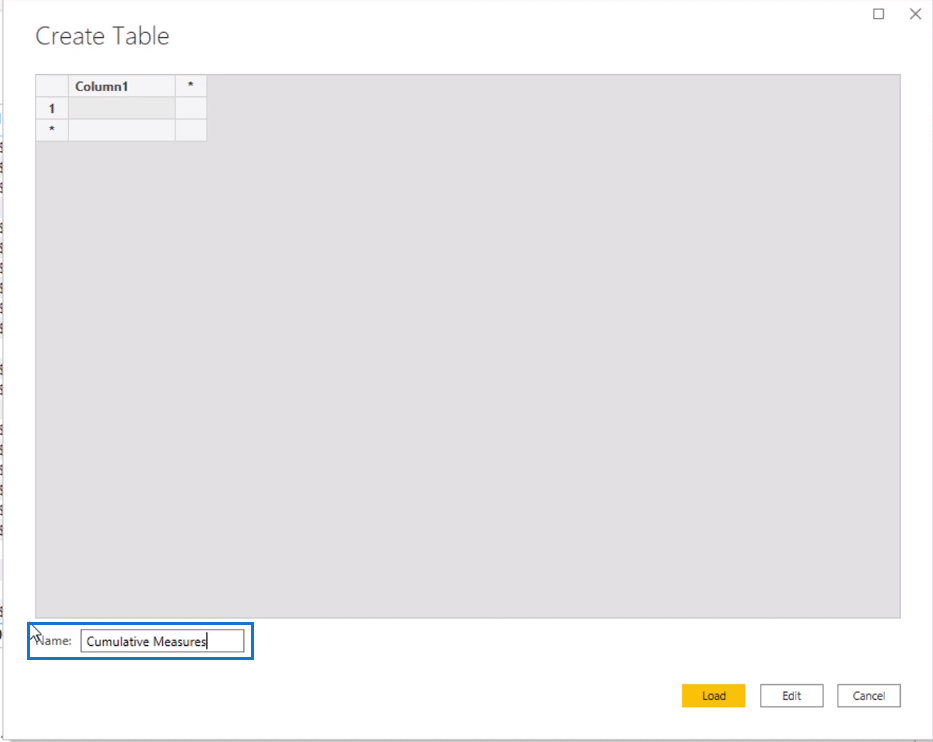
First, I’m going to click Enter Data.

I’ll call the new table Cumulative Measures.
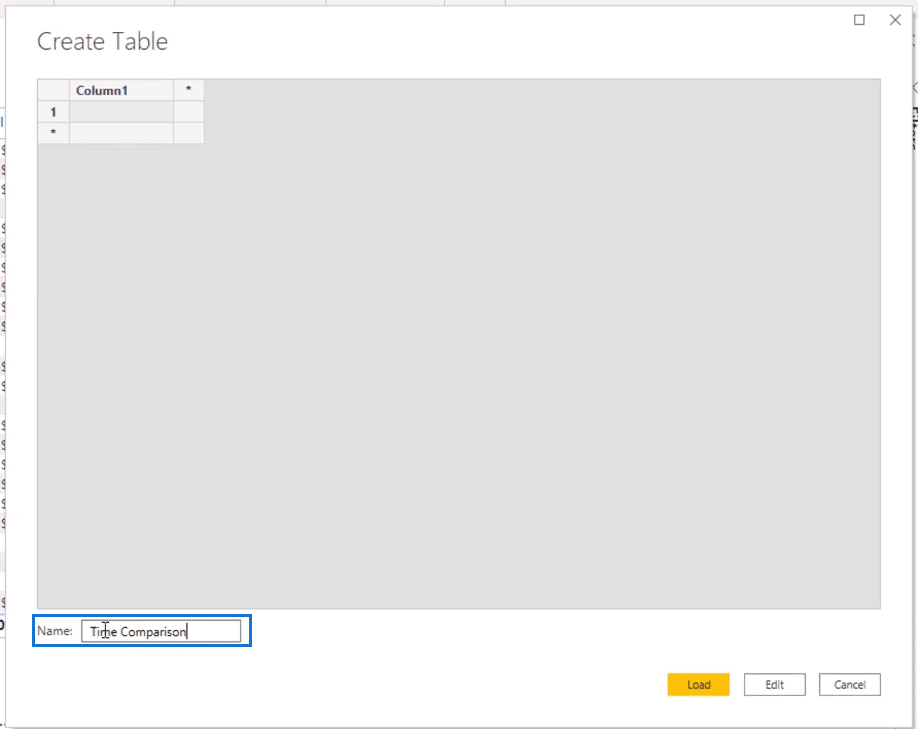
Then I’m going to create another one and call this one Time Comparison.
So these are now appearing in our field section. They’ll also appear here in our model.

Then all I need to do is move these in.
I’m going to transfer the Cumulative Sales into my Cumulative Measures.

I’ll also take Sales Last Year and move it into Time Comparison.

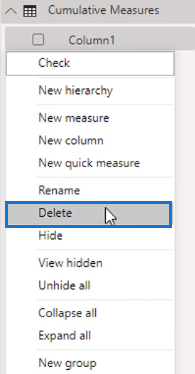
Then I’ll delete the unnecessary columns.
Now I have three measure groups that are easy to reference.
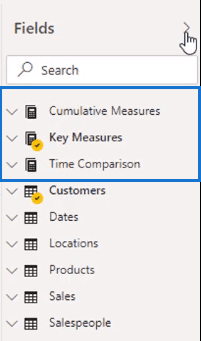
And this will grow because I can also measure branch our profits and profit margins. I only need to adjust the measures inside the CALCULATE function and get different results for each measure.
*****Related Links*****
Compare Multiple Metrics Cumulatively In Power BI Using Advanced DAX
New Customer Analysis Using Advanced DAX
Comparing Any Sale Versus The Last Sale (No Time Intelligence) – Advanced DAX In Power BI
Conclusion
I think I’ve covered enough from a beginners point of view. This is just the start of what Advanced DAX calculations are. I don’t want to get too technical and confuse you in this early stage of this beginner’s guide.
If you want to learn more, you can look at our DAX courses or content that we have available through Enterprise DNA.
All the best.
Sam
*****Learning Power BI?*****
FREE COURSE – Ultimate Beginners Guide To Power BI
FREE COURSE – Ultimate Beginners Guide To DAX
FREE – Power BI Resources
FREE – 60 Page DAX Reference Guide Download
Enterprise DNA Membership
Enterprise DNA Online
Enterprise DNA Events


