There are many occasions where you may bring data into Power BI and the data structure is not optimized for your data model. In this article, I’m going to work through when you should utilize the unpivot or pivot feature in the Query Editor within your data queries.
One thing to bear in mind early on when working on data inside of Power BI is you generally want it to be in an unpivoted format. This is the most optimized way a table can be set up for all of the DAX calculation logic that you will run over your raw data once it is integrated into your model inside of Power BI.
So you need to do a lot of work here in the Query Editor.
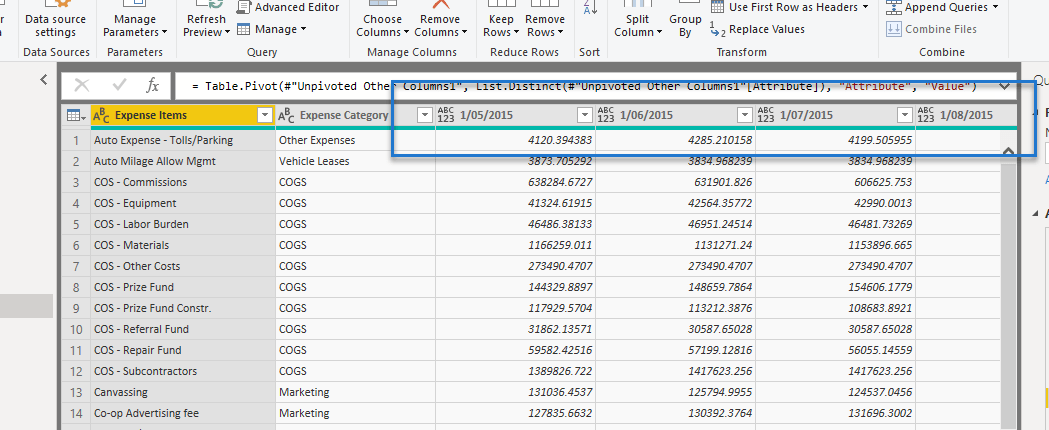
What we have here is an example of a table which is pivoted:

This contains raw data that is being brought into the query editor of Power BI. It is currently in a pivoted format where we have the dates across the top.
What we need here is for these dates to be unpivoted so all of the values, which are of a similar nature, are in one column. This way we can run simple aggregations like SUM or iterations like SUMX over these particular values.
This setup is the most optimized way that you can set up your tables in Power BI.
It is something that I really recommend you look to do on any occasion where you see pivoted data.
There’s a couple of ways to change this data to unpivoted. The easiest way to unpivot is to click the columns that you want to keep then right-click and select Unpivot Other Columns, as shown below.

You’ll see now that all of the values and the dates are retained in one column each. Then all you need to do is to change the particular column names to something more appropriate and intuitive.

You can also unpivot columns by going to the Transform tab of the Query Editor ribbon and then select Unpivot Columns.

If there is a rare occurrence where you want to pivot your data, then you can also do this quite easily in Power BI.
I’ll also show you below how you can pivot your data straight from the Query Editor ribbon.
I want to pivot the Attribute column, so I’m going to select the Attribute column first and then press Pivot Column in the ribbon.

Once I do that, a pop-up box will appear and I can select the values that I want to see within each new column. I’m selecting the column Value because I want to retain all of the amounts from my data in each new created column.

And then go to Advanced options dropdown and select the proper Aggregate Value Function. For this example, I don’t want any aggregation done, so I select Don’t Aggregate, and then click OK.

You will see now that it has pivoted my data back to the way it was. In theory, you wouldn’t have to actually do this because the data is already set up like that.
Just as an example here, I want to showcase how you can also pivot your raw data if this is the structure you need.

*****Related Links*****
My Practice Tips When Using The Power BI Advanced Editor
Power BI Query Parameters: Optimizing Tables
Build A Comprehensive Date Table In Power BI Really Fast
As mentioned earlier, you generally (95% of the time) want your data in an unpivoted format.
There may be some occasions where you might need to do a pivot as an intermediary step in your data transformation in the Query Editor, but from my experience, this is relatively rare.
This is a great technique and it is one that I use very frequently just because of the messiness of a lot of data in its rawest form.
Enjoy reviewing this one.
Sam


