Forecasting analysis in Power BI can be completed in quite an effective manner if you utilize the time intelligence functions in DAX effectively. In this example, I go through the many options you have available to automatically create a forecast in Power BI based on historical information. You may watch the full video of this tutorial at the bottom of this blog.
Your forecasts in a lot of cases will be derived from your historical results, so why not look at ways to just automatically generate them if you can. What isn’t probably sensible though is to just take a like for like replica of any previous year. You may want to smooth it somewhat to account for some seasonality in your datasets or maybe even some anomalies that may not occur again.
I’ll show you a number of techniques here that can be repeated easily across a number of datasets, so think of how you may apply this within your own environment.
Starting With The Core Measures
To create a forward forecast in Power BI, we need to use DAX formulas and do some measure branching. First of all, we have to start with our core measures, such as Total Sales and Total Costs, which are very simple measures.


We’re going to do our forecast on Profits, so we need to quickly whip up our profits calculation.

We can check the results by just creating a table of information or chat and see our Total Profit by Date.

To narrow down the time scope, we can put Quarter in calendar here and turn it into a slicer.

The actual data only actually runs until the end of 2016. So, if we go 2017, it doesn’t show anything, but we want to put something into 2017.
Creating Forward Projection Using SAMEPERIODLASTYEAR
In this case, we’re going to project what we had last year into the future, so we’ll create a Total Profits Forecast. We use CALCULATE in this formula because it’s the only way to change the context of the calculation. Then, we’ll put Total Profits, and go SAMEPERIODLASTYEAR with our Dates.

If we throw this into our table, we’ll see that we now have the same amount but actually for the same period last year. If we go down to the very last day in 2016, we have the total profits from the very last day in 2015.

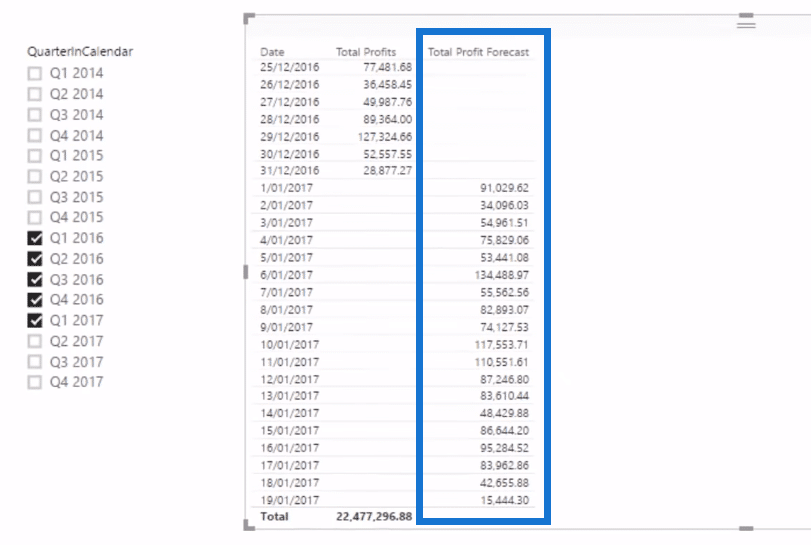
But if we go to 2017, we’re now getting some information into 2017. We’re projecting what happened the year before. We have a problem here though because we have a number from 2016 backwards, so we need to get rid of that number.

The way we can do that is go IF ISBLANK with Total Profits. There’s no Total Profits into the future because it’s only a historical number, so if it’s BLANK, we want to show the SAMEPERIODLASTYEAR calculation. If it’s not, we want to go BLANK.

And now Total Profits Forecast doesn’t show up here because it’s only a forward projection at the moment.

If we change this into a visualization, this is now a forward projection.

But if we look at this, it’s way too busy. We probably want to simplify our forecast into something like a moving average.
Working Out Moving Average Of Total Profits
In this case, we can actually create a moving average of our Total Profits.

I think a moving average is a fair way to at least capture some sort of seasonality. And so if we drag that into our chart, we now have this 30-day moving average.

We do have a slight issue here that we want to fix. We only want our profit by our moving average to go to the last day of 2016. To correct this, we’ll use the IF ISBLANK again and add it to our formula.

With this logic, we see that the line disappears from our forecast.

Moreover, instead of having our Profit Forecast as an everyday number, we’re going to turn it into a moving average. And so we’ll create a new measure for that.

With this formula, we can see that it’s now more normalized.

***** Related Links*****
Creating Forward Forecasts In Power BI Using DAX
Forecasting Technique: Exploring Forecasting Logic In Power BI Models
Predict Future Profitability Within Power BI DAX Functions
Conclusion
In this blog tutorial, I demonstrate a DAX technique specifically on creating a forward forecast in Power BI. In this example, I forecast profits.
Sometimes I do see some pretty complicated forecasting processes around, but I think what you’ll find is that this is such an easy and effective way to complete a comprehensive forecast in Power BI that can also be built upon, unique business factors and much more.
You can use these results as an initial baseline number and then adjust them where you feel it’s appropriate. It’s all about the business applications with this.
One quick fire way you could even extend this is by averaging multiple prior years data. I haven’t done that here, but I may well do that in the future to show you exactly what I mean.
All the best!
Sam
***** Learning Power BI? *****
FREE COURSE – Ultimate Beginners Guide To Power BI
FREE COURSE – Ultimate Beginners Guide To DAX
FREE – 60 Page DAX Reference Guide Download
FREE – Power BI Resources
Enterprise DNA Membership
Enterprise DNA Online
Enterprise DNA Events


