When utilizing SWITCH / True Logic inside Power BI, you really do open up this huge expanse of analytical opportunities. You may watch the full video of this tutorial at the bottom of this blog.
In this tutorial, I’ll run through how you need to set up your formulas when using the SWITCH function. This will enable you to find, discover, and visualize many different and interesting insights within Power BI.
There are so many different ways that you can utilize SWITCH in Power BI. It’s like a Nested IF statement that you would use in Excel but it’s much more powerful and cleaner.
This is why it’s essential to try and incorporate this into your models if there is an appropriate place to do so.
I’ll show you different ways that you can utilize the SWITCH statement. Once this settles in, you’ll immediately see many other places in your own reports and environments, where you can utilize the SWITCH statement.
Dynamic Report Created With SWITCH TRUE Logic
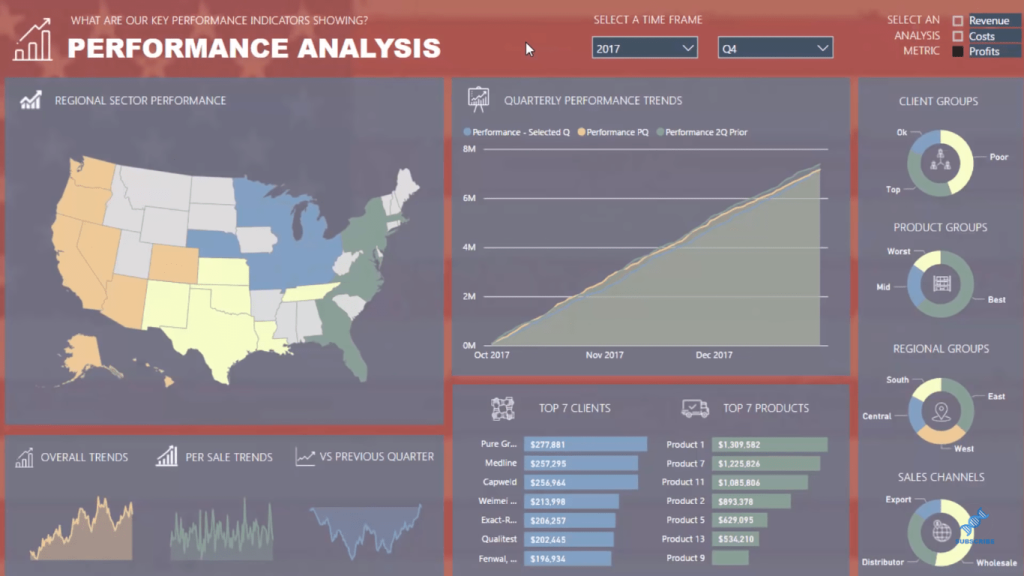
What we’re looking at here was part of the Enterprise DNA Webinar Series that I ran through around visualization techniques. If you want to see how I built this from scratch, utilizing a number of different techniques, check out the full workshop.

SWITCH True logic is one of the crucial techniques I used to create this dynamic report. In fact, it’s really the only way that you could create some of the elements and features of this particular report.
This entire report is entirely dynamic. You can select a particular metric then it returns results based on that selection. You can choose to highlight Revenue, Costs, or Profits.

How SWITCH TRUE Logic Works
The great thing about SWITCH True logic or statement is it’s just like Nested IF statement, which enables you to run through row by row in the formula.
You run through some calculations and evaluate them as true. If they’re true, they will return a result.
But this logic can return basically anything, not just a result. It enables you to return a measure, a value, or a text. You can also feed in a table function. There’s so much you can do with this logic. It’s a bit more advanced, but it enables you to combine lots of different formulas and quite complex Nested IF statements in a really effective way.
So in this case, what I used was SWITCH True to evaluate the rows. For example, if the metric selected over the slicer selection is Revenue then return this entire Total Sales measure.

So regardless of what sits in behind this Total Sales measure, it will calculate and return that particular result based on the context of Total Sales. The same goes with the next rows; Total Costs for Costs metric, and Total Profits for Profits metric.
If none of these metrics return something, then it’ll return Total Sales as the alternative result.

You could make that blank or anything you want to have as the alternative result if nothing equals to true in the different logic you put inside SWITCH.
***** Related Links *****
Data Visualization Technique In Power BI – Multi Measure Dynamic Visuals
Create An Entirely Dynamic Report In Power BI – Advanced Visualization Technique
What Is Measure Branching? – Power BI Development Strategy
Conclusion
SWITCH function in Power BI is a really versatile and flexible function that has many great applications within any report that you might be developing. You can utilize it in different situations and with different formulas, such as CALCULATE statement and iterating functions.
I wish you all the best in learning and implementing this in your own reports and dashboards.
Good luck diving into this video tutorial!
Sam
[youtube https://www.youtube.com/watch?v=UsAJPIANAb8?rel=0&w=784&h=441]


