
Are you looking to calculate a percentile in Excel?
Well, you’re in the right place.
To calculate a percentile in Excel, you can use the PERCENTILE.INC function for inclusive calculations or PERCENTILE.EXC for exclusive calculations. The syntax is PERCENTILE.INC(array, k) or PERCENTILE.EXC(array, k), where array is the range of data and k is the percentile you want to calculate, expressed as a decimal between 0 and 1 (e.g., 0.25 for the 25th percentile). Simply enter the formula in a cell with your specified array and k-value to get the percentile.

This article will cover everything you need to know about calculating percentiles in Excel.
We’ll provide you with step-by-step instructions and examples to help you apply this valuable statistical measure to your data.
Let’s get started!

What is a Percentile?
Before we jump into implementations, let’s quickly review the basics of percentiles.
A percentile is a measure used in statistics to indicate the value below which a given percentage of observations in a group of observations falls.
For example, the 20th percentile is the value below which 20% of the observations may be found.

It’s a way of expressing the relative standing of a value within a dataset. Percentiles are commonly used to understand and interpret data, compare scores or measurements across different populations, or determine cutoff points.
The 50th percentile is the median, marking the middle of a dataset where half the observations are below and half are above it.
4 Methods to Calculate Percentile in Excel
In this section, we will go over 4 methods of calculating percentile in Excel.
They are:
Using the PERCENTILE, PERCENTILE.INC, and PERCENTILE.EXC Functions
Using the QUARTILE, QUARTILE.INC, and QUARTILE.EXC Functions
Using the RANK and COUNT Functions
Using Data Analysis ToolPak
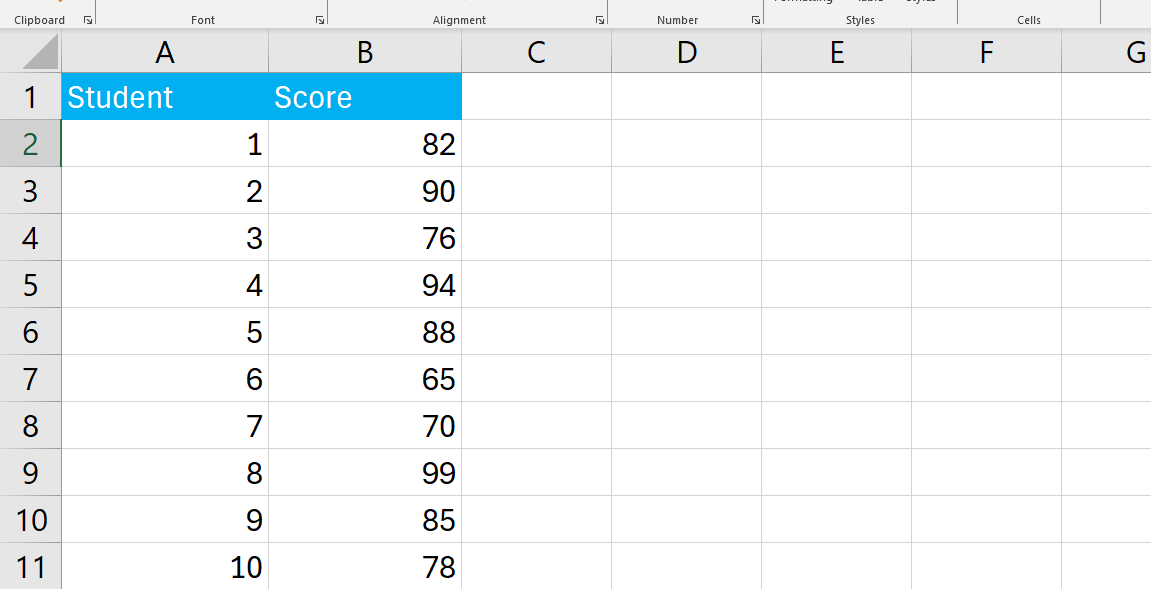
For the demonstration of the above methods, we will use the following dataset:
Method 1: How to Calculate Percentile Using PERCENTILE, PERCENTILE.INC, and PERCENTILE.EXC Functions
The PERCENTILE, PERCENTILE.INC, and PERCENTILE.EXC functions in Excel are statistical functions used to calculate the k-th percentile of a data set, where “k” is a decimal value between 0 and 1 representing the desired percentile.
Using PERCENTILE Function
The PERCENTILE function calculates the k-th percentile of a data set in Excel versions prior to 2010. This function includes the entire range of data, from the minimum to the maximum value.
The syntax of PERCENTILE function is:
PERCENTILE(array, k)Here, array is the range of data you want to analyze. k is the percentile value you’re interested in, expressed as a decimal between 0 and 1.
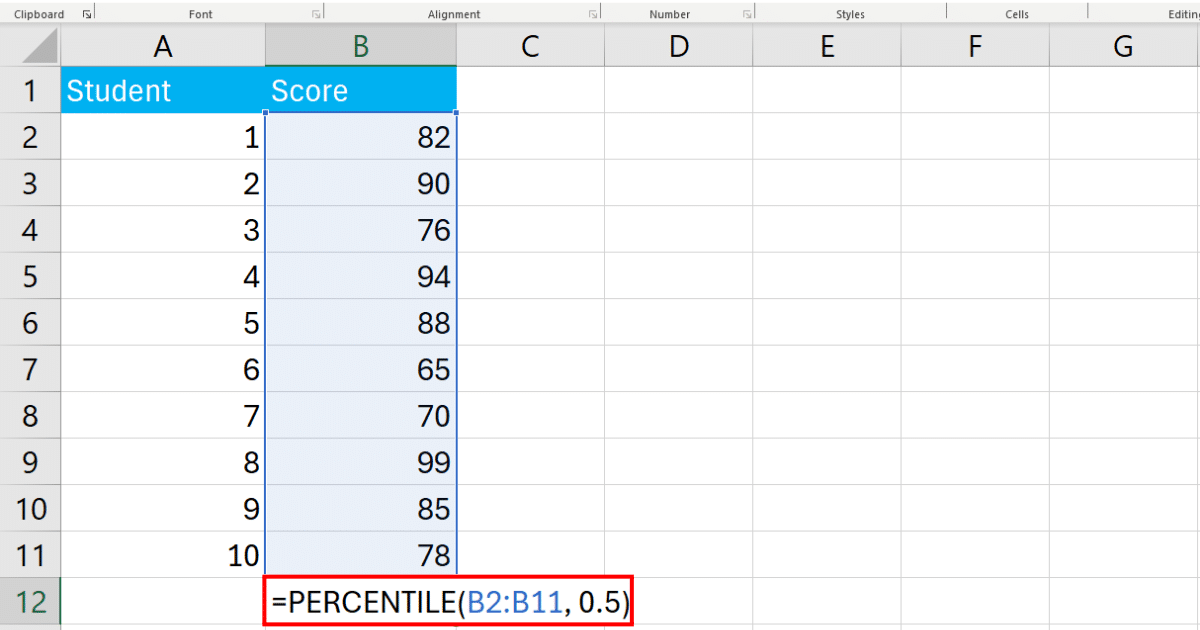
For example, to calculate the 50th percentile (median) of scores in cells B2 through B11, you would use:
=PERCENTILE(A2:A11, 0.5)In Excel, the formula looks like the following:
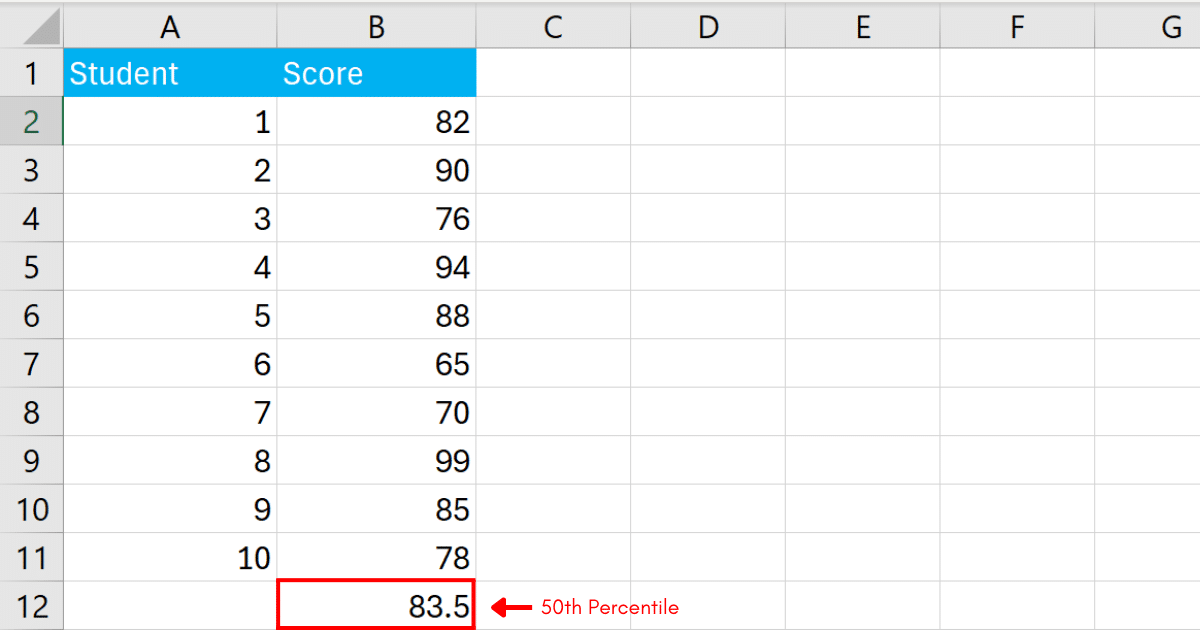
Press Enter and Excel will display the percentile.
Using Percentile.INC Function
The PERCENTILE.INC function, recommended for Excel 2010 and later, calculates the k values percentile of a data set, including the minimum and maximum values.
It’s inclusive, hence the INC in its name.
The syntax is:

PERCENTILE.INC(array, k)This function is useful when you want to ensure that the calculation includes the full range of data.
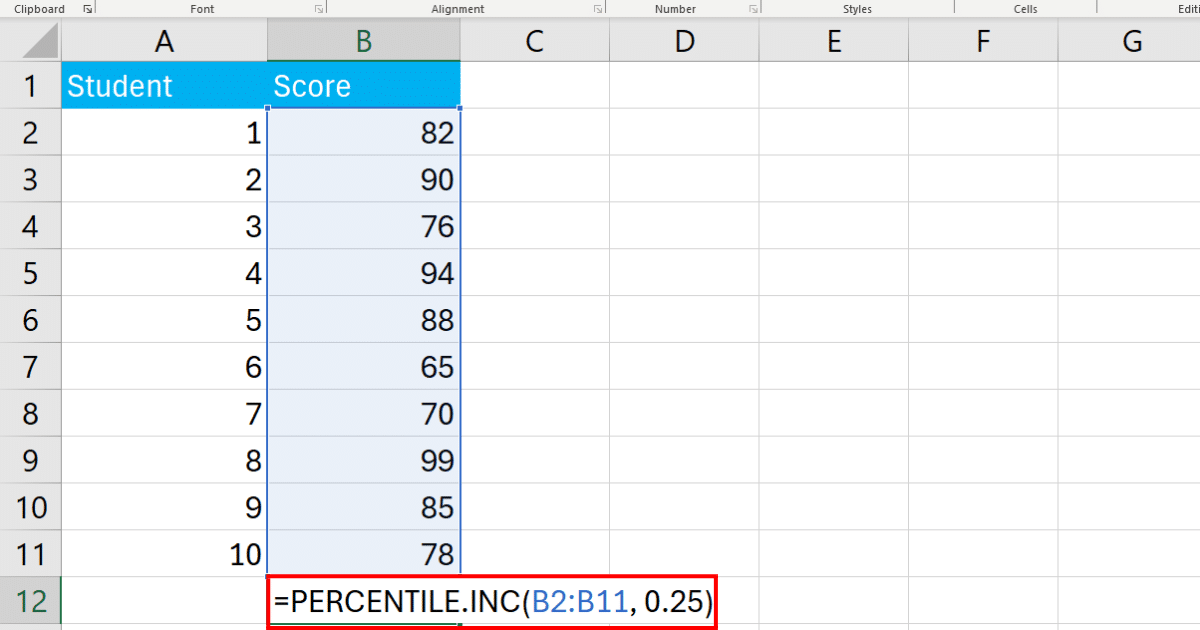
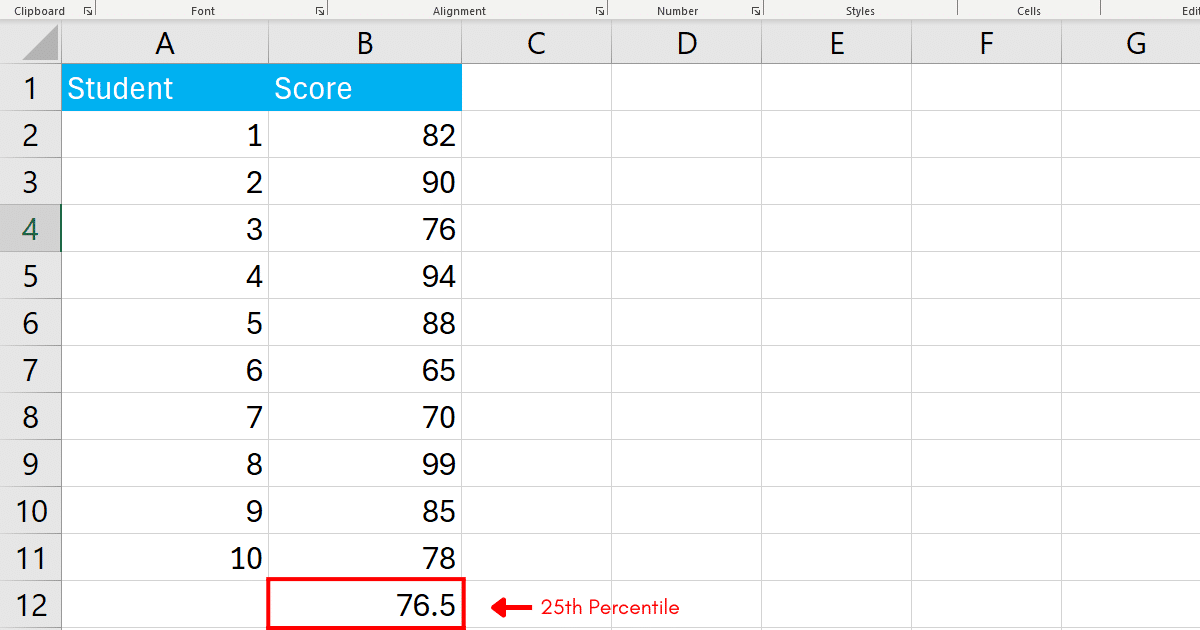
To calculate the 25th percentile of the same range of scores:
=PERCENTILE.INC(B2:B11, 0.25)In Excel, the formula looks like the following:
Press Enter and the Excel spreadsheet will display the percentile.
Using Percentile.EXC Function
The PERCENTILE.EXC function is also for Excel 2010 and later versions but calculates the k-th percentile of a data set excluding the minimum and maximum values, making it “exclusive.”
This can be useful for datasets where the extremes are outliers or otherwise unrepresentative of the dataset as a whole.
The syntax is:
PERCENTILE.EXC(array, k)Because it excludes the highest and lowest values, PERCENTILE.EXC is not defined for the 0th or 100th percentiles (k = 0 or k = 1) and will return an error for these values.
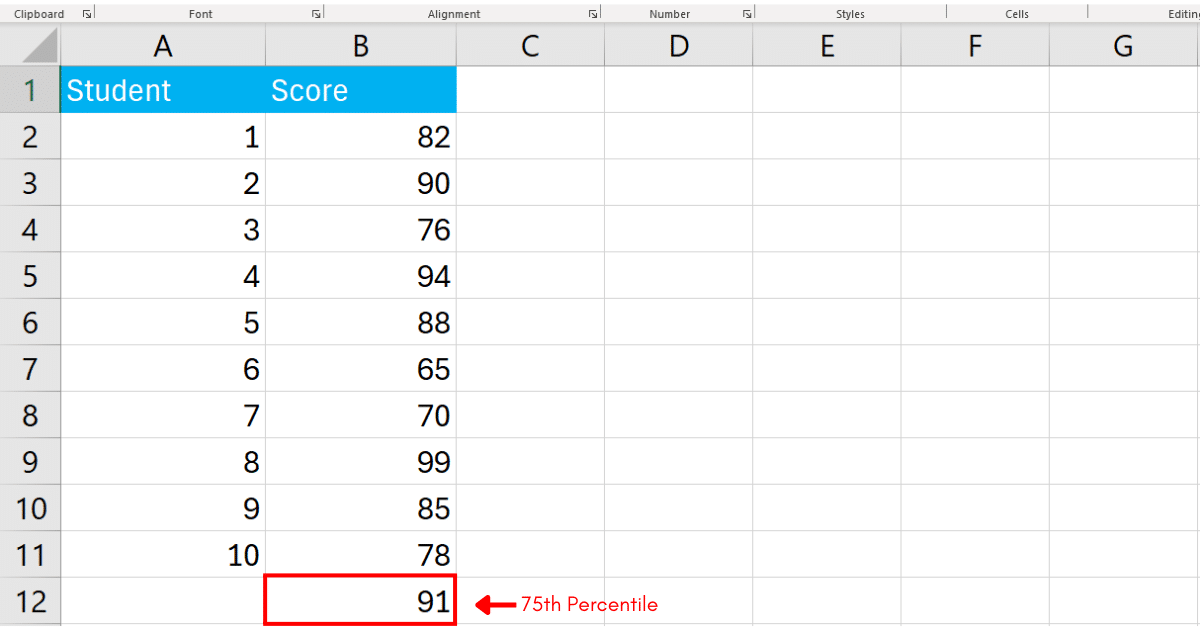
To calculate the 75th percentile without considering the extreme values in the dataset:
=PERCENTILE.EXC(B2:B11, 0.75)In Excel, the formula looks like the following:
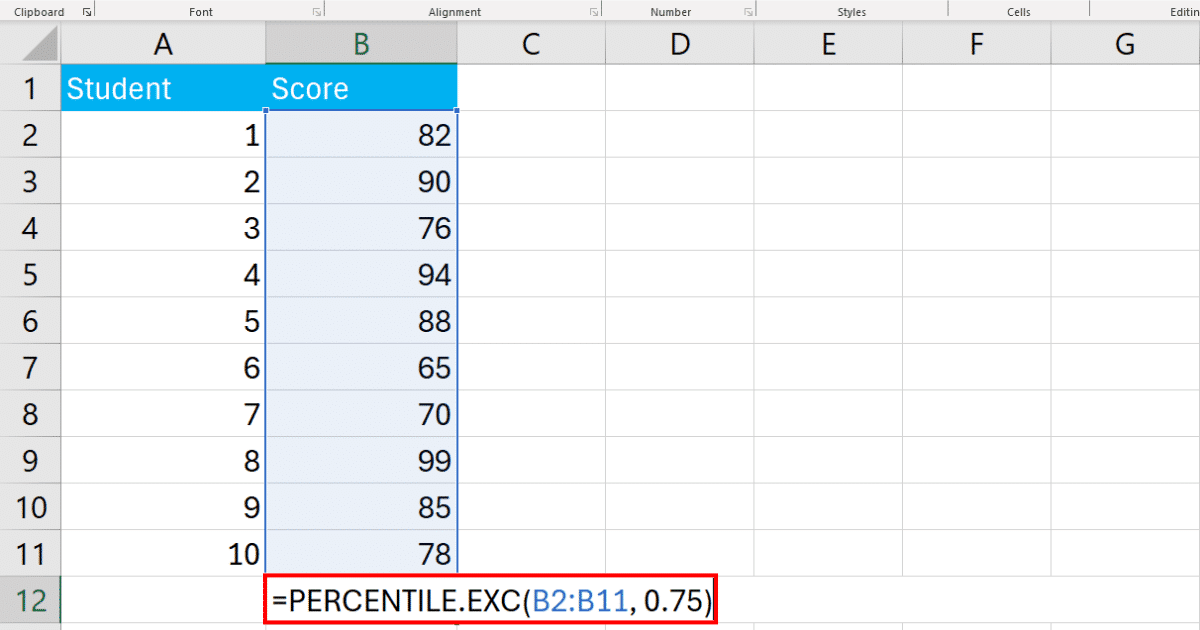
Press Enter and Excel will display the result for the supplied value.
Method 2: How to Calculate Percentile Using The QUARTILE, QUARTILE.INC, and QUARTILE.EXC Functions
You can also use the QUARTILE, QUARTILE.INC, and QUARTILE.EXC functions to calculate percentile in Excel.
Quartiles are a specific type of percentile that divide a dataset into four equal parts. They are essentially the 25th, 50th, and 75th percentiles.
Using The QUARTILE Function
The QUARTILE function is available in older versions of Excel and calculates the quartile of a data set.
It has been replaced in newer versions by QUARTILE.INC and QUARTILE.EXC, but it’s still available for compatibility purposes.
The syntax is:
QUARTILE(array, quart)Here, array is the range of data you want to analyze. quart is the quartile you want to calculate (0 for the minimum value, 1 for Q1, 2 for Q2, 3 for Q3, and 4 for the maximum value).
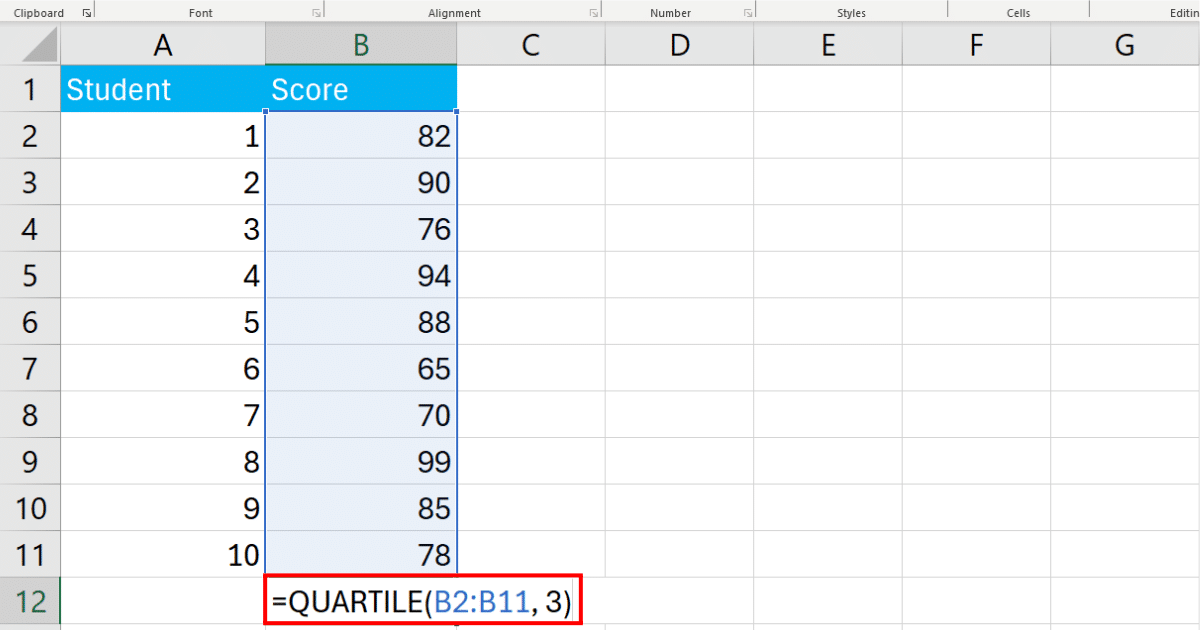
For example, to find the third quartile (Q3) of scores in cells B2 through B11:
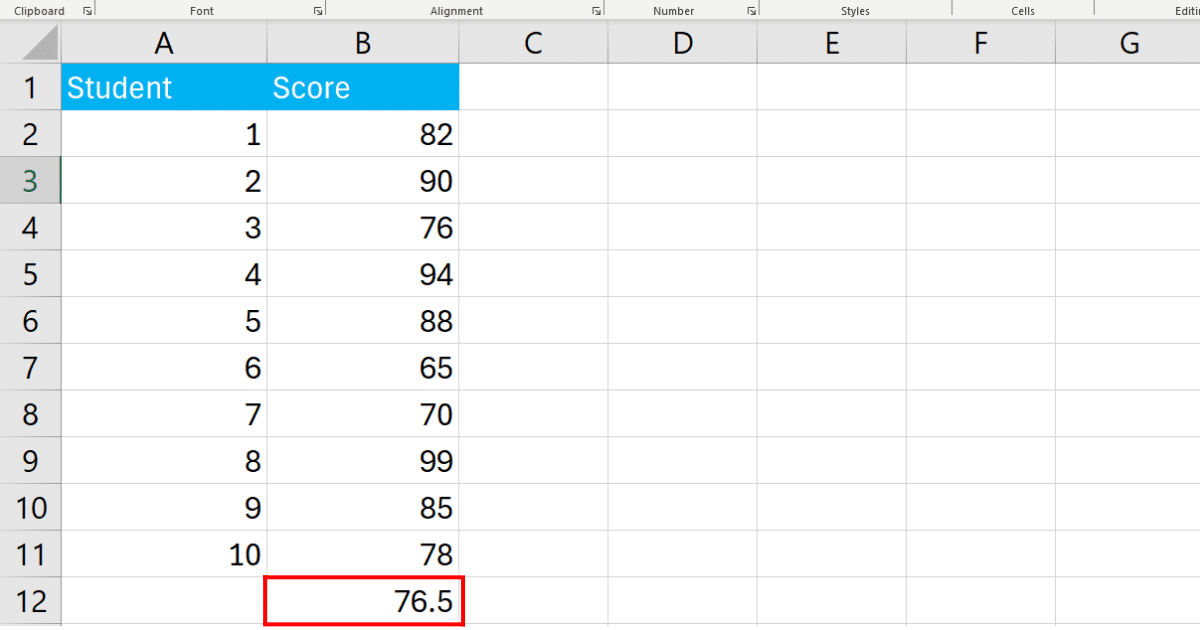
=QUARTILE(B2:B11, 3)In Excel, the formula looks like the following:

Press Enter and Excel will display the percentile.

Using The QUARTILE.INC Function
The QUARTILE.INC function calculates quartiles of a data set, including the minimum and maximum values in the calculation (hence “INC” for inclusive).
It is recommended for use in Excel 2010 and later versions.
The syntax is:
QUARTILE.INC(array, quart)This function is useful for a comprehensive analysis that includes the full range of data values.
To calculate the first quartile (Q1) of the same range of scores:
=QUARTILE.INC(B2:B11, 1)In Excel, the formula will look like the following:
Press Enter and Excel will display the percentile.
Using QUARTILE.EXC Function
The QUARTILE.EXC function calculates the quartiles of a data set but excludes the minimum and maximum values from the calculation, making it “exclusive.”
This approach can be useful for focusing on the central distribution of the data, excluding outliers.
The syntax is:
QUARTILE.EXC(array, quart)Note that because it excludes the extremes, QUARTILE.EXC does not compute values for the 0th and 4th quartiles (these would return an error).
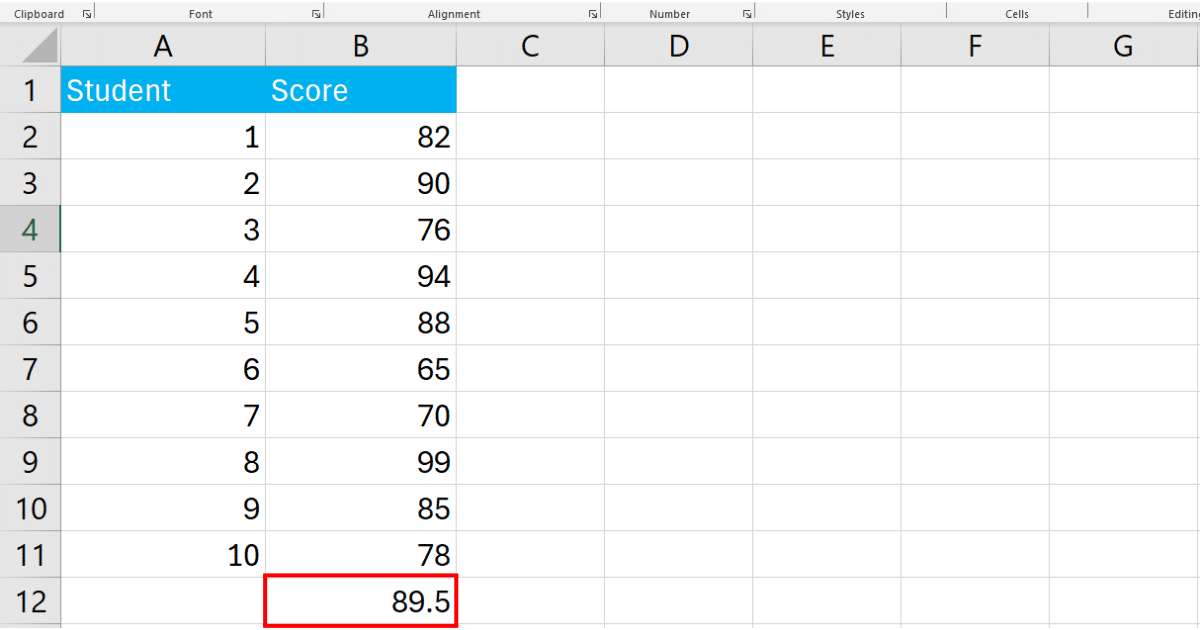
To calculate the median (Q2) without considering the extreme values in the dataset:
=QUARTILE.EXC(B2:B11, 2)In Excel, the formula looks like the following:
Press Enter and Excel will display the percentile.
Method 3: How to Calculate Percentile Using the RANK and COUNT Functions
A manual approach to calculate percentile is to use the RANK and COUNT functions.
It allows you to have more control over the calculation process or when working in versions of Excel that lack specific percentile functions.
Follow the steps below to calculate the percentile using this method:
Step 1: Determine Rank of Each Value
The RANK function, also known as RANK.EQ in newer versions of Excel, returns the rank of a number in a list of numbers.
Its syntax is:
RANK(number, ref, [order])Here, number is the value you want to find the rank for. ref is the array or range of data you’re ranking within. [order] is optional; if 0 or omitted, the function ranks numbers in descending order. If 1, it ranks in ascending order.
In cell C2, enter the following formula:
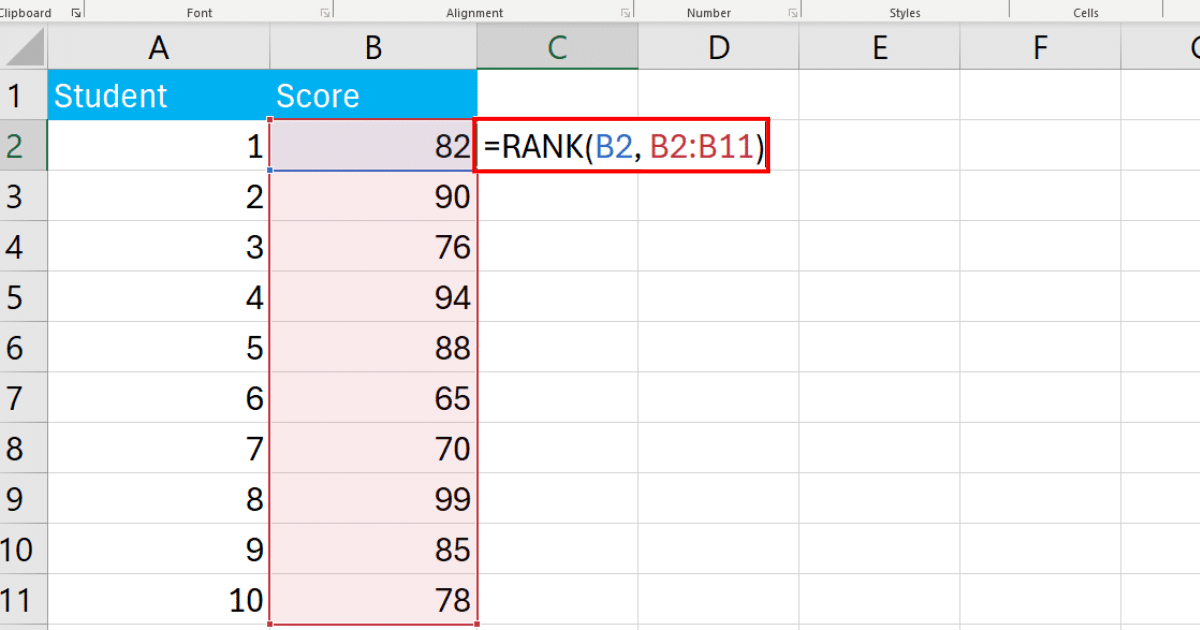
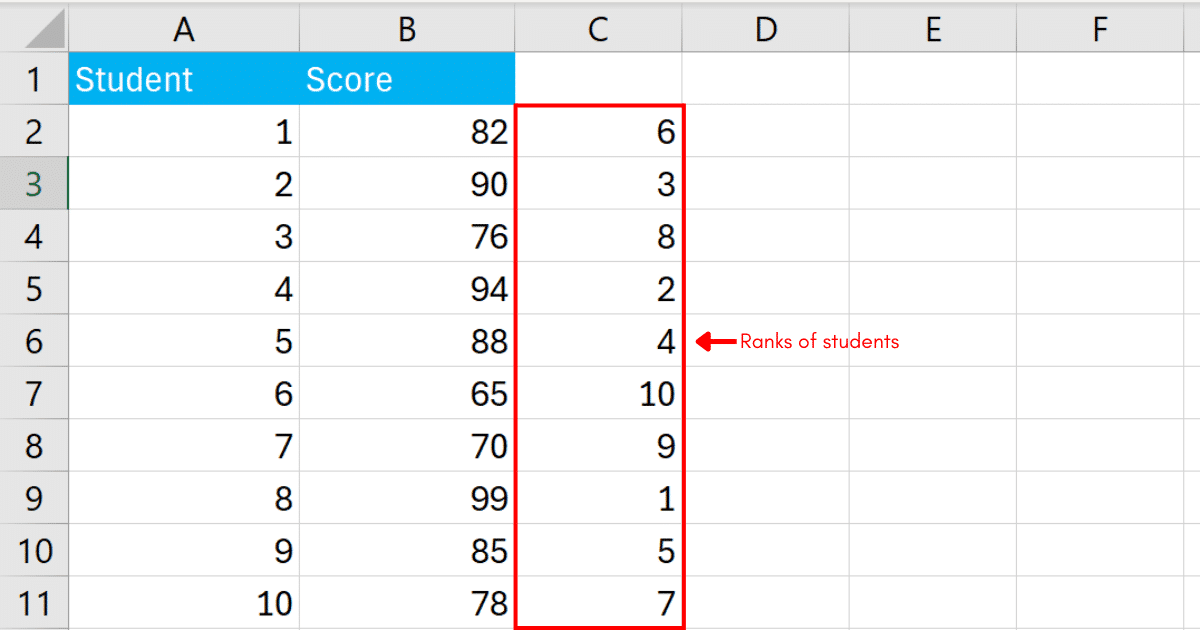
Press Enter and Excel will find the rank of the first student. Use the fill handle to apply the formula to the rest of the column as well.
The output will be:
Step 2: Calculate The Total Count of Values
The COUNT function counts the number of cells that contain numbers within a range.
Its syntax is:
COUNT(value1, [value2], ...)value1, [value2], etc., are the cells or ranges you want to count.
Once you have the rank of a value and the total count of values, you can calculate the percentile of a specific value using the formula:
=(RANK - 1) / COUNT * 100In Excel, the formula looks like the following:
Press Enter and Excel will calculate the percentile. Use the fill handle to apply the formula to the rest of the column as well.
The final result will be:
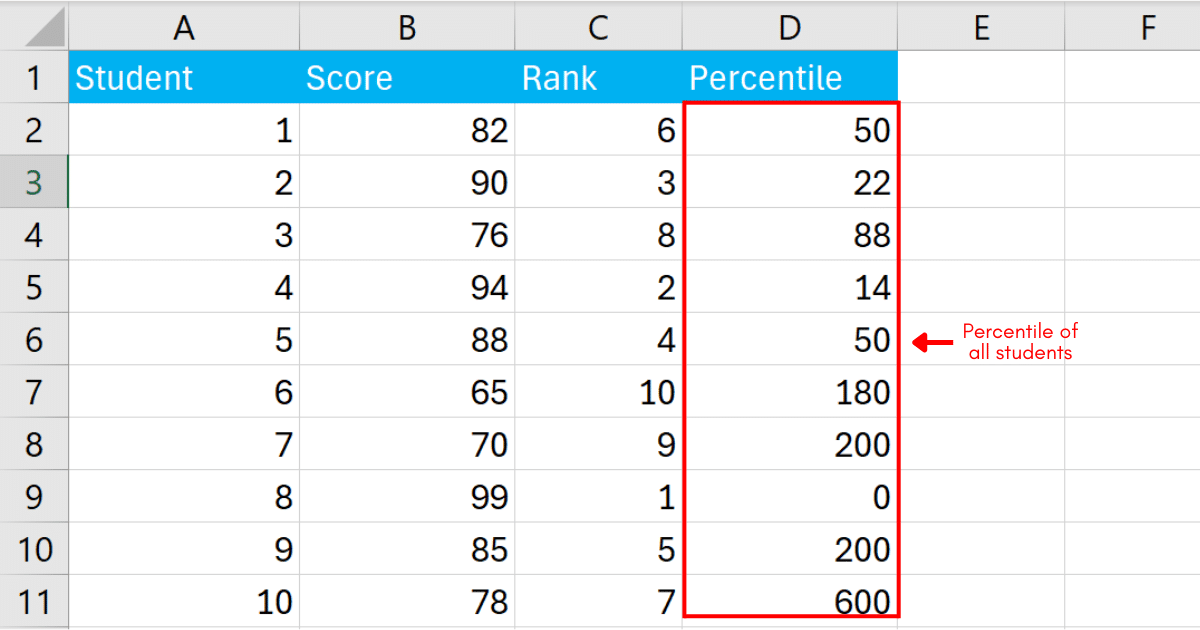
The method is especially useful for finding the relative position of a particular value.
Learn how to count distinct values in Excel by watching the following video:
Final Thoughts
Understanding how to calculate percentiles in Excel is more than just a technical skill; it’s a way to unlock insights into your data that aren’t immediately obvious.
So, whether you’re analyzing exam scores, survey results, or sales data, knowing where a specific value stands in relation to the rest can guide your decisions and strategies.
Lastly, learning these methods gives you the flexibility to approach your data from different angles.
So whether you prefer the simplicity of PERCENTILE.INC and PERCENTILE.EXC, the traditional QUARTILE functions, or the detailed analysis possible with the RANK and COUNT functions, there’s a method that suits your needs and preferences.
Happy Calculating!
Frequently Asked Questions
In this section, you will find some frequently asked questions you may have when calculating percentiles in Excel.
How to find the percentile of a number in Excel?
To find the percentile of a number in Excel, use the PERCENTILE.INC function by entering =PERCENTILE.INC(array, k) in a cell, where array is the range of data and k is the percentile you want to find, expressed as a decimal (e.g., 0.25 for the 25th percentile).
For exclusive calculations, use PERCENTILE.EXC with the same syntax.
How to calculate percentile in Excel for grouped data?
To calculate percentiles for grouped data in Excel, first create a helper column to expand the grouped data into individual values, if possible.
Alternatively, use a weighted percentile calculation formula that considers the frequency of each group, applying the PERCENTILE.INC or PERCENTILE.EXC function to this expanded or weighted dataset to find the desired percentile.
How to find the percentile of a list in Excel?
To find the percentile of a list in Excel, use the PERCENTILE function in Excel with the syntax =PERCENTILE.INC(range, k), where range is the list of values and k is the desired percentile (as a decimal).
For example, consider the following formula:
=PERCENTILE.INC(A1:A10, 0.9) This percentile function returns the 90th percentile of the list in cells A1 through A10.
How to calculate percentiles in Excel with multiple criteria?
To calculate percentiles in Excel with multiple criteria, use the PERCENTILE.INC Excel function combined with an array formula that incorporates IF statements for the criteria.
Enter the formula using Ctrl+Shift+Enter to create an array formula, for example: =PERCENTILE.INC(IF((criteria_range1=criteria1)*(criteria_range2=criteria2), data_range), k), where k is the desired percentile values as a decimal.
What is the formula for calculating the 25th percentile in Excel?
The worksheet function for calculating the 25th percentile in Excel is =PERCENTILE.INC(range, 0.25) or =QUARTILE.INC(range, 1), where range is the set of data values.


