Optimizing R code can significantly improve the performance of R scripts and programs, making them run more efficiently. This is especially important for large and complex data sets, as well as for applications that need to be run in real-time or on a regular basis.
In this RStudio tutorial, we’ll evaluate and optimize an R code’s performance using different R packages, such as tidyverse and data.table. As an example, we’ll see how long it takes for RStudio to read a large CSV file using the read.csv ( ) function, the tidyverse package, and the data.table package.
Optimizing Performance In R
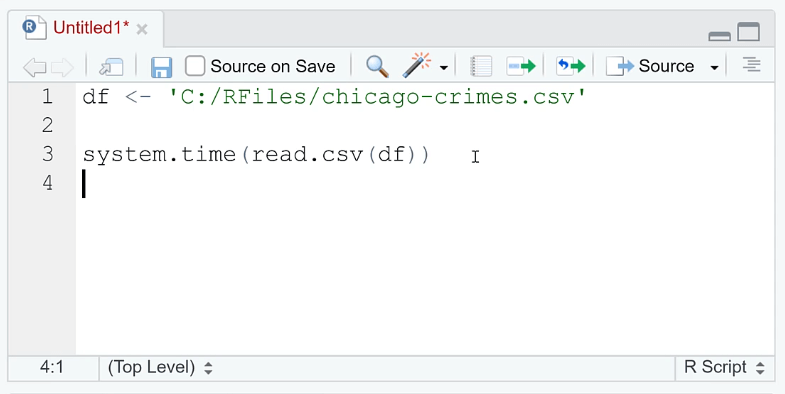
Open RStudio. In the R script, assign the file extension to a variable.
You need to use the system.file ( ) function to determine how long it takes to perform a function or operation. Since we want to evaluate how long it takes to open a file, write read.csv (df) in the argument.
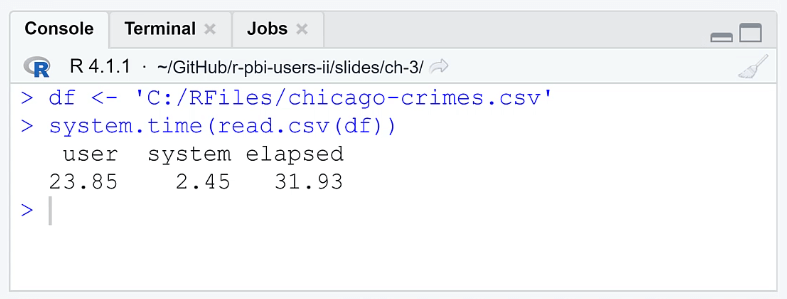
When you run the code, the Console will show you the time it took to open the file. The elapsed column shows how long it took for the CPU to perform the R code. The results show that it took RStudio 31.93 seconds which is a significant amount of time. This loading time is impractical if you’re always working with large datasets.
One of the ways you can optimize the performance of your R code is by using the tidyverse package. Doing so reduces the time from 30 to 5 seconds.
Take note that in order to read the file, you need to use the read_csv ( ) function.
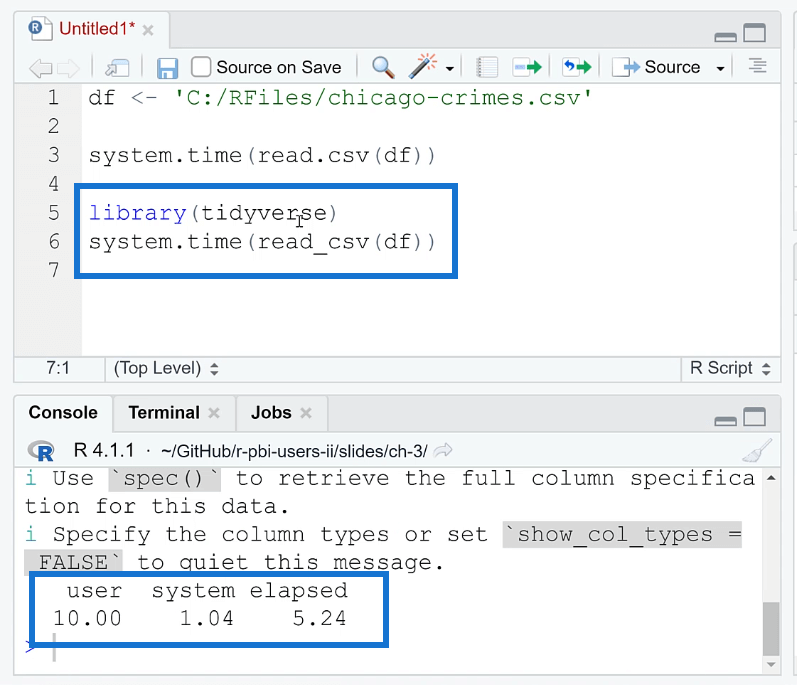
The tidyverse package improves loading time in R through the use of the readr package, which provides a set of fast and efficient functions for reading and writing data. The readr package provides functions such as read_csv ( ) and read_table ( ) that can read large data sets quickly and efficiently.
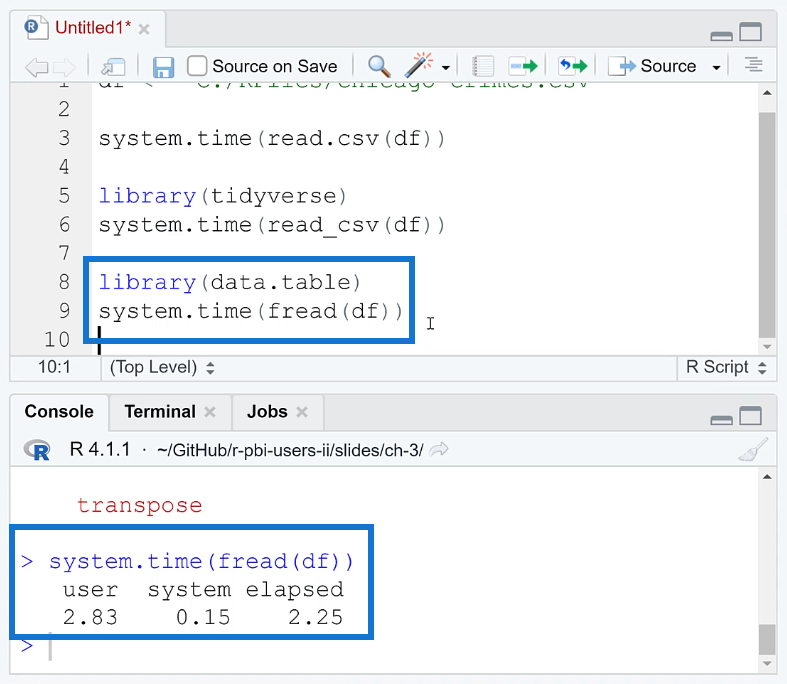
Another optimization method in R is using the data.table package. This is free to download in the internet.
The data.table package in R is a powerful and efficient tool for working with large and complex datasets. It provides an enhanced version of the data.frame object, which is a core data structure in R. The main advantage of data.table is its high performance and low memory usage when working with large datasets.
Note that when using this package, you need to write the fread ( ) function instead of read.csv ( ). When you run this together with your code, you can see that the loading time is reduced to 2.25 seconds.
Comparing R Packages Using Microbenchmark
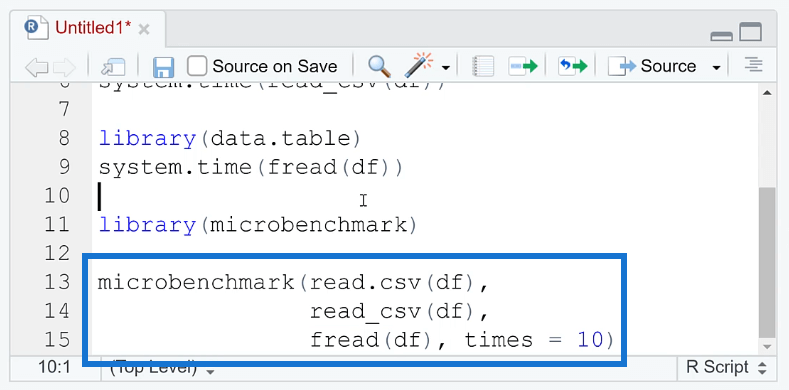
To compare the performance between each method, you can use the microbenchmark ( ) function.
The microbenchmark ( ) function in R is a tool for measuring the performance of R code. It provides a simple and easy-to-use interface for benchmarking the execution time of R expressions.
A great thing about this function is you’re able to set how many times the process is repeated. This gives more precise results. You’re also able to identify if the results are consistent.
If you’re having trouble reading a CSV file in Power BI, RStudio can do it for you. There are other options in R that you can use to optimize your code’s performance. But data.table is highly recommended because of its simplicity.
***** Related Links *****
Edit Data In R Using The DataEditR Package
How To Install R Packages In Power BI
RStudio Help: Ways To Troubleshoot R Problems
Conclusion
Optimizing R code is an important step in ensuring that your R scripts run efficiently. There are several techniques and tools that can be used to optimize R code, such as using the tidyverse package for data manipulation, using the data.table package for large data sets, and using the microbenchmark package for measuring the performance of R code.
It’s also important to keep in mind good coding practices such as using vectorized operations instead of loops, making use of built-in functions instead of writing your own, and being mindful of the memory usage of your code.
All the best,
George Mount


