
In previous tutorials, you learned about objects, object classes, and vectors. For this tutorial, you’ll be learning about data frames in R.
Data frames are essentially vectors combined together to form rows and columns of data.
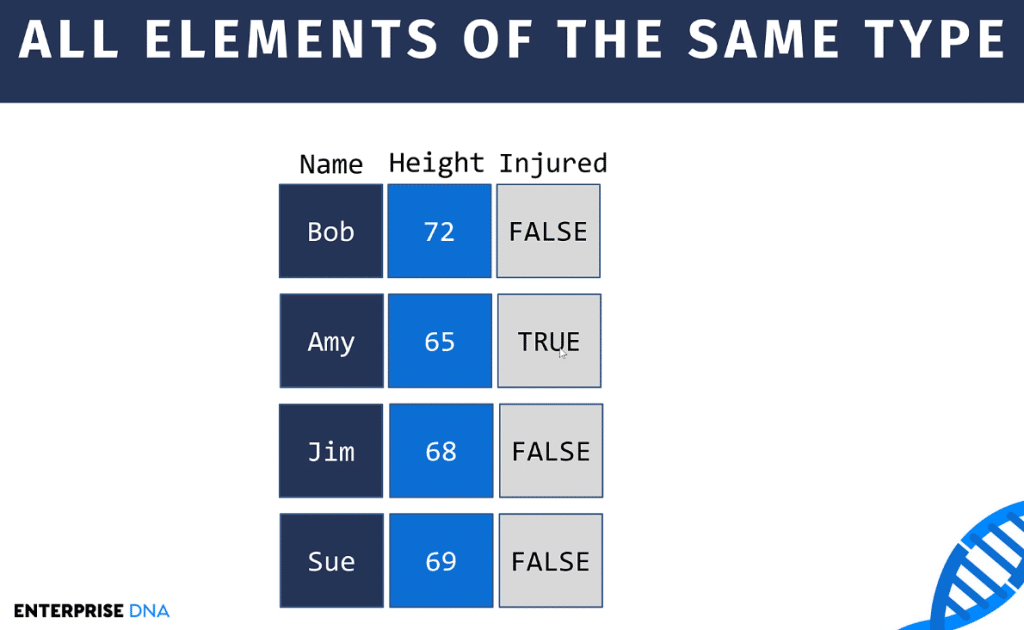
A column consists of one vector. So in the example above, the first column is a string column, followed by a numerical column, and then by a logical one. This is similar to how a table would look like in Power BI.

Also, you need to remember that for data frames, there should be the same number of items for all columns. That is, there should be a consistent number of rows.
When using the R programming language, you’ll usually be working with data frames. So, it’s important to understand what they are and how they can be used.
Loading And Viewing A Shipped Data Frame
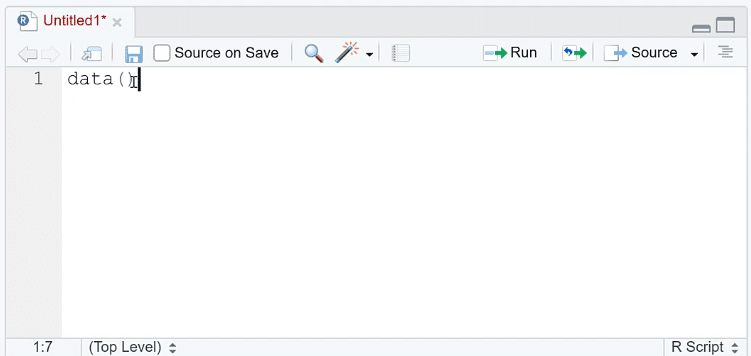
RStudio already comes with shipped data frames that you can use. To identify them, you need to use the data ( ) function.
Open RStudio and Run data ( ). You don’t need to place any argument in the parenthesis.
Once done, you’ll see a list of built-in datasets in R that you can use.
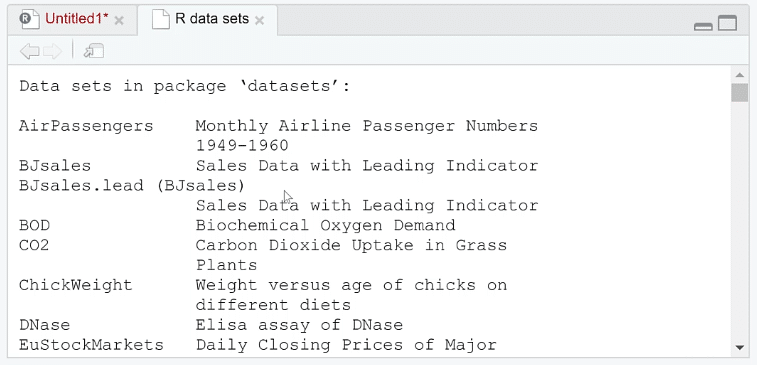
They are really helpful for practicing and getting familiar with how to use data frames in R.

The most commonly used built-in dataset is iris. Iris is often used when learning data science or data analytics in general. Print iris so you can see its data in the Console.
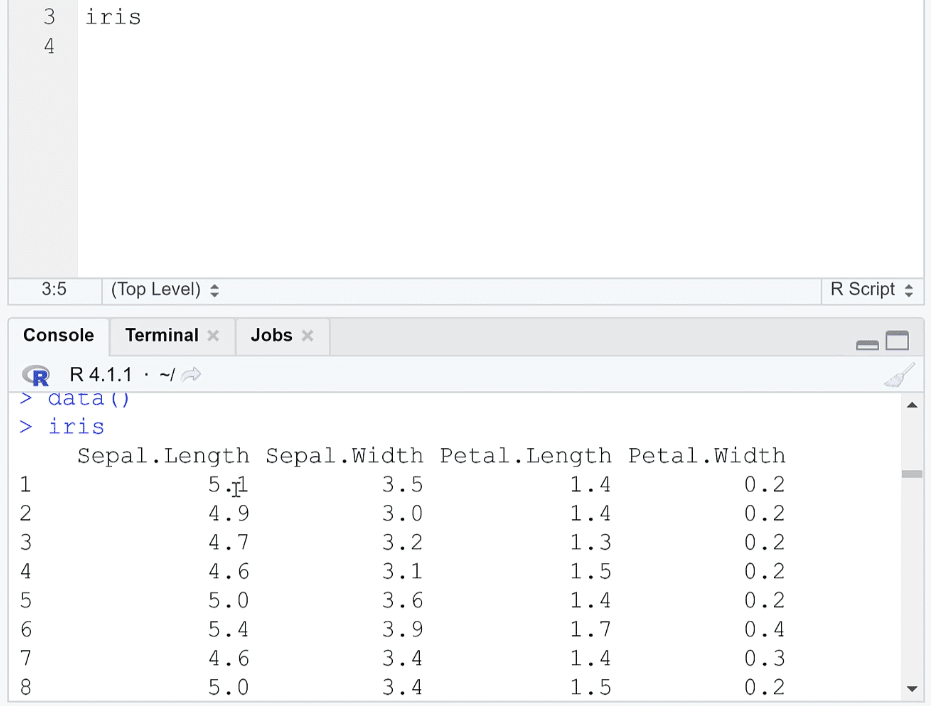
You can see that there’s a lot of data. Scrolling up, you’ll see that it’s composed of different columns.
Exploring Data Frames In R Using Functions
One of the ways to have a better look at the data is by using the view ( ) function. When you Run the code view (iris), you’ll see a new tab containing a table appear in RScript.
What makes the view ( ) function better is that you can make adjustments to the table. You can adjust the order of the data by using the arrows on each column title. There’s also a filter button.
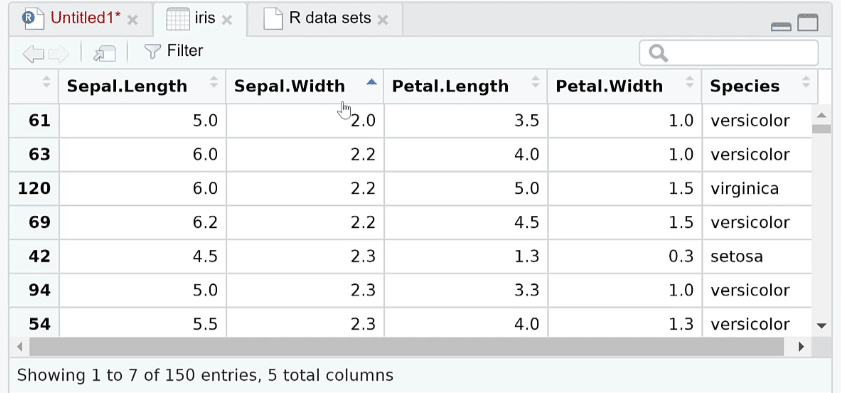
You can also click on the icon beside filter to open the data in a new window.
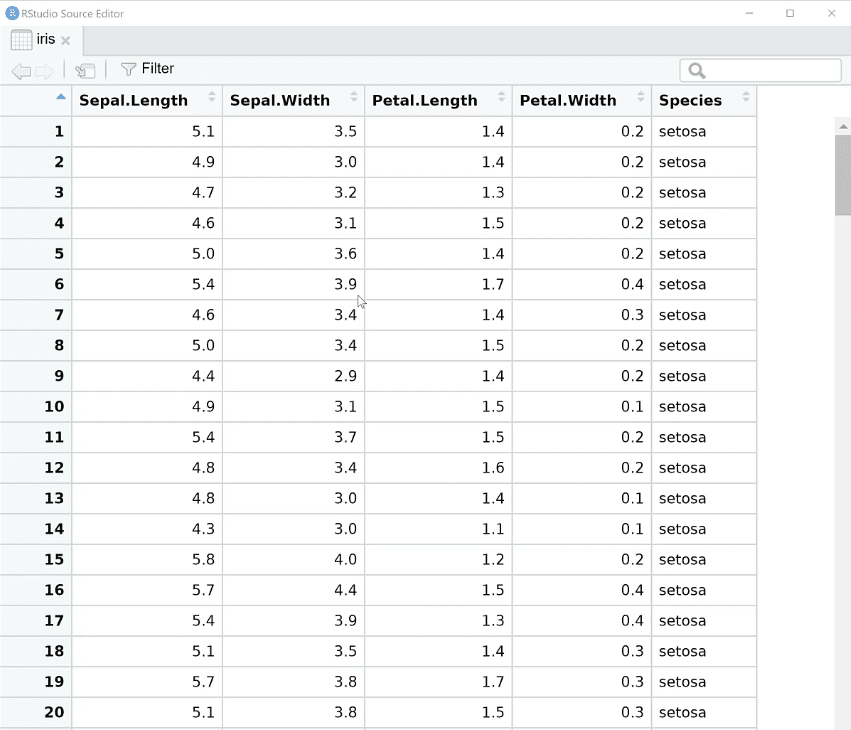
This new window is similar to Power Query where you can look at the data but not touch it. That is, you can’t enter or replace values on top of the existing data.
Another useful function to know is the head ( ) function. This function prints the first rows of the dataset.
So if you Run head (iris), you’ll see that it only prints the first six rows.
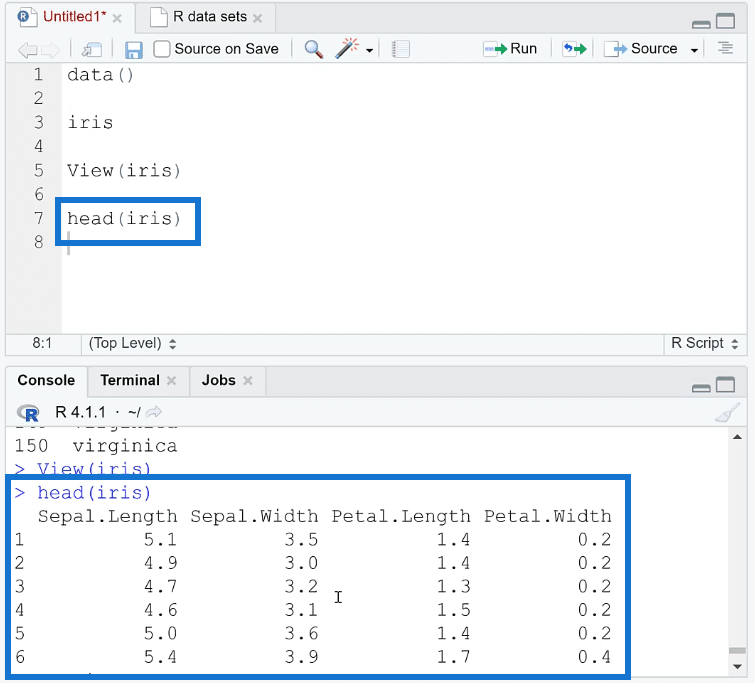
This is great when you want to make better sense of your data. The Console is not overwhelmed, and the data presentation is neater.
Indexing Data Frames
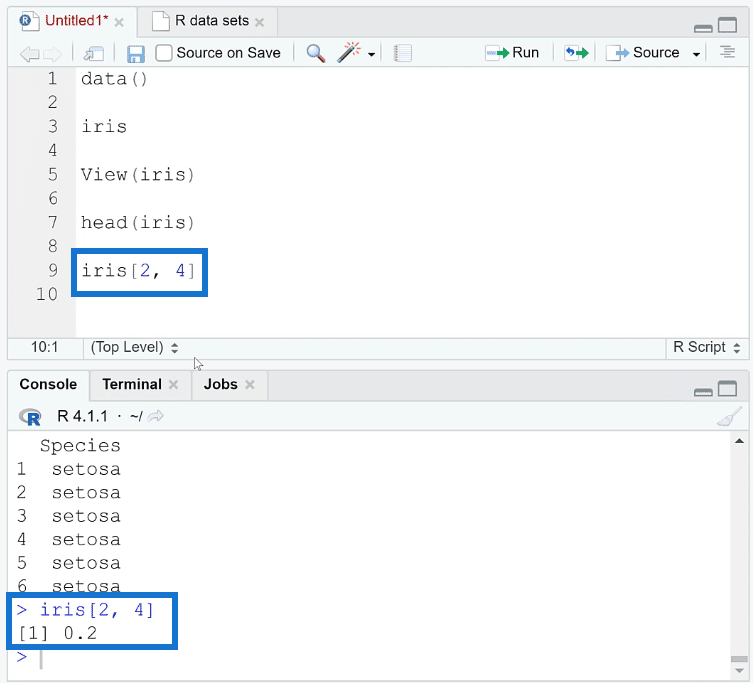
Indexing was also discussed in a previous tutorial about vectors. You only need to use square brackets ( [ ] ) to index a position. Now since data frames are composed of rows and columns, you need to index both. The format is name [row, column].
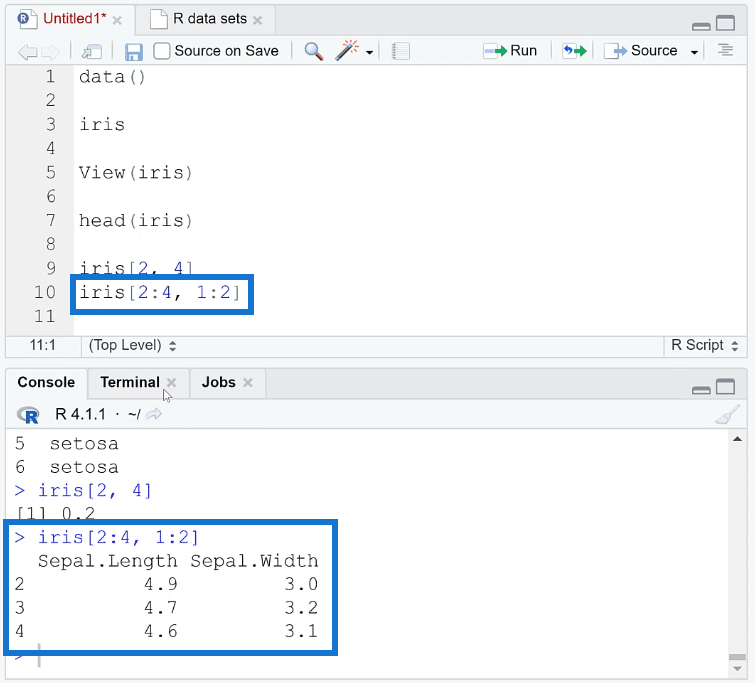
For example, if you want to index the 2nd row and 4th column of the iris dataset, just Run iris [2, 4].
You can also index a row and column range. All you need is to use a colon (:) to indicate the range. Here’s an example:
You can also index an entire column. Use the dollar sign ($) after the dataset name and indicate the column name you want. For example, if you want to index the entire column named Species, Run iris$Species.
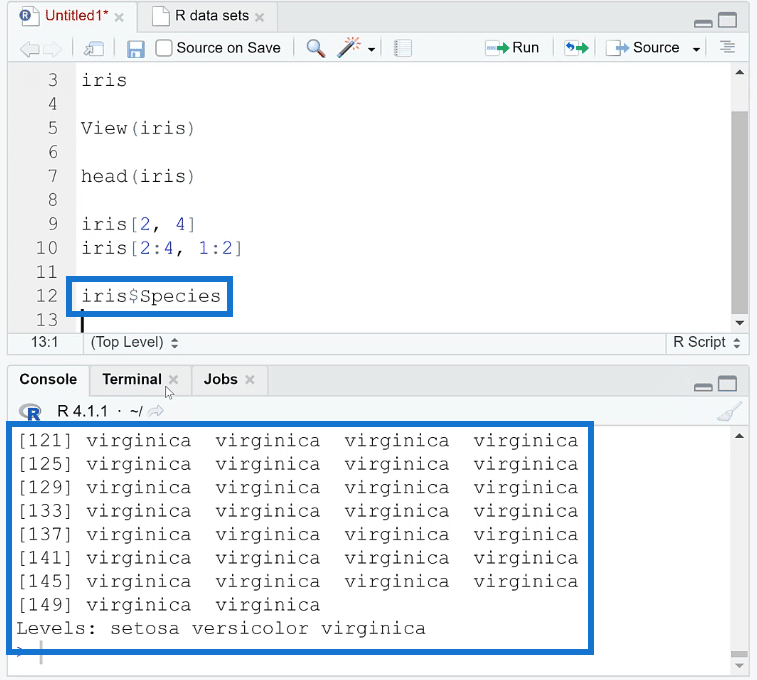
You’ll then see that the entire Species column has been printed out in the Console.
Showing Data Frame Statistics In R
As you’ve learned in previous tutorials, R was built for the purpose of data analysis, statistics, and visualizations. So another useful thing to learn about data frames in R is how to summarize them.

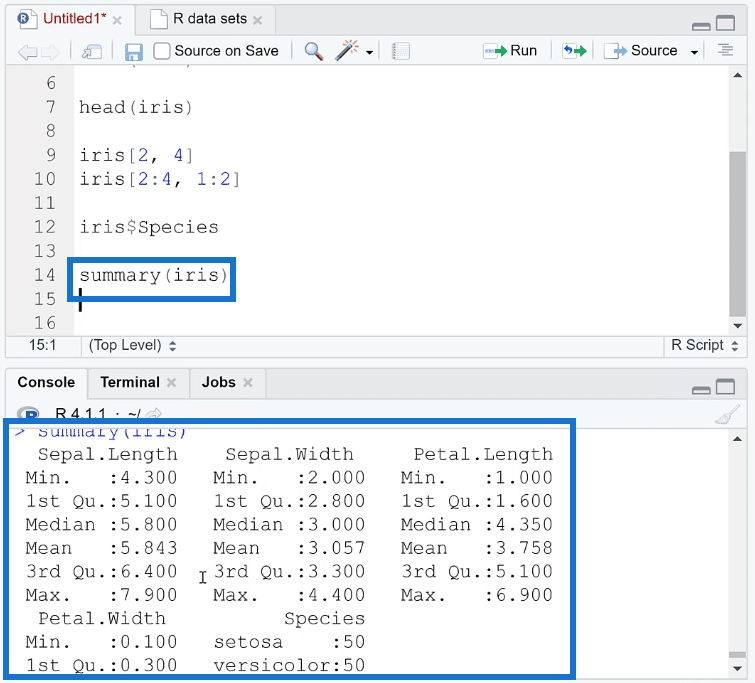
When you use the summary ( ) function, the Console will return the summary statistics for that data.
Run summary (iris). This will give you basic information of the dataset in terms of descriptive statistics.
There are other packages to get more summary statistics such as standard deviation and kurtosis. But these will be discussed in succeeding tutorials.
***** Related Links *****
Three Ways To Use R Script In Power BI
Objects And Object Classes In R: The Basics
Create Vectors In R: A Step-by-step Tutorial
Conclusion
You’ve been learning the components of R progressively. First, you learned about objects, then advanced with vectors, up until this lesson on data frames. You’re now dealing with larger and more complex data.
With data frames, you’re now better acquainted with the different datasets in R and learned how to arrive at basic statistics information.
You’ll continue to learn progressively as the next tutorials tackle on ways to size up and explore larger data in R.
George


