In this Power BI showcase, we’ll review a report that focuses on customer insights that can help improve our business’ customer service and profitability. You may watch the full video of this tutorial at the bottom of this blog.
The technique used throughout these reports is segmenting the clients into our main sources of Revenue.
The top clients are also compared to our mid and lower margin clients.
Report Summary
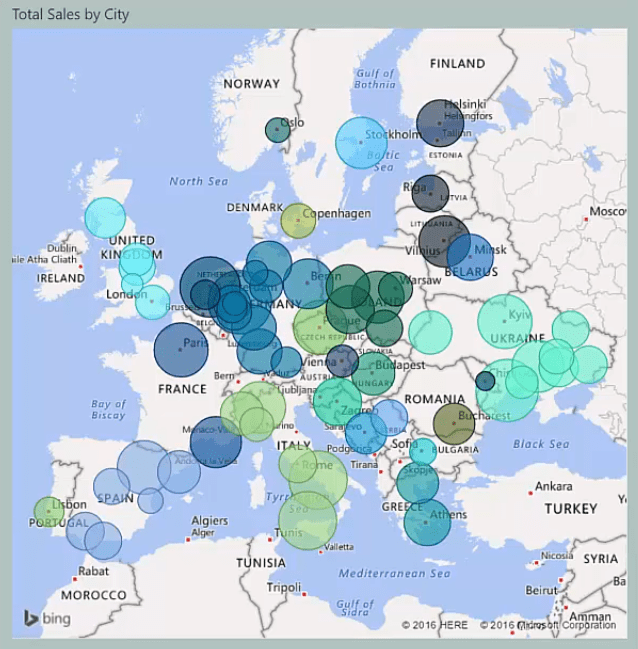
This report is based on a company that sells products throughout the European region.

This shows a summary of the regions that are generating Sales:
We can select different time frames using these slicers:

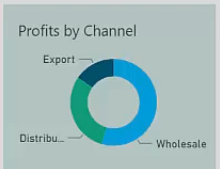
We can also see the channels we’re selling to:
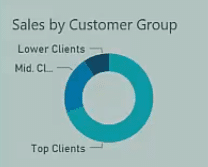
This chart provides a deep dive into our top clients which allows us to see where the bulk of our Revenue is coming from:
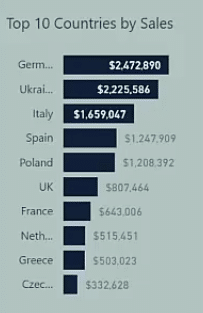
We can also see the top countries by Sales for those top clients:
Customer Analysis
In this report, we drill into specific client Sales and compare it to historic Sales.

In this case, we’re looking at our Cumulative Sales over the selected time period versus the previous Sales.
The great thing about this report is that it’s dynamic.
We can look at specific clients and see if we’re behind on Sales or above the Budget, and then understand why this is occurring.

This report also allows us to see the specific products bought by a customer along with their profitability for specific time horizons.
Moreover, we can select different time horizons using the slicer and make a comparison between time periods.

The chart shows the Cumulative Total Sales for quarter 2 and 3 of 2016 versus last year’s quarter 2 and 3 metrics.
We can thoroughly drill into the performance of each customer and consequently, look at our Sales force and regional performance.
Top Customers
In this report, we’re drilling into the client groups and specifically look at our top customers.

Though we can have an unfiltered look at the entire client base, we want to focus on our top clients because they are the major source of our Revenue.

The top clients generate 65-70% of our Revenue.
We can further select a specific time frame and then quickly see the top clients for that period, their countries, and the products they’ve bought. This information can be ranked in descending order so that we can identify where the Sales are occurring.
We can also see the Profit Differentials between the products purchased by our clients.

With this insight, we can infer why some of these products sell and why there’s a Margin Difference for this client over different products.
Power BI can help us identify the logical reasons behind this information in a dynamic way.
We can also get insights as to why some clients obtain larger Margins compared to other clients on the exact same product.
Selecting specific information in the report also allows us to look at each individual transaction:
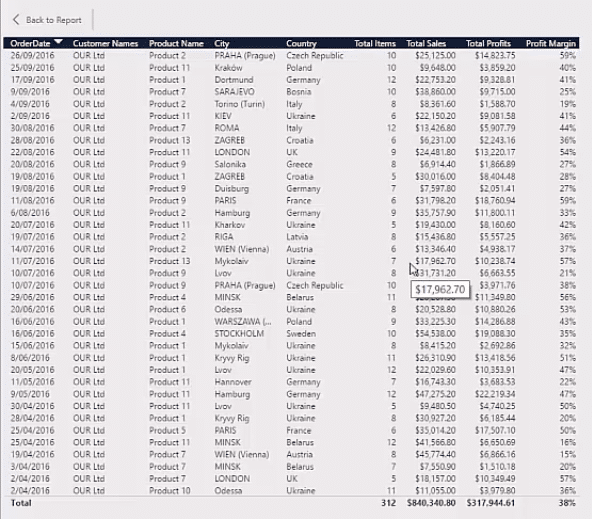
This way, we can multi-select clients or have client groupings. This data can also be exported for high-level transactions.
This is a great way to give focus on the key transactions which we can present during a Sales meeting.
Customer Sales
In this page of the report, we’re able to effectively look at our customer data through time.

We can see the purchase made by a client for a certain time frame versus their purchase last year.
In this case, we’re specifically drilling into the products. We’re looking into which products have been bought by our key clients.
We can identify the reason they bought more products this year compared to last year, and vice versa.

These insights help us conclude that we should be communicating with the client to understand what they’re doing. We need to find out if they’ve gone to a competitor, moved on to a different line of business, or discontinued selling or using our product.
***** Related Links *****
First Purchase of Customer Insight Using DAX
Break Out New Customer Sales – Advanced Power BI Insights
Pareto Analysis: Who Are The Top 20% Customers
Conclusion
This Power BI Showcase presents the different reports we can set up to gain valuable customer insights.
There’s a variety of conversations that we can have on the back of the information we’ve gathered in these reports. It’s incredibly intuitive to find out where this information is coming from, and to compare these insights to any historical time frame.
This method helps us understand why some trends are emerging in our Sales data, and what we can do to improve our profitability.
All the best,
Sam
[youtube https://www.youtube.com/watch?v=yFk3Ho0pH3s?rel=0&w=784&h=441]


