In this Report Builder tutorial, you’ll learn how to sort and filter the data in your paginated reports.
This tutorial is split into two sections. The first section discusses how to apply a sort order on your data. There are two ways to sort data. You can either use Tablix Properties or Row Groups.

The second section discusses how to filter your data. In Report Builder, you can filter your data either at a Data set level or at a Tablix Level.
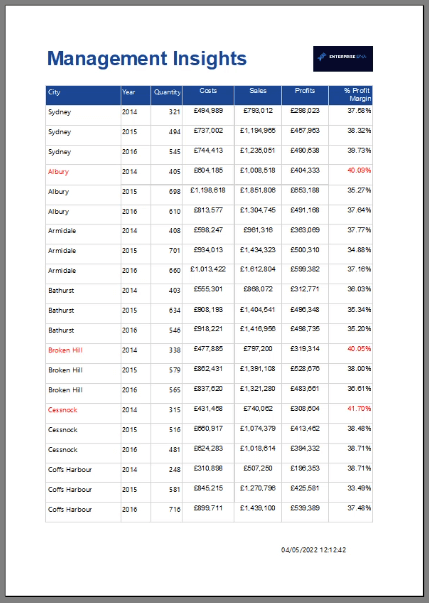
Report Builder Tutorial #1: Sort Data
There are different ways to sort your data in Report Builder.
Tablix Properties: Method 1
The first method is by using the Tablix Properties option. Access this by right-clicking on a Tablix and then selecting Tablix Properties.
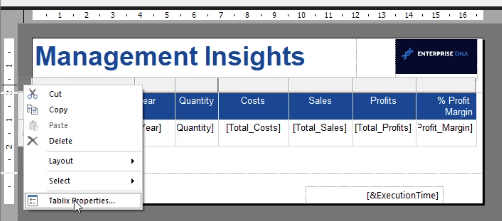
In the Tablix Properties window, go to the Sorting tab.
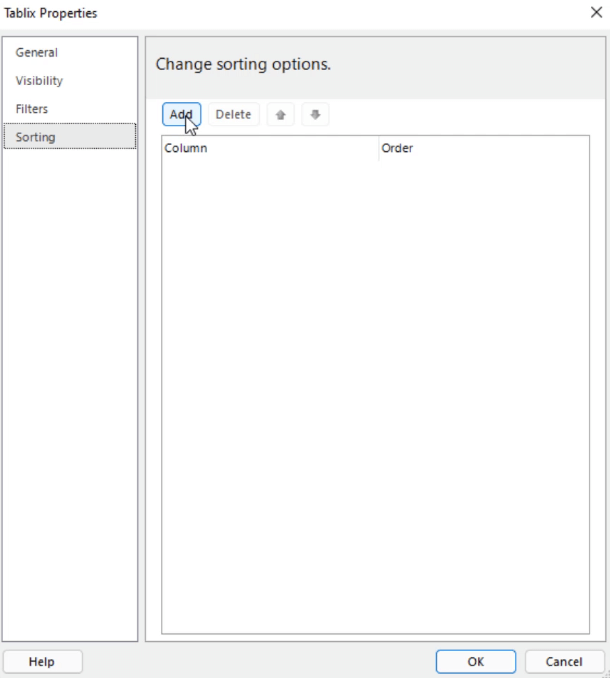
Click the Add button. Then, select the column or data you want to sort by clicking the drop-down arrow. Afterwards, select the sort order you want this to be in.
If you want to sort more columns, repeat these steps until you’re satisfied. Then, click OK.
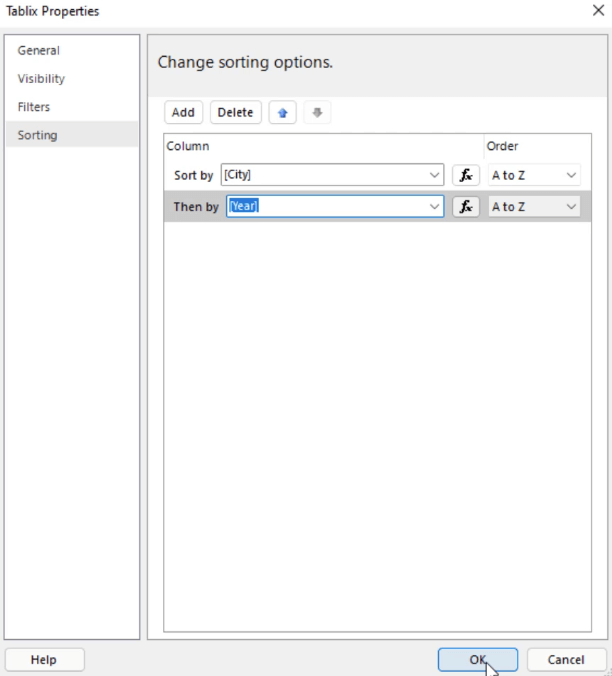
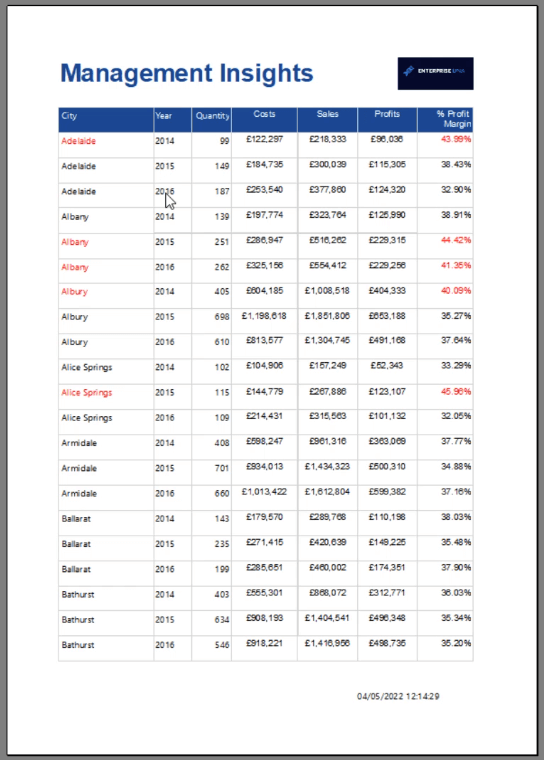
When you run the report, you’ll see that it’s now been sorted.
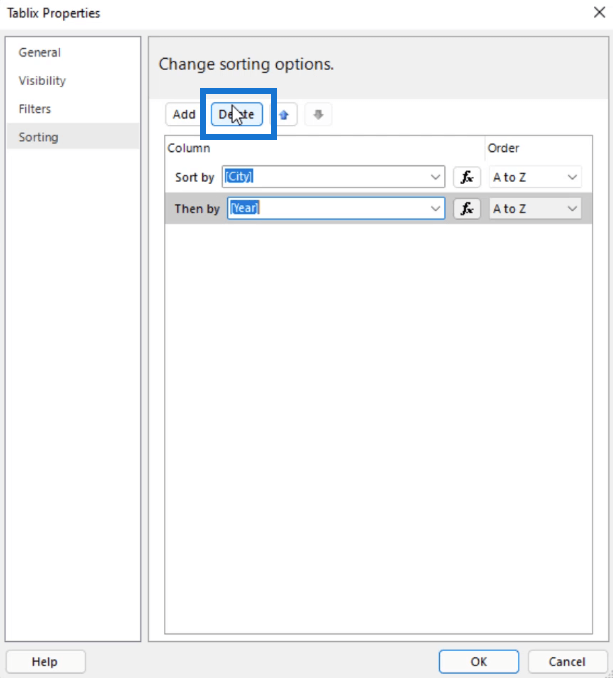
If you want to delete a sort order, go back to the Tablix Properties. Select the sort order you want to remove and then click Delete.
Row Groups: Method 2
Another way to sort your data is by using the Row Groups option found at the bottom of the Report Builder.
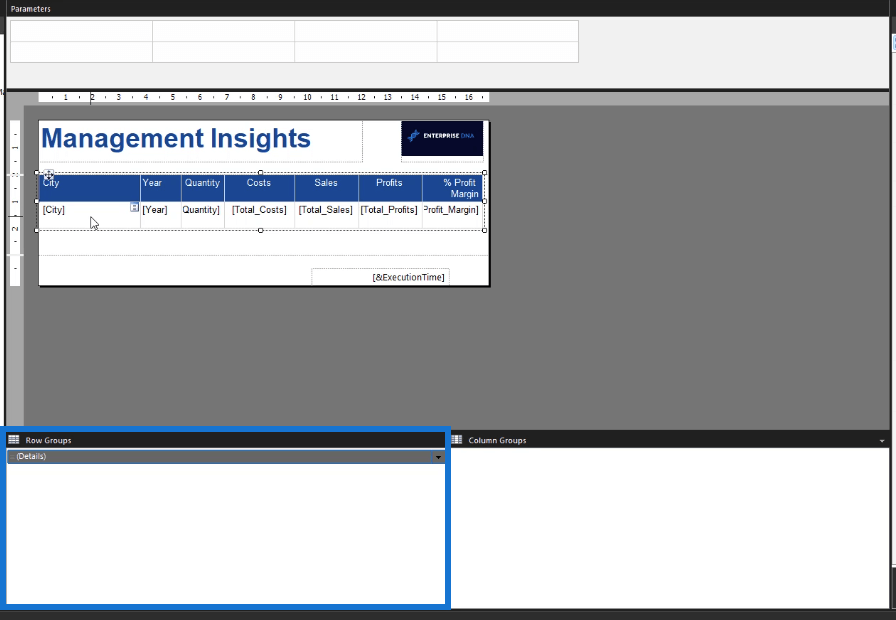
Row Groups refer to each row within a particular Tablix. To sort using this method, click the dropdown arrow of Details and then click Group Properties.
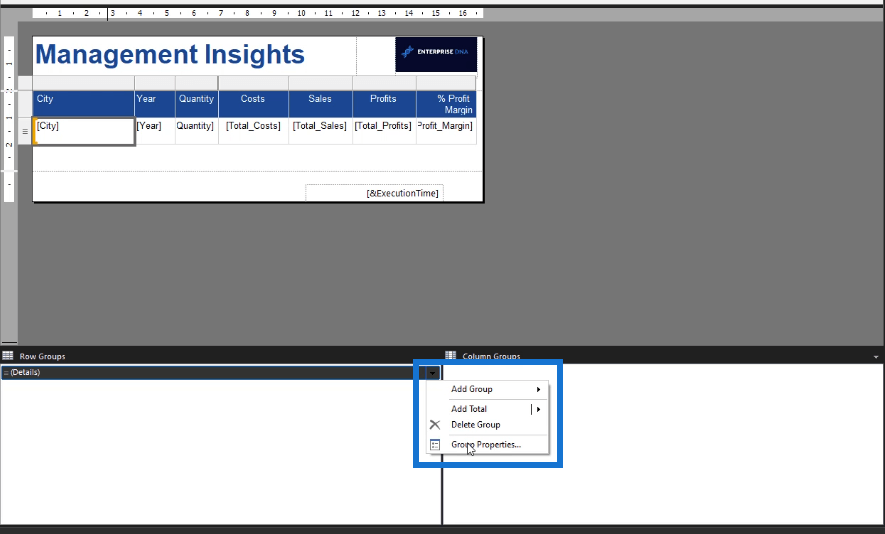
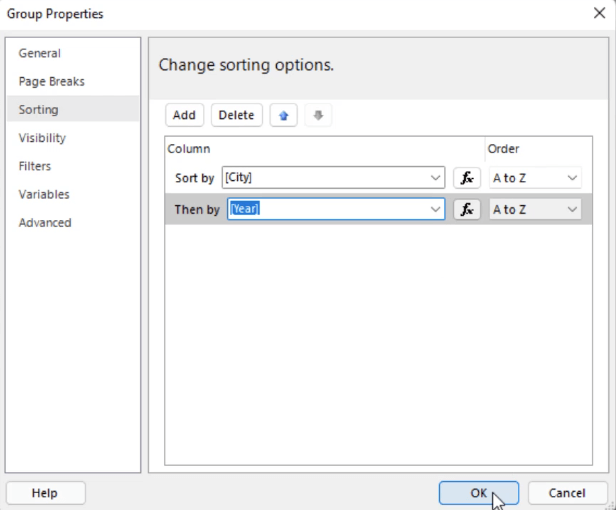
In the Group Properties window, go to the Sorting pane. The sorting process is similar to that of the Tablix Properties.
Click the Add button. Select the column or data you want to sort by clicking the dropdown arrow, and then select the sort order you want this to be in.
Report Builder Tutorial #2: Filtering Data
Report Builder Filter At Dataset Level: Method 1
Other than sorting, you can also filter data according to the conditions you want. Right-click on the dataset you want to filter. In this case, it’s Sales. Then, click Query.
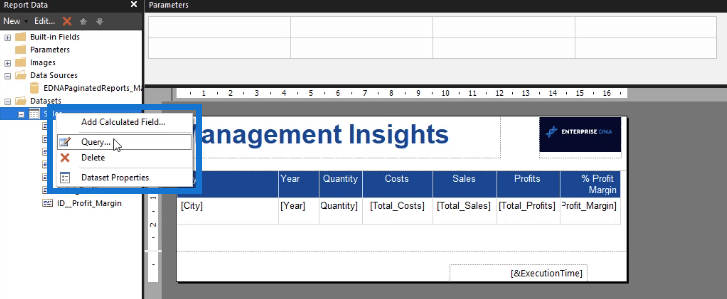
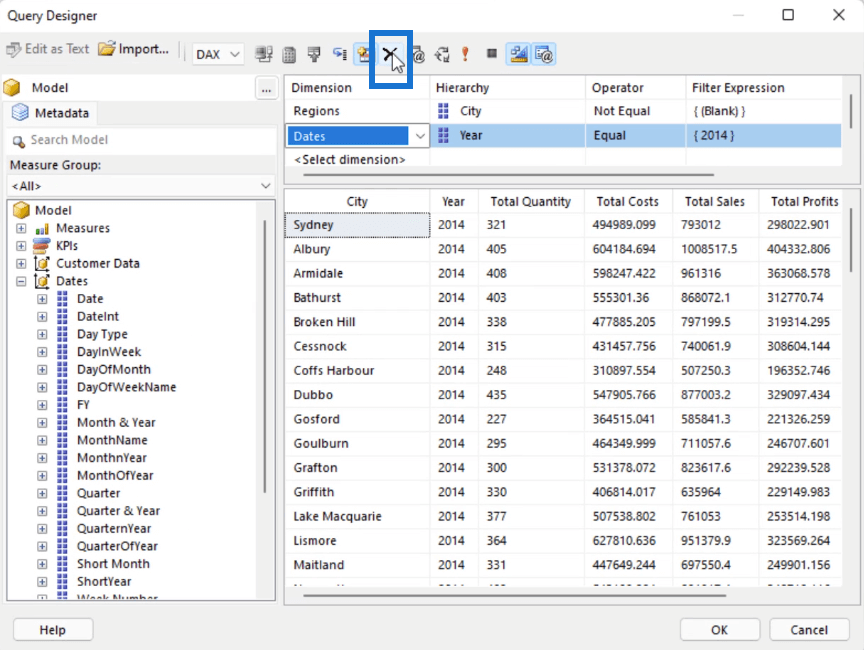
This opens the Query Designer.
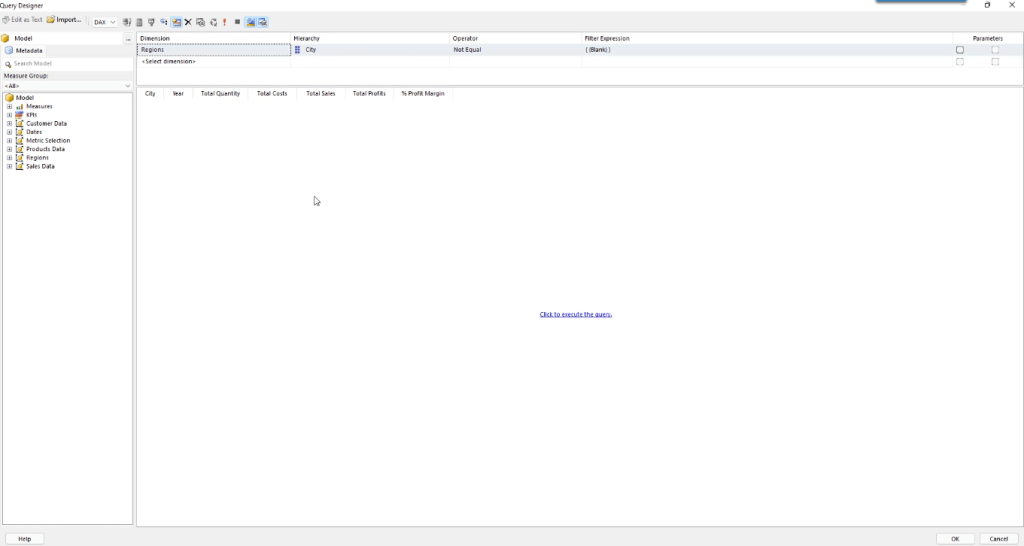
At the top section, there’s a Dimensions tab. To filter data, drag a dimension from the Measure Group pane and place it in the Dimensions tab. Then, adjust the Operator and Filter Expression.
Continue doing this until you’ve set all the filters you want in your report.
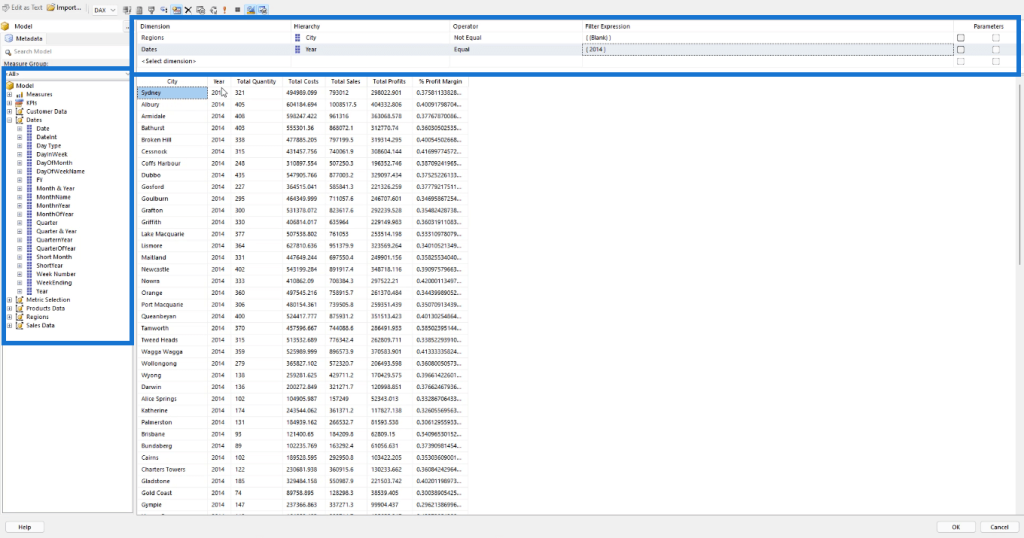
Then, select the Click to execute the query option found at the middle of the page.
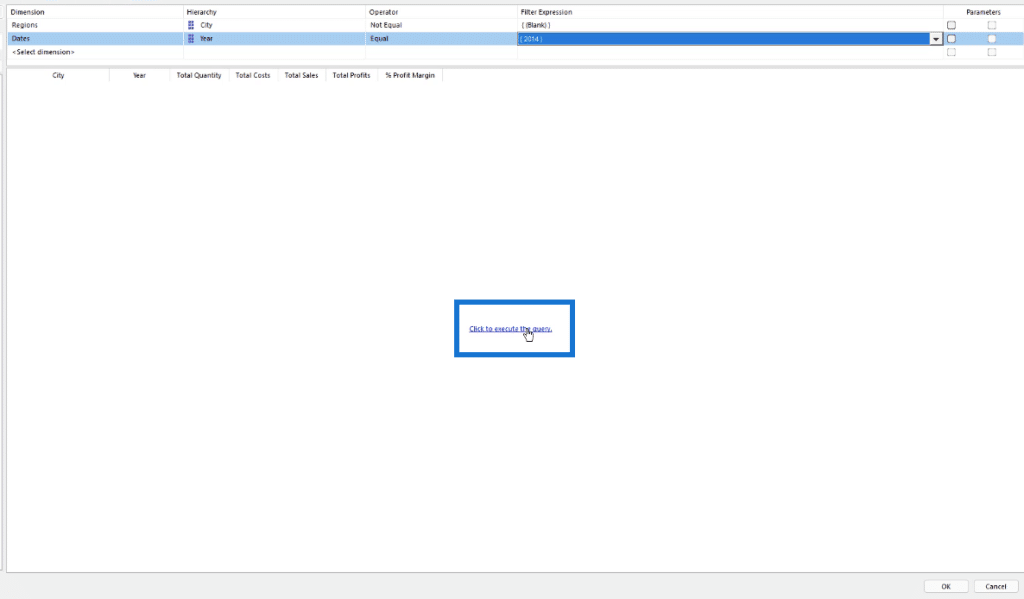
This will then show what your report or table looks like with the applied filters.
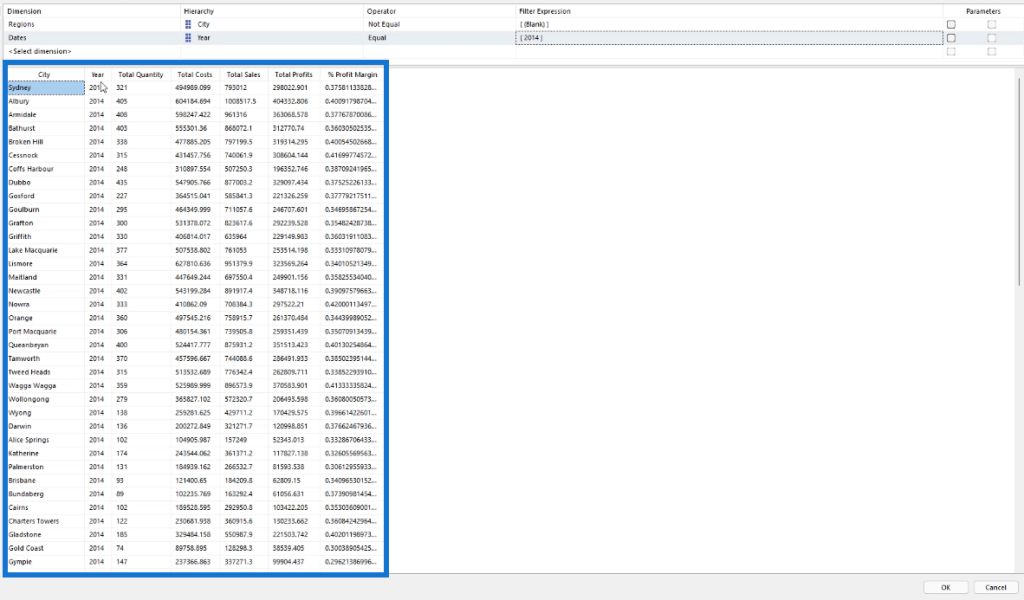
In this case, it’s only showing data that belong to the year 2014 with non-blank City values.
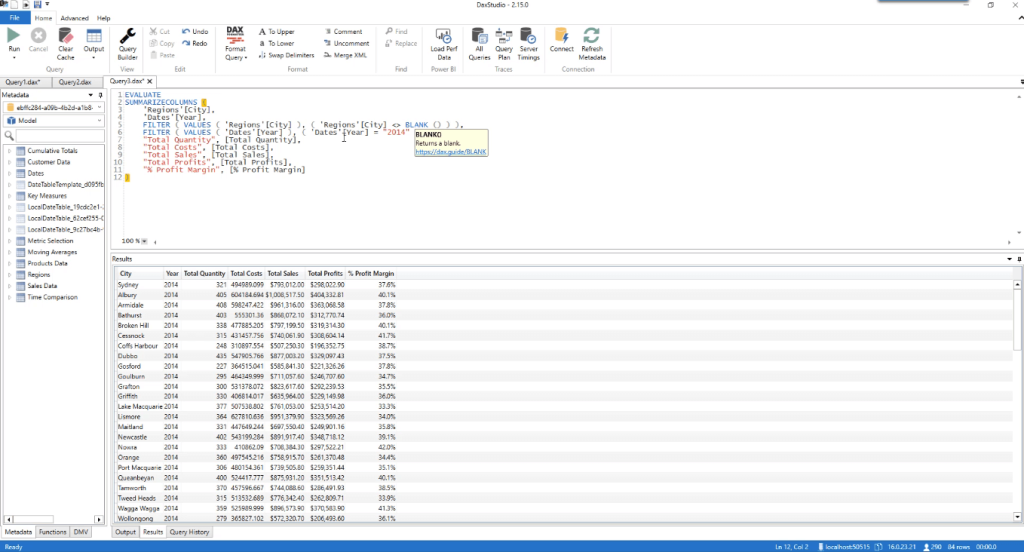
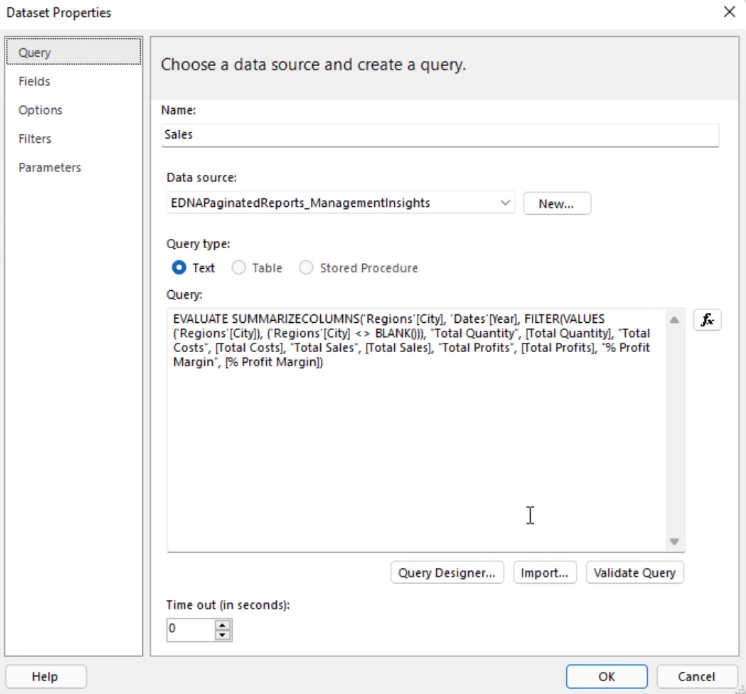
If you copy the query and run it in DAX Studio, you can see that the report is filtering the query from the data source.
Go back to Report Builder and run the report. You can see it’s been applied with the filters you created.
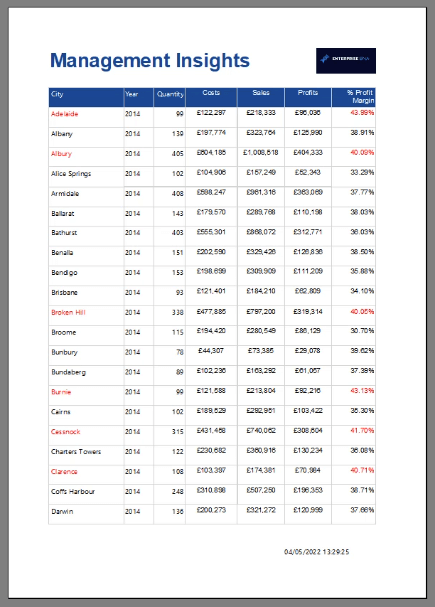
Moreover, this doesn’t affect conditions or options you previously set. Even when Report Builder filters are applied, the sort order and conditional formatting remain the same.

To remove a filter, go to the Query Designer. Select the filter you want to remove and then click the X button found on the Query Designer menu pane.
Report Builder Filter At Dataset Level: Method 2
Another way to apply filters is by using the Dataset Properties. To access this, right-click on the dataset you want to filter and then select Dataset Properties.
Go to the Filters tab. Click the Add button and then select the expression or data you want to filter. Then, adjust the Operator and Value.
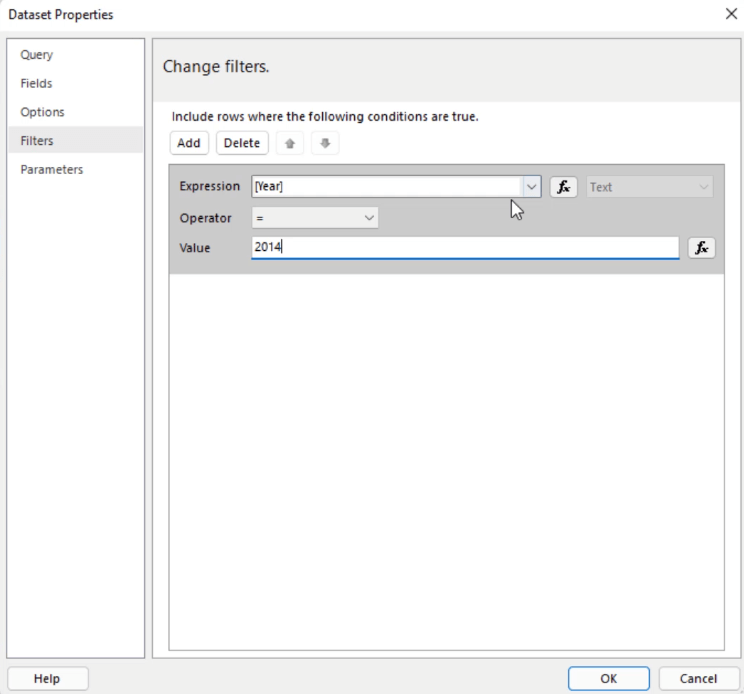
This method is perfect to use if you can’t use the Query Designer option in the Report Builder.
Report Builder Filter At Tablix Level
You can also apply a Tablix level filter on your report. Select your Tablix then right-click on it and select Tablix Properties.
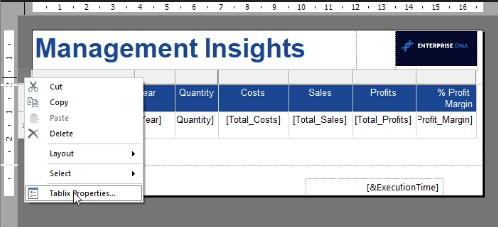
In the Tablix Properties window, go to the Filters tab and click the Add button. Select the Expression or data you want to filter. Then, adjust the Operator and Value.
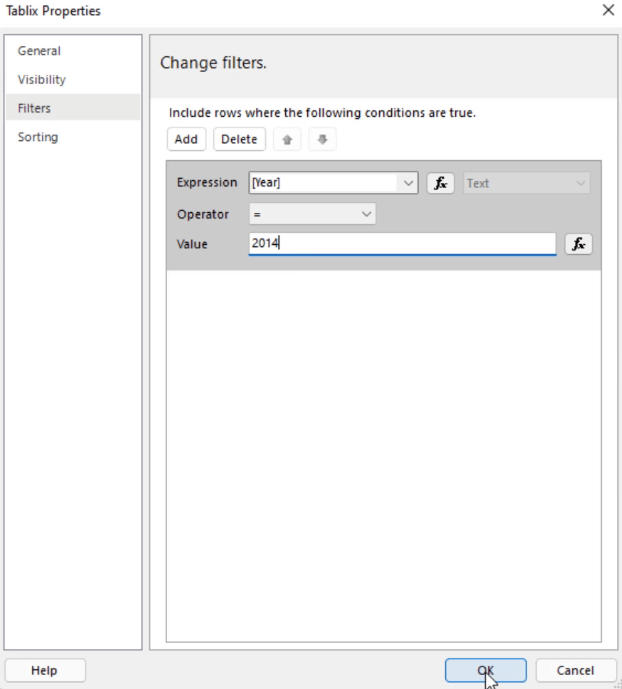
Note that when you use Tablix Properties, you’re not just filtering a dataset. You’re filtering the visual itself.
***** Related Links *****
How To Format Data In Report Builder
Expression Builder: Applying Conditional Formatting On Paginated Reports
Power BI Filtering Techniques For Tables
Conclusion
Sort and filter are very basic processes in any report. However, they are one of the most useful especially when dealing with a wide data set.
By sorting your data and arranging them in a specific systematic order, the information on your report becomes easier to read and understand.
Moreover, having the ability to filter either at a dataset or tablix level is especially helpful when dealing with several different tables, charts, graphs, and lists. It allows you to present your data and visuals at different granularities.
Sue


