
In this blog, you’ll learn how to apply repeatable codes or functions to Python datasets to produce the same type of output. This will help you be more efficient and exert less effort in pulling up certain data from different datasets. In this tutorial, we’re going to utilize an existing code that I’ve previously created as an example.
You’ll also learn how to make copies of datasets to avoid damaging the original version of the dataset, import libraries and functions using repeatable codes, and create a visualization in Power BI.

For this blog, I recommend you to get the CSV file all the time and bring it over to Power BI. I’ll also demonstrate how we can bring this CSV file and place it straight into Power BI, just in case you have to do it.
Fetching A CSV File In Power BI
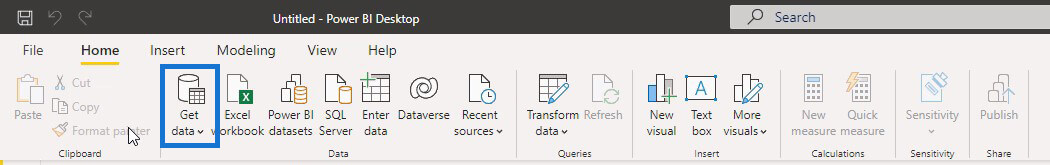
To bring a CSV file to Power BI, the first thing you have to do is click on the “Get Data” menu in the Home ribbon.
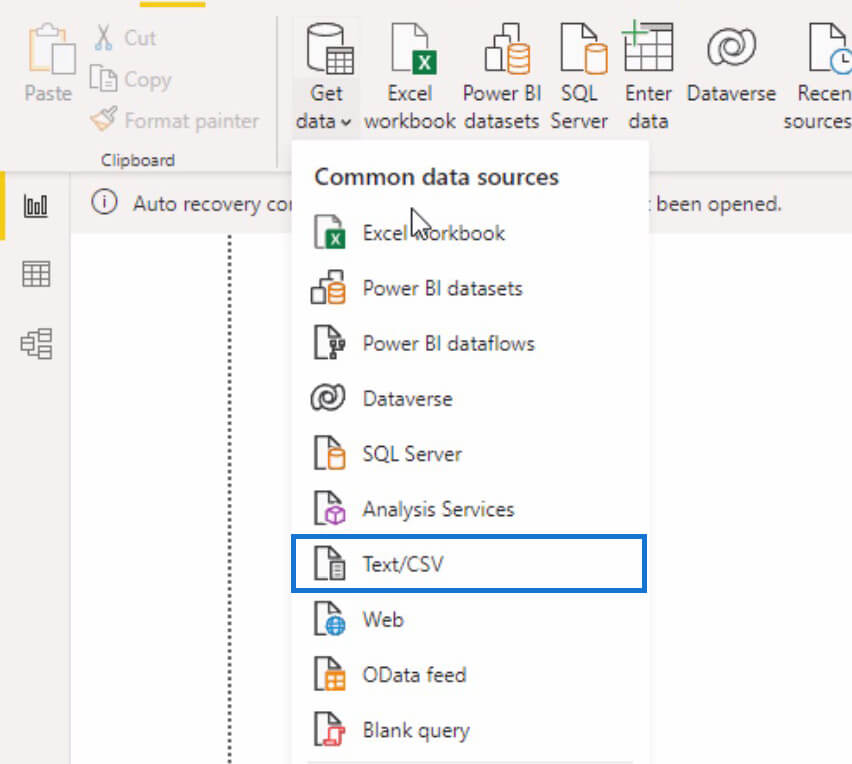
After clicking, a dropdown menu will appear and you have to select the “Text/CSV” option from the menu.
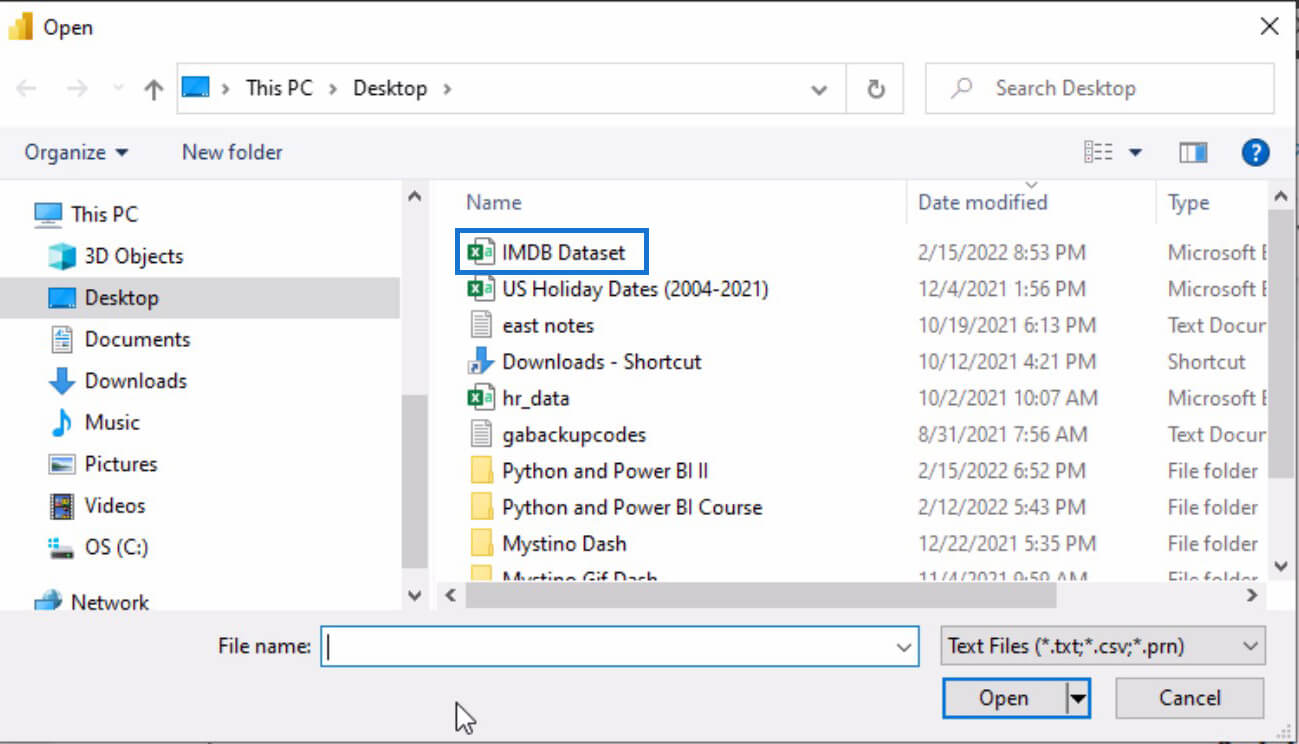
Once you select the “Text/CSV” option, a window will open where we can select the file that we want to bring into Power BI. For this example, let’s use the IMDB Dataset file.
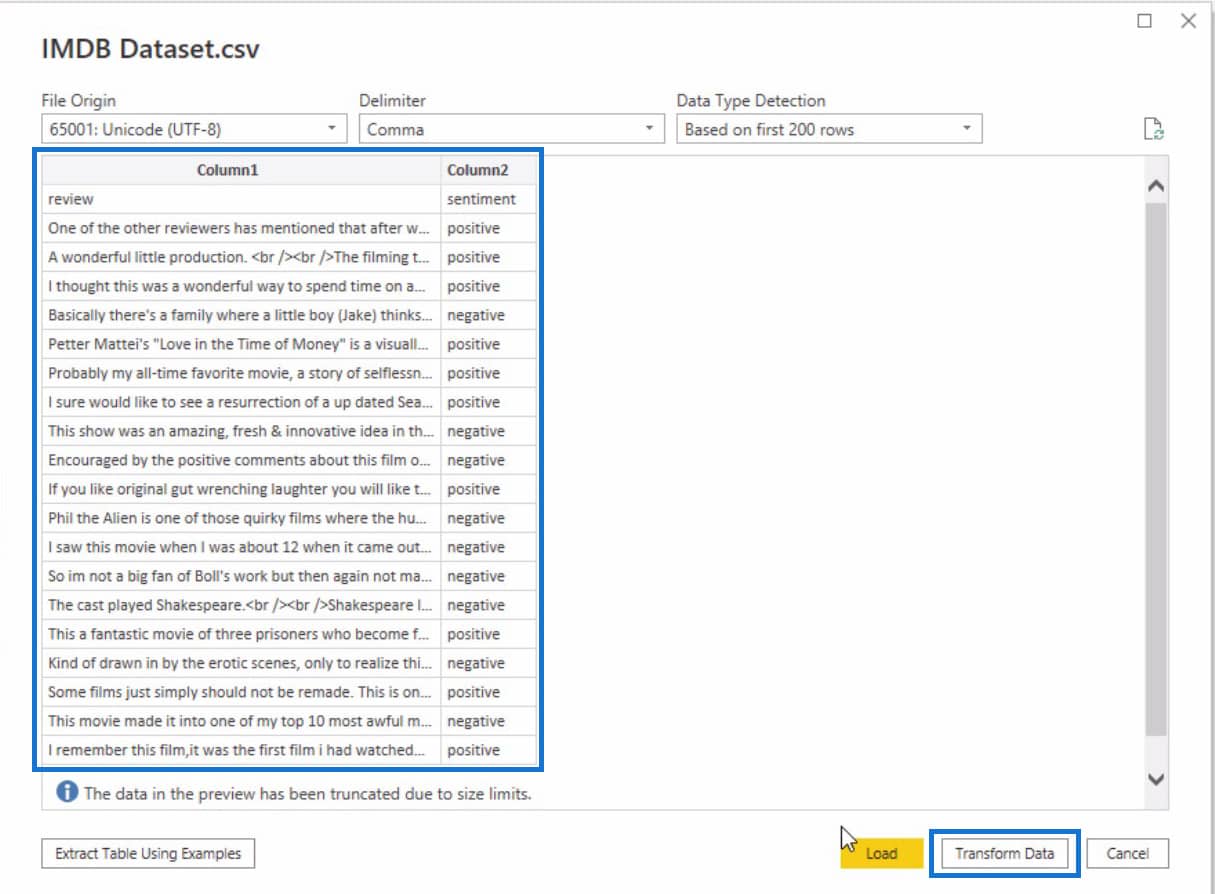
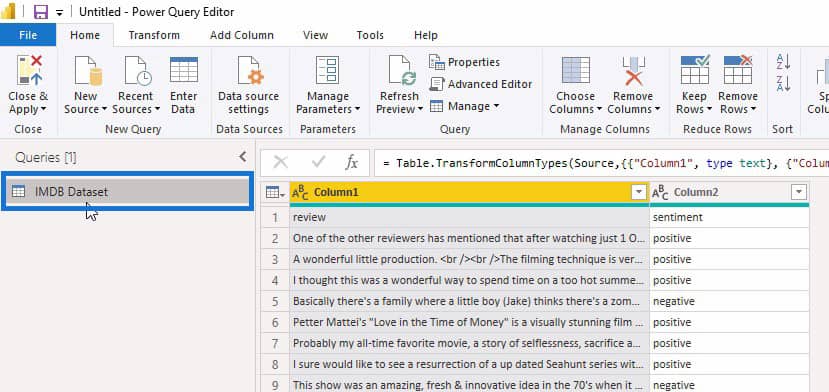
Upon opening the IMDB Dataset.csv file, you’ll see another window that displays the data inside that file. Since this file contains a large amount of data, it only previews some of the data.
The first thing we’re going to do in this file is to transform it. To do that, just click on the “Transform Data” option at the bottom right part of the window.
Making A Copy Of The Python Dataset
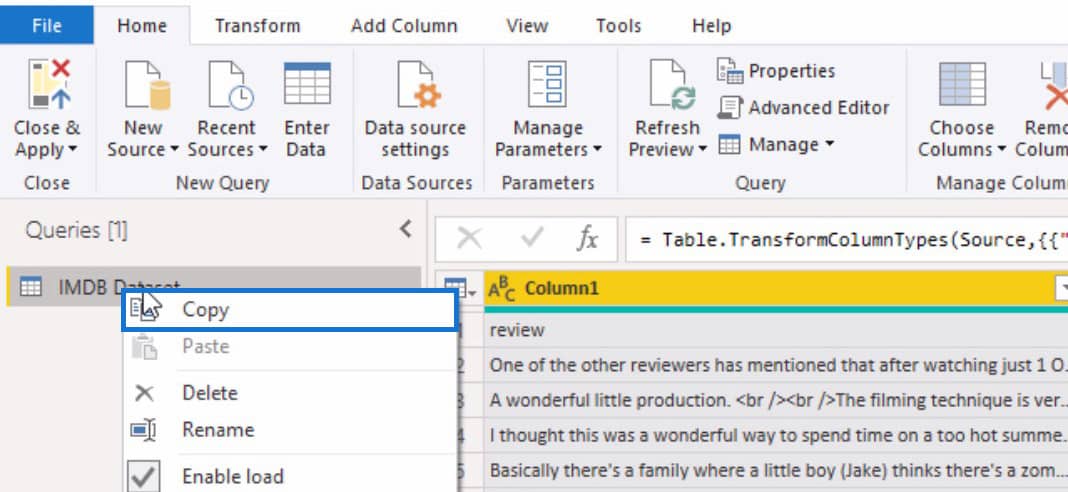
Before we make any changes to this dataset, it’s important to make a copy of the original dataset. To do this, just right-click on the dataset.
Then from the menu, select “Copy”.
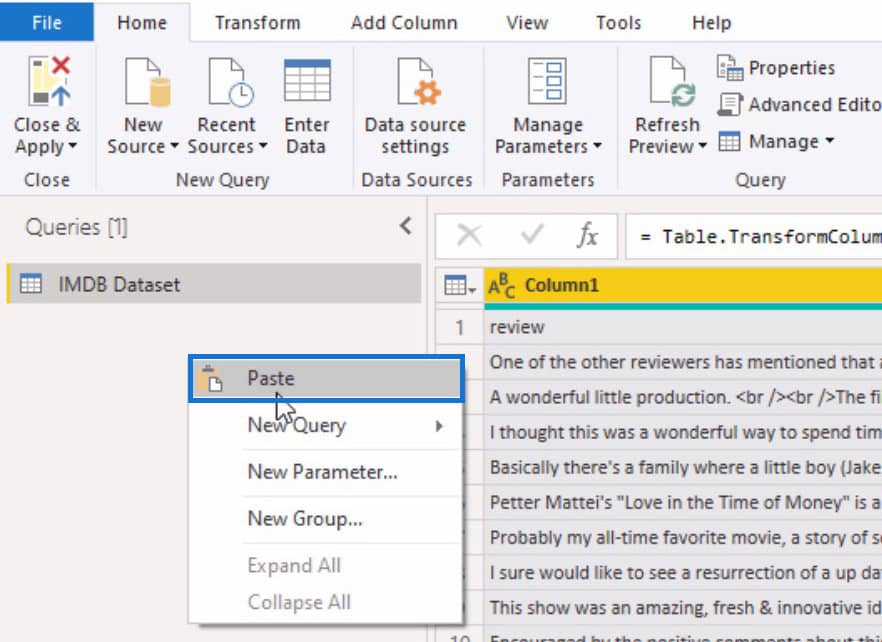
Lastly, right-click on the Queries panel then select “Paste” from the options.
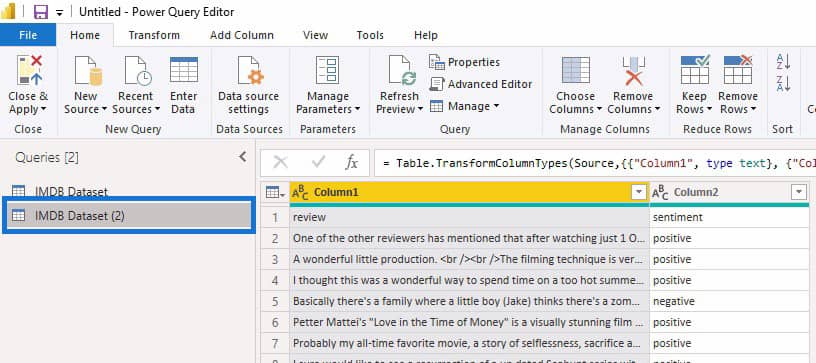
After applying these steps, you should have a copy of the original IMDB Dataset in the Queries panel.
Transforming A Dataset By Running A Python Script
By transforming a CSV file, you’ll be able to break large amounts of Python datasets into smaller ones. We can do that by applying some Python script in this file.
But first, we have to make sure that the headers are properly lined up. Click on the Home menu then look for the “Use First Row as Headers” option and click it.
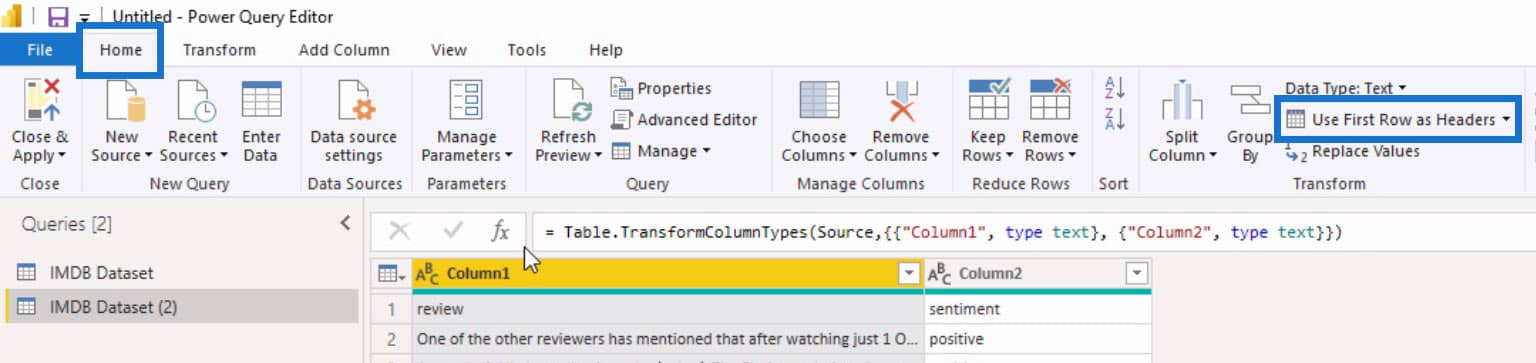
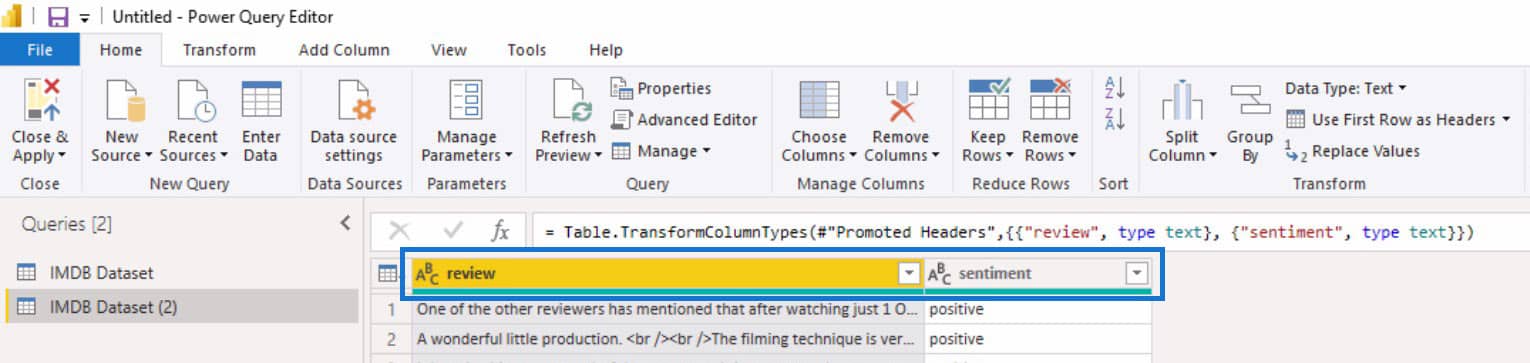
After clicking the “Use First Row as Headers” option, the headers now changed into the data from the previous first rows which are “review” and “sentiment”.
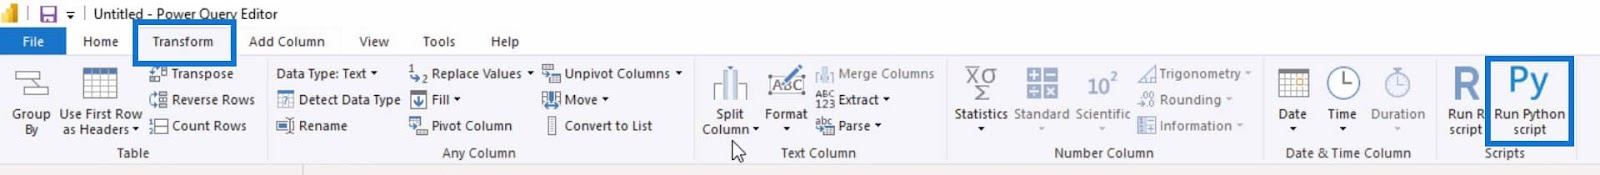
Next, go to the Transform menu and click on the “Run Python Script” option in the “Scripts” group of options.
After that, a “Run Python Script” window will pop up. In this window, you can run any Python script you want in order to transform the current file that you’re using. For this example, I’m going to make the dataset smaller by running the following code.
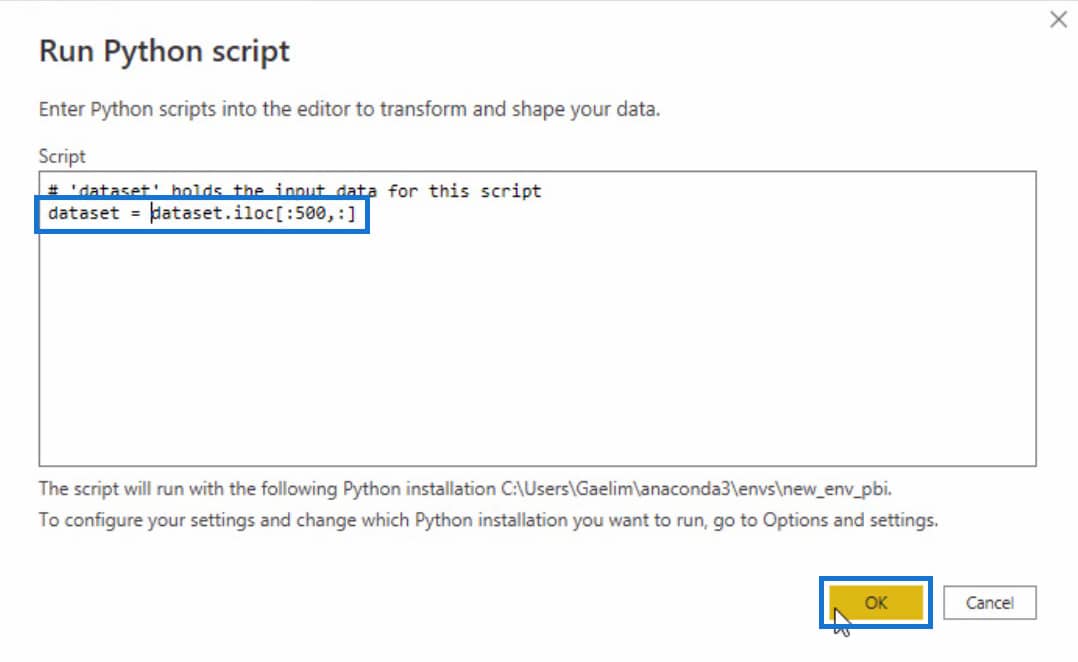
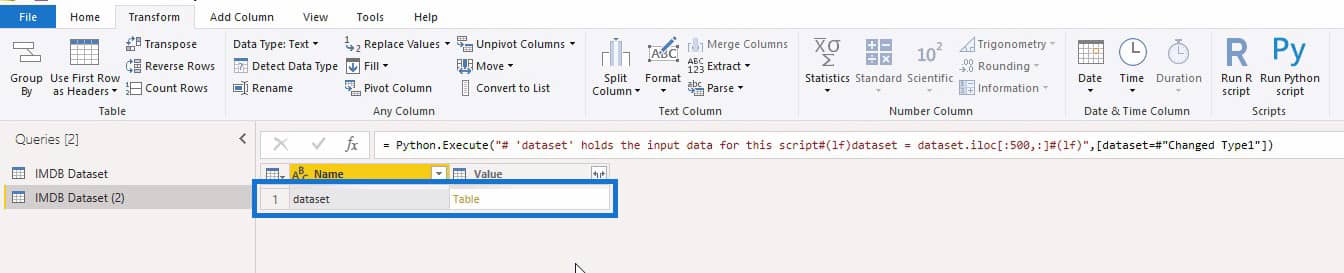
I used the .iloc function on the dataset to select the specific rows and columns from the IMDB Dataset. Then, in the parameters, I selected all the first 500 rows and all columns in the IMDB Dataset. I stored it in a variable named “dataset”.
After executing the script, we should see the “dataset” which is the variable we’ve created in the previous step. It contains the data we’ve altered using the Python script.
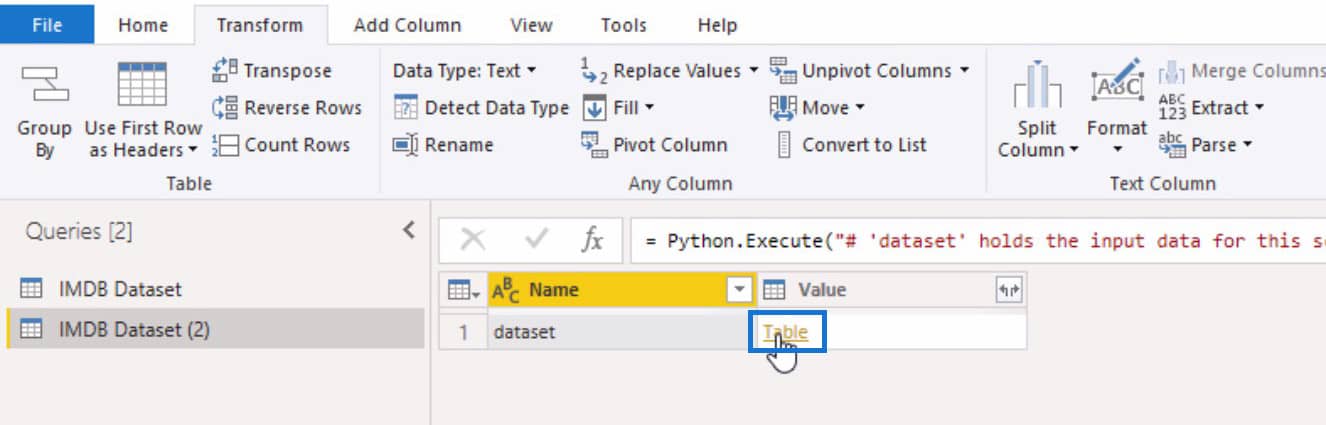
Checking The Dataset
To open the dataset table, just click on “Table” under the Value column.
We can see that this dataset is now down to 500 rows.

Now that we have broken down our Python dataset into 500 rows, the next thing we’re going to do is import the libraries we need. We’ll do that using the same procedure we did in altering the contents of IMDB Dataset. This is to make sure that our code can be manageable in certain scenarios with fewer alterations.
Importing Libraries And Functions Using Repeatable Codes
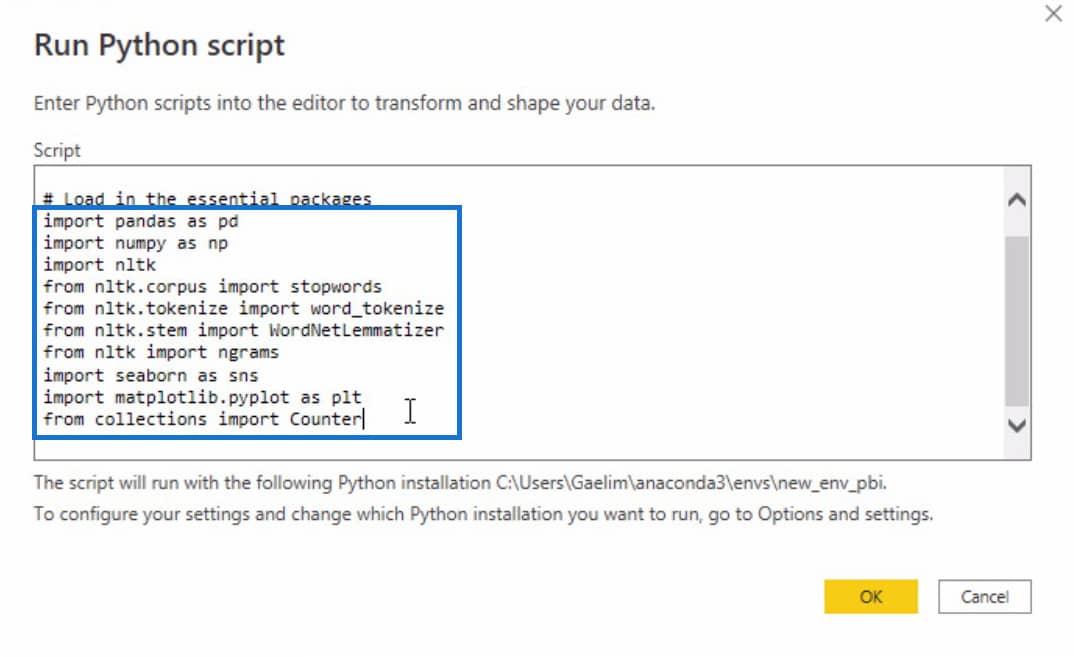
To import the libraries, let’s go back to our notebook and copy the libraries that we need. Keep in mind that prior to this tutorial, I’ve already created these libraries we’re about to copy. I’m just reusing these for you to clearly get the idea about the usage of functions as repeatable codes.

Once the libraries are copied, paste them into the “Run Python Script” window, and don’t forget to include the line “from collections import Counter” at the end of the script.

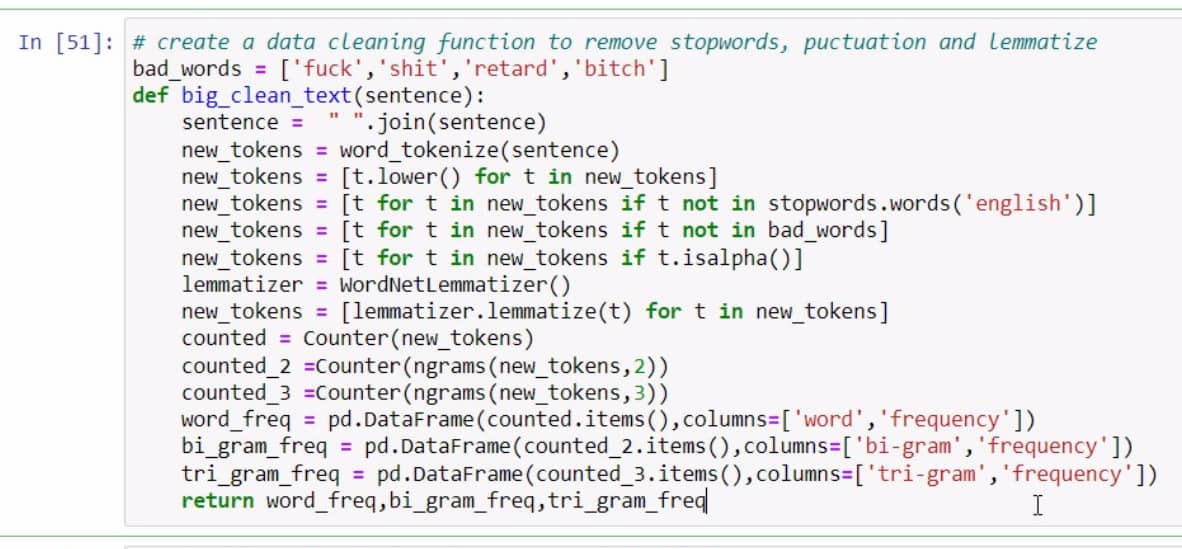
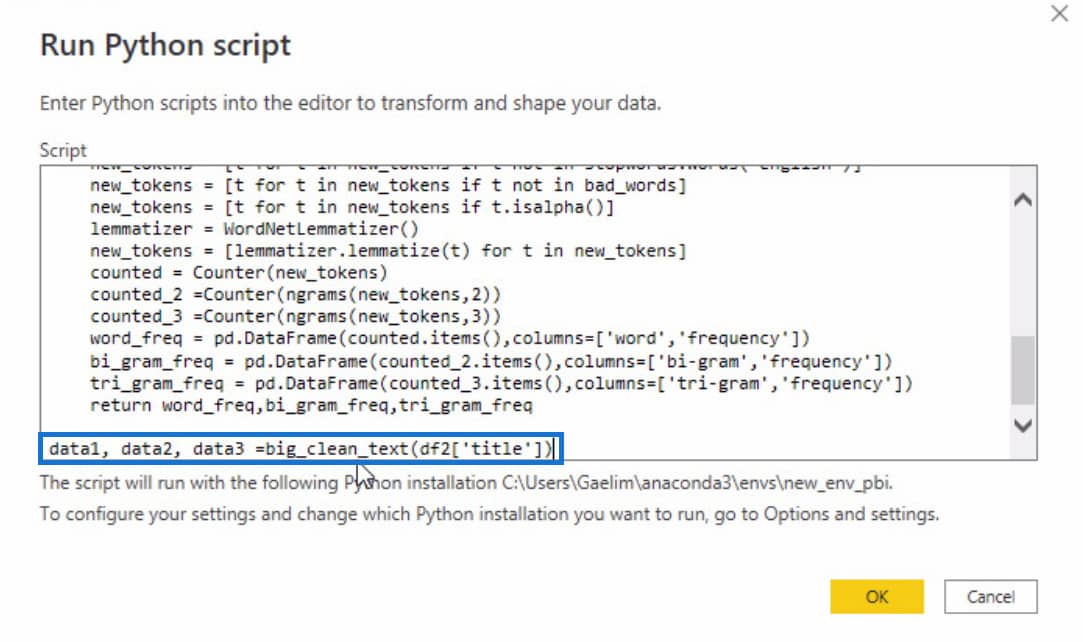
Then we’ll copy the data cleaning function from our notebook and add it to the Python script in Power BI.
We’ll add it below the libraries.

We’ll also copy the code for calling the function that we just added.

Then paste it into the Python script in Power BI.
Generating Data Tables
Now that we’ve added the code for calling the data cleaning function, we need to change “df2” into “dataset” and the “title” to “review”. We did this due to the changes we’ve made in the dataset.
We changed “df2” to “dataset” because we stored the data with 500 rows in “dataset”. Then for “title”, we updated it to “review” as a result of changing the headers of the columns.
With these codes added, we should be able to get or generate 3 tables which are data1 for word frequency, data2 for bigram frequency, and data3 for trigram frequency.
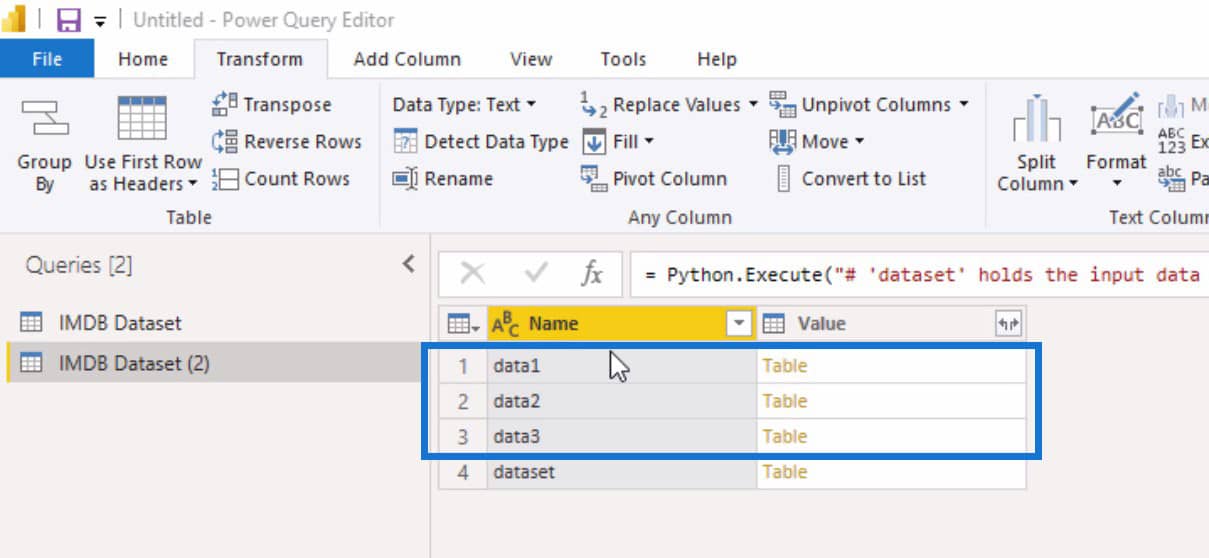
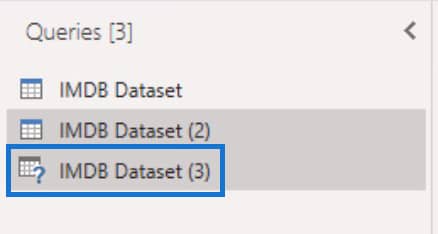
You can also make another copy of this altered IMDB Dataset (2) to open another table later on.
Now in IMDB Dataset (2), let’s open the data1 table.

Once the data1 table is opened, we can see the list of words as well as the frequency.

As you can see, we’re able to perform certain procedures from the main dataset with the use of repeatable codes that we took from the Jupyter Notebook. With those repeatable codes, we’re able to transform a Python dataset and generate a table for word frequency, bigram frequency, and trigram frequency without typing the codes all over again.
In IMDB Dataset (3), let’s open the data2 table to see the bigram frequency.
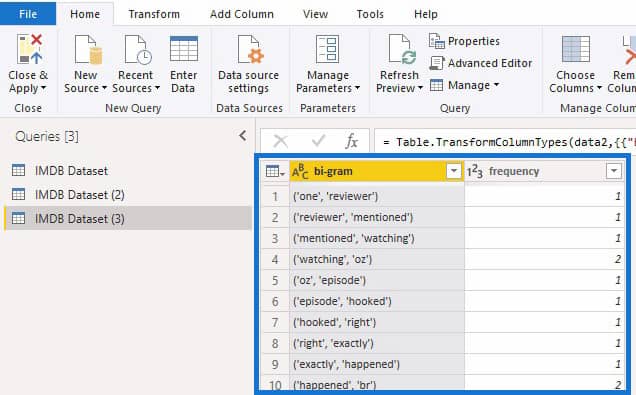
In the bigram frequency table, you can see the “br” included in the list. This is probably connected to an HTML code. We can simply go back and add something else but we’re not going to do that in this tutorial.
Now that the data has been loaded with the help of the repeatable codes, we can start making visualizations about it in Power BI. For example, a bar graph for the frequency of each word.

***** Related Links *****
Python User Defined Functions | An Overview
Python List And For Loops In Power BI
Using Python In Power BI | Dataset And String Function

Conclusion
To sum up, repeatable codes can help you in performing certain procedures on a dataset with less effort. You’ve learned how to utilize repeatable codes to transform a Python dataset in Power BI. You were also able to use the .iloc function to specify the rows and columns to be selected in altering a dataset.
In addition, you’ve created copies of datasets and created a visualization using a bar graph. This visualization is based on the Python datasets that we’ve created and altered with the help of repeatable codes.
All the best,
Gaellim


")