
Today, you will learn how to create your perfect Power BI template file that is configured to your preferences and settings. This will save you 20 to 30 minutes every time you start up a Power BI report and will make Power BI work exactly the way you want it to. You can watch the full video of this tutorial at the bottom of this blog.

Choosing A Color Theme
Let’s start with a color theme. To use a custom Enterprise DNA color theme, go to View and then Browse for themes.
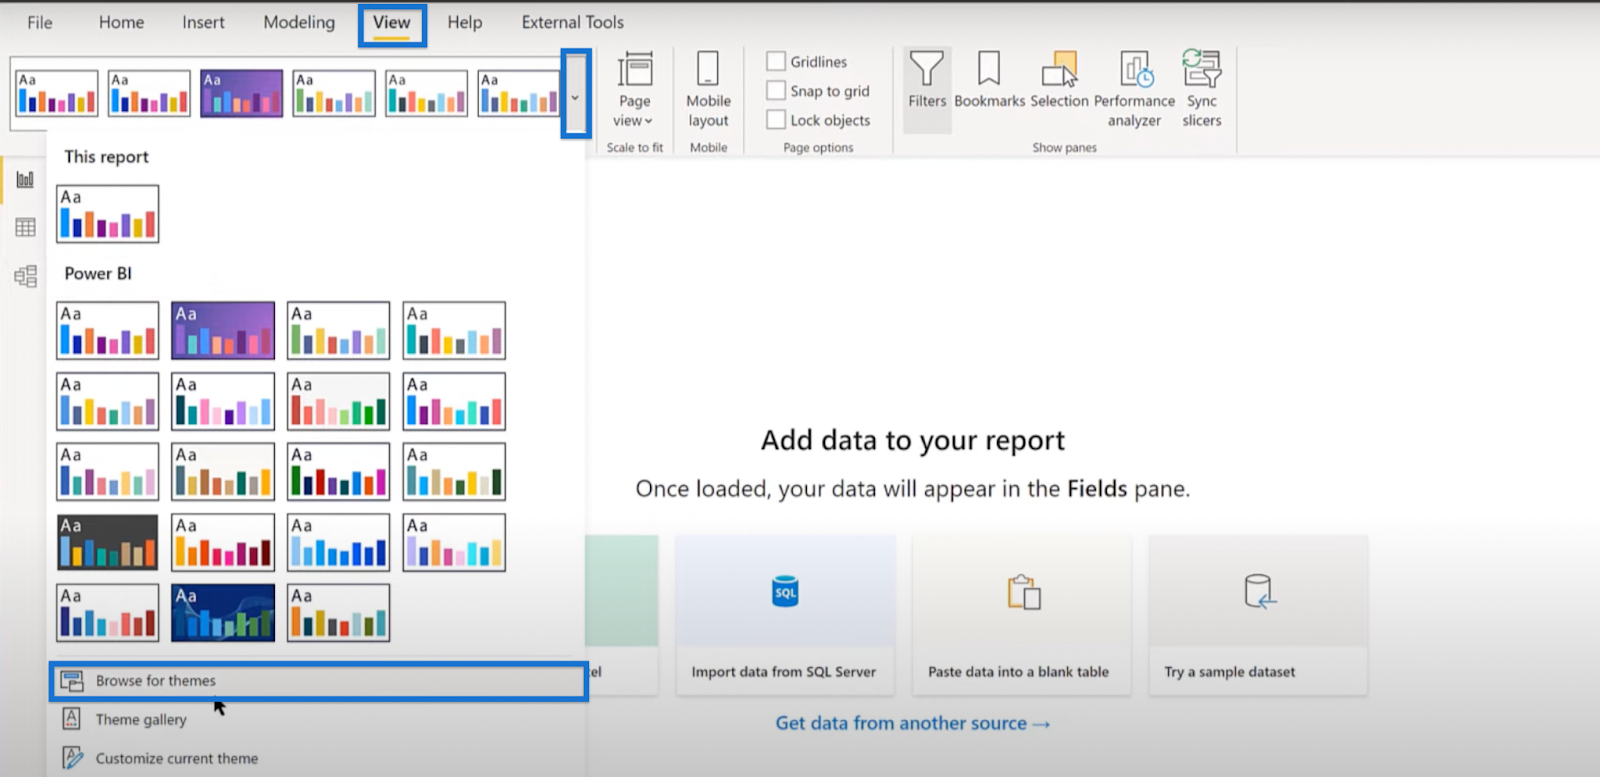
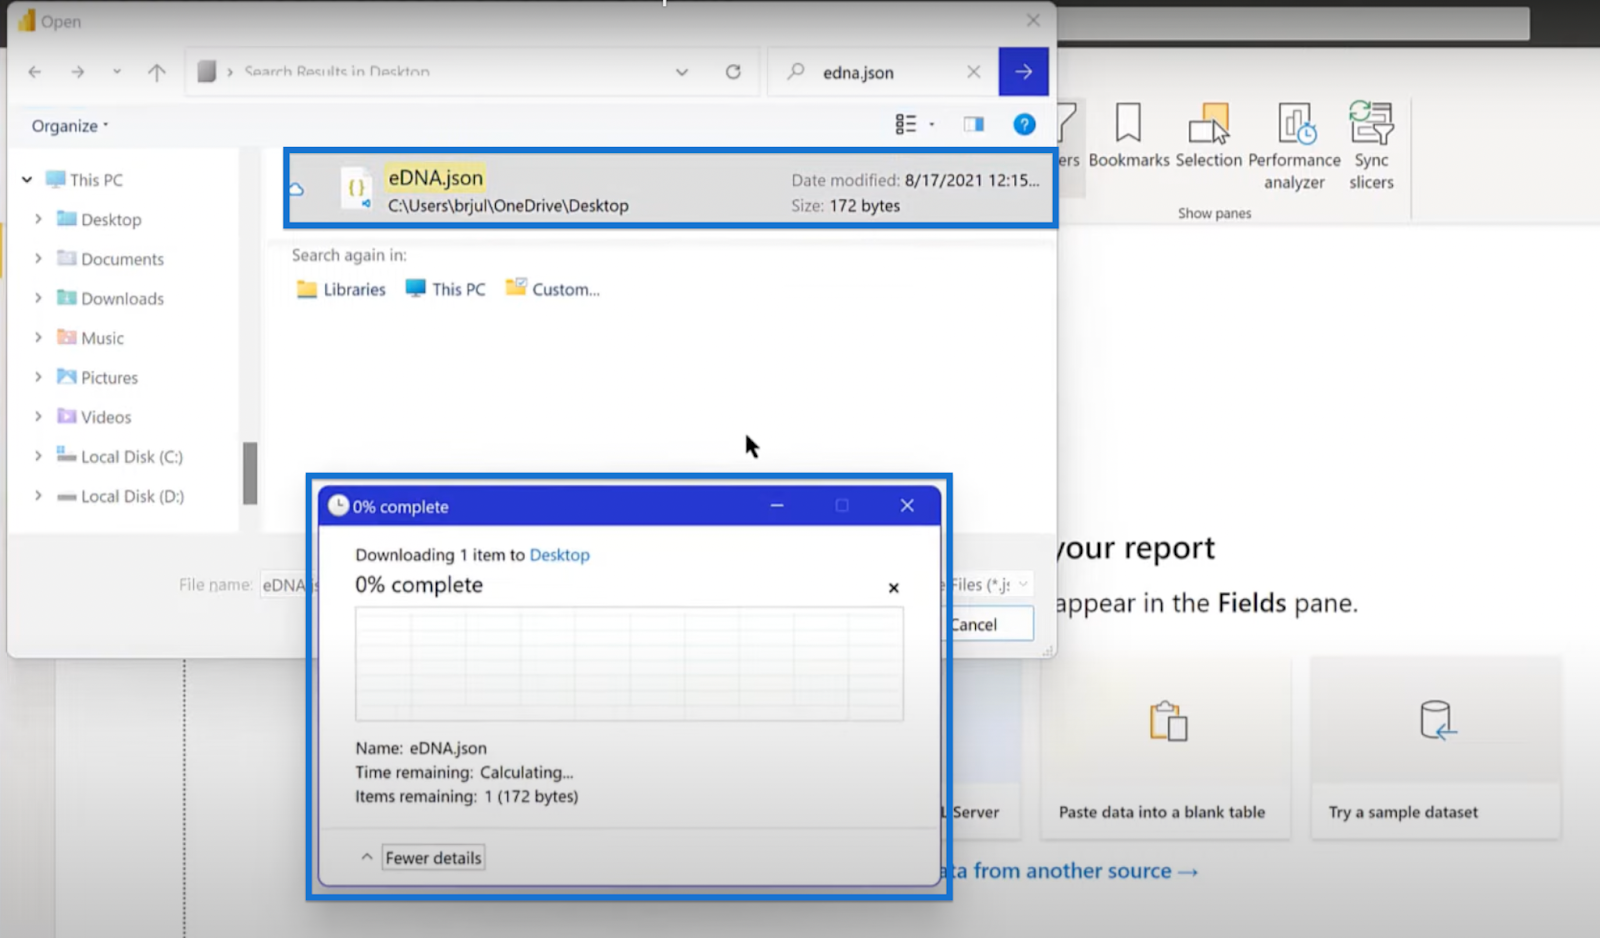
Search for the eDNA.json file and click open to successfully import the theme.
Creating A Key Measures Table
I always like to put my measures in a measures table. To create a key measures table, click Home and Enter Data.

Rename the table in the dialogue box that will appear. Type Key Measures Table in the name field, and click Load. This will open the Fields pane.

Setting The Date Table
The next step is to create a date table. I always recommend using Melissa de Korte’s extended date table, but I like a particular version that uses a day offset in addition to all the fields she incorporates.
I’ve published this version to the analyst hub, which you can access by heading to External Tools and clicking Analyst Hub.
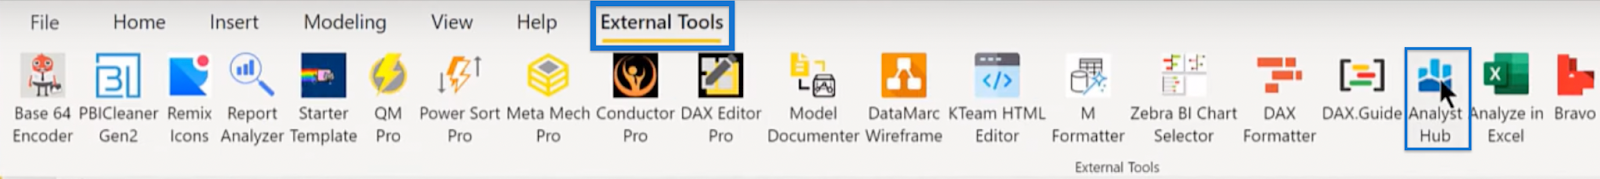
In the Analyst Hub, go to Community and open EDNA Extended Date Table with DayOffset.

Open the file and click Copy Code.
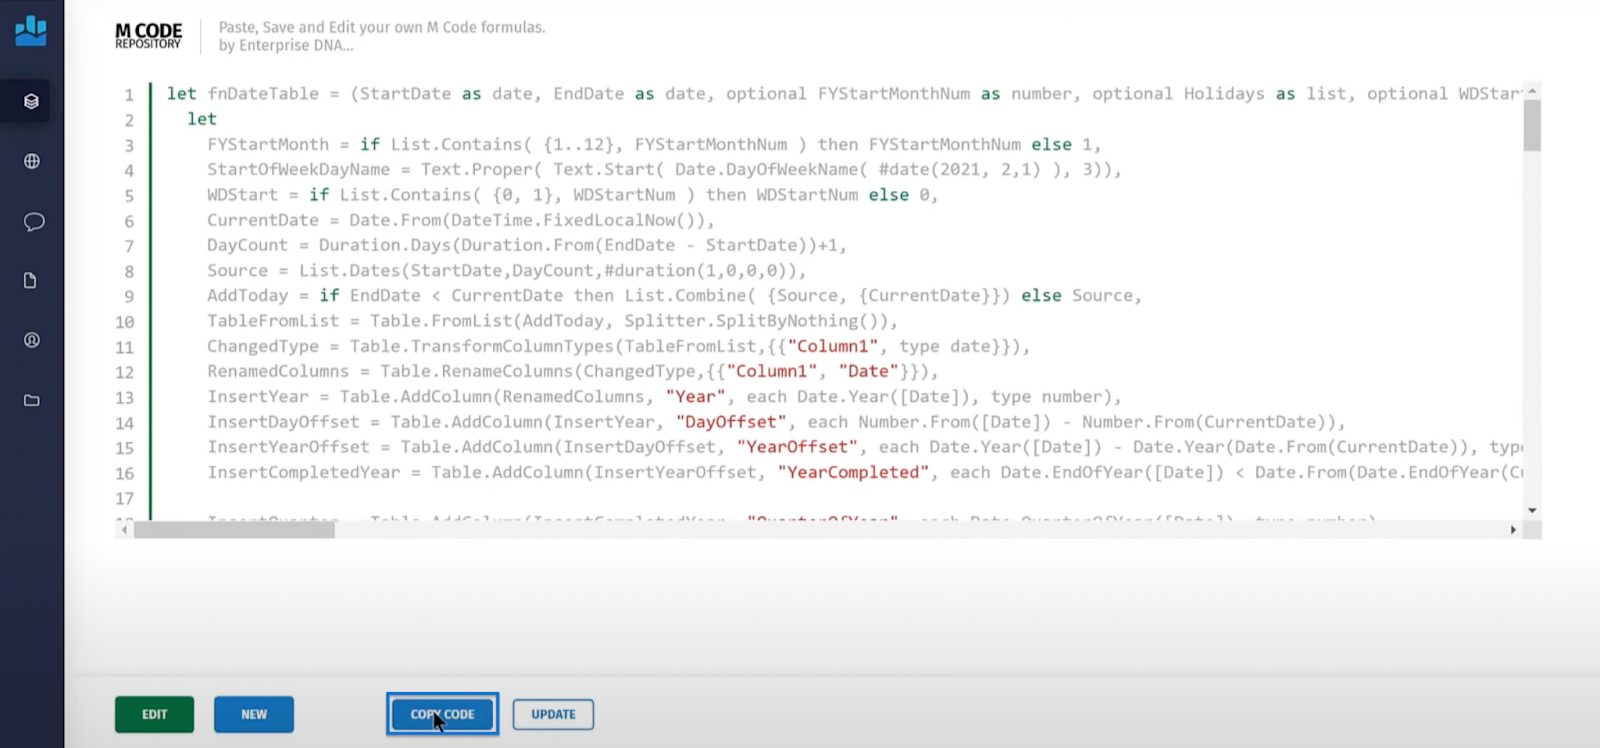
Then, open Power BI and go to Power Query by clicking Transform Data.
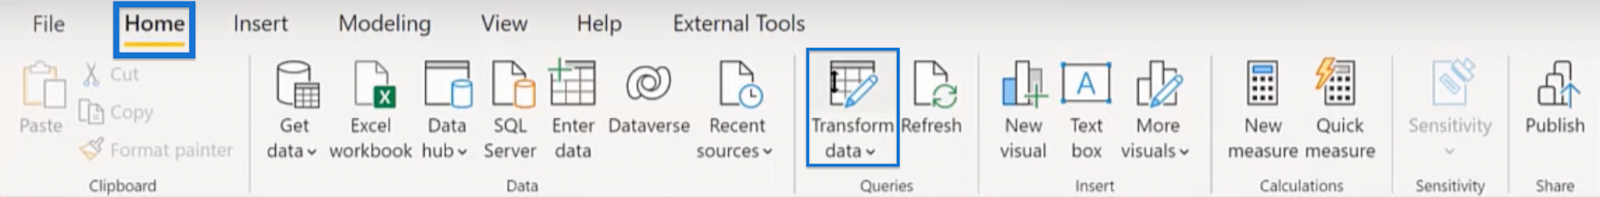
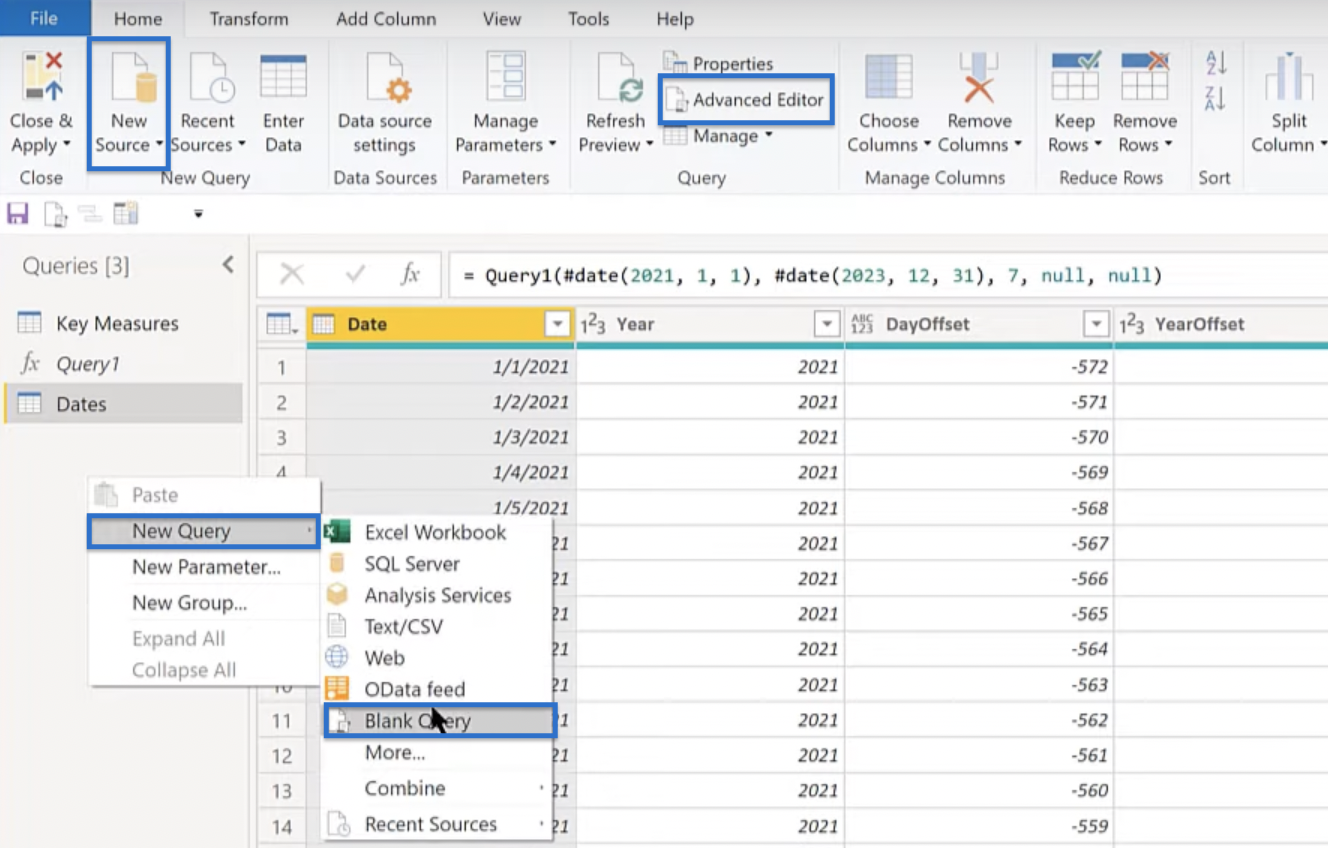
Click New Source and choose Blank Query in the dropdown. Then, open the Advanced Editor.
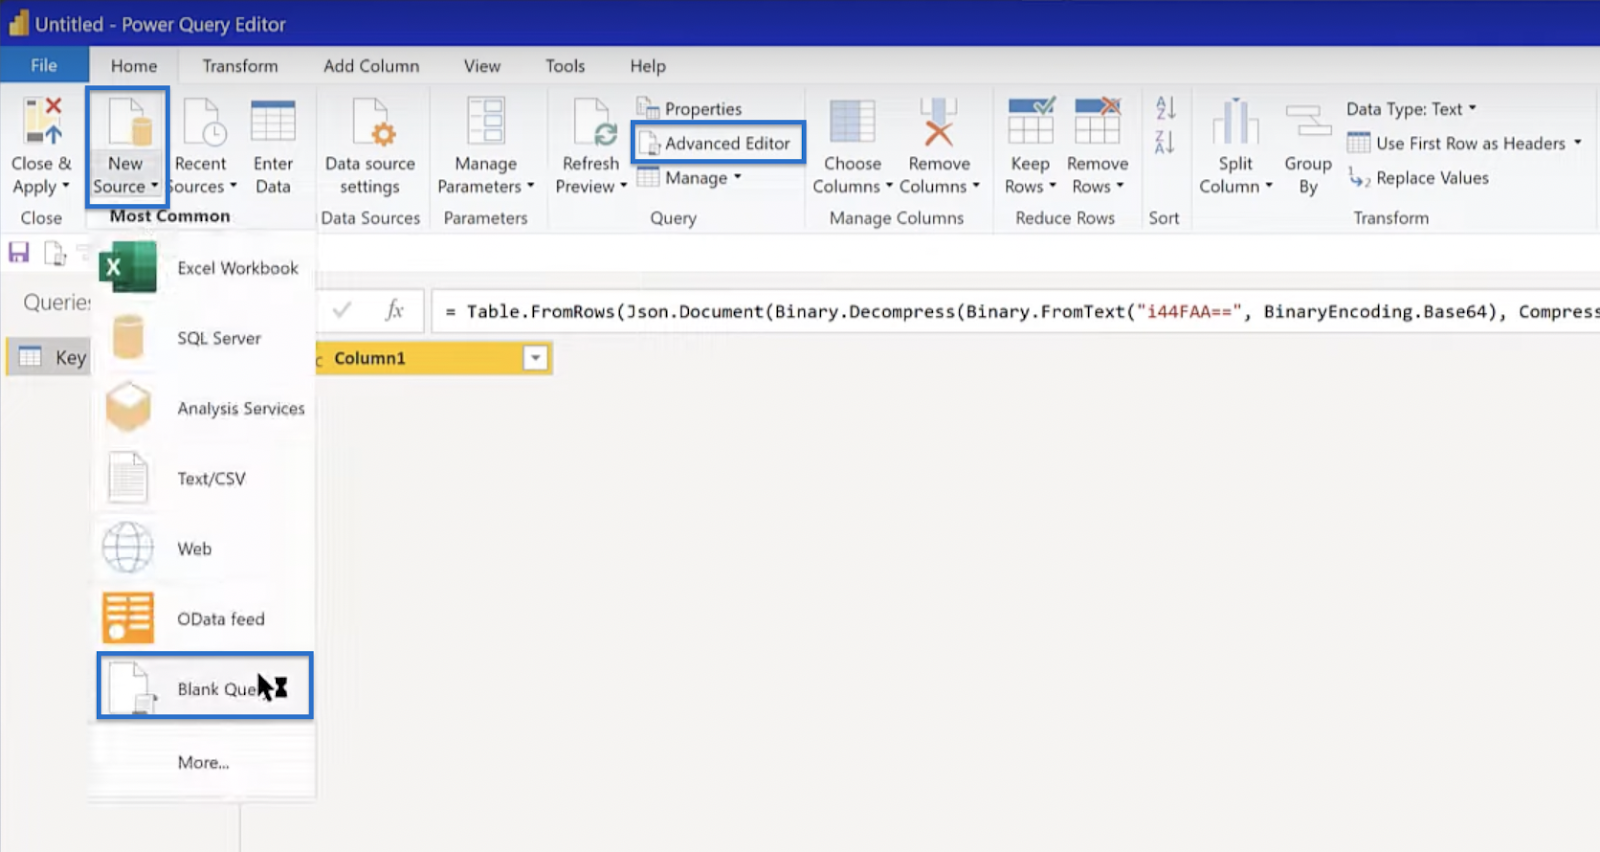
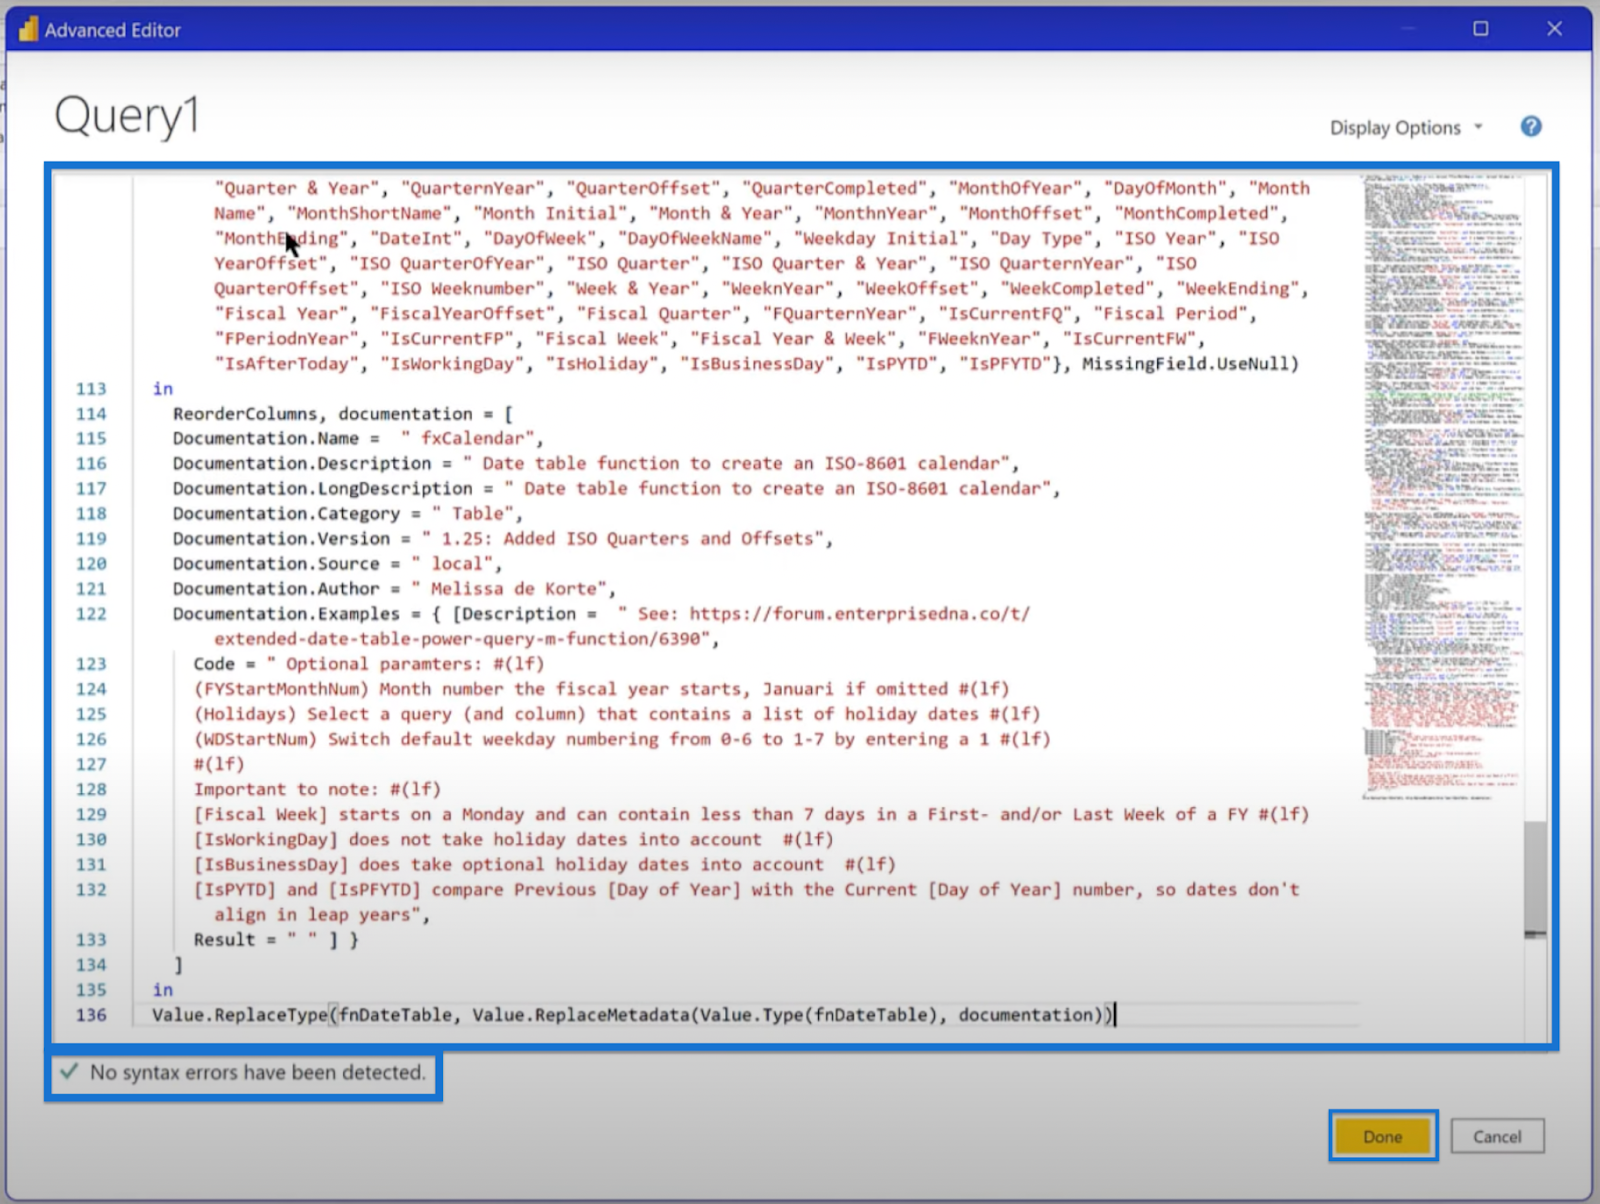
An initial code will show up. Delete this code and paste the code that you copied. Click done if there is no syntax error.
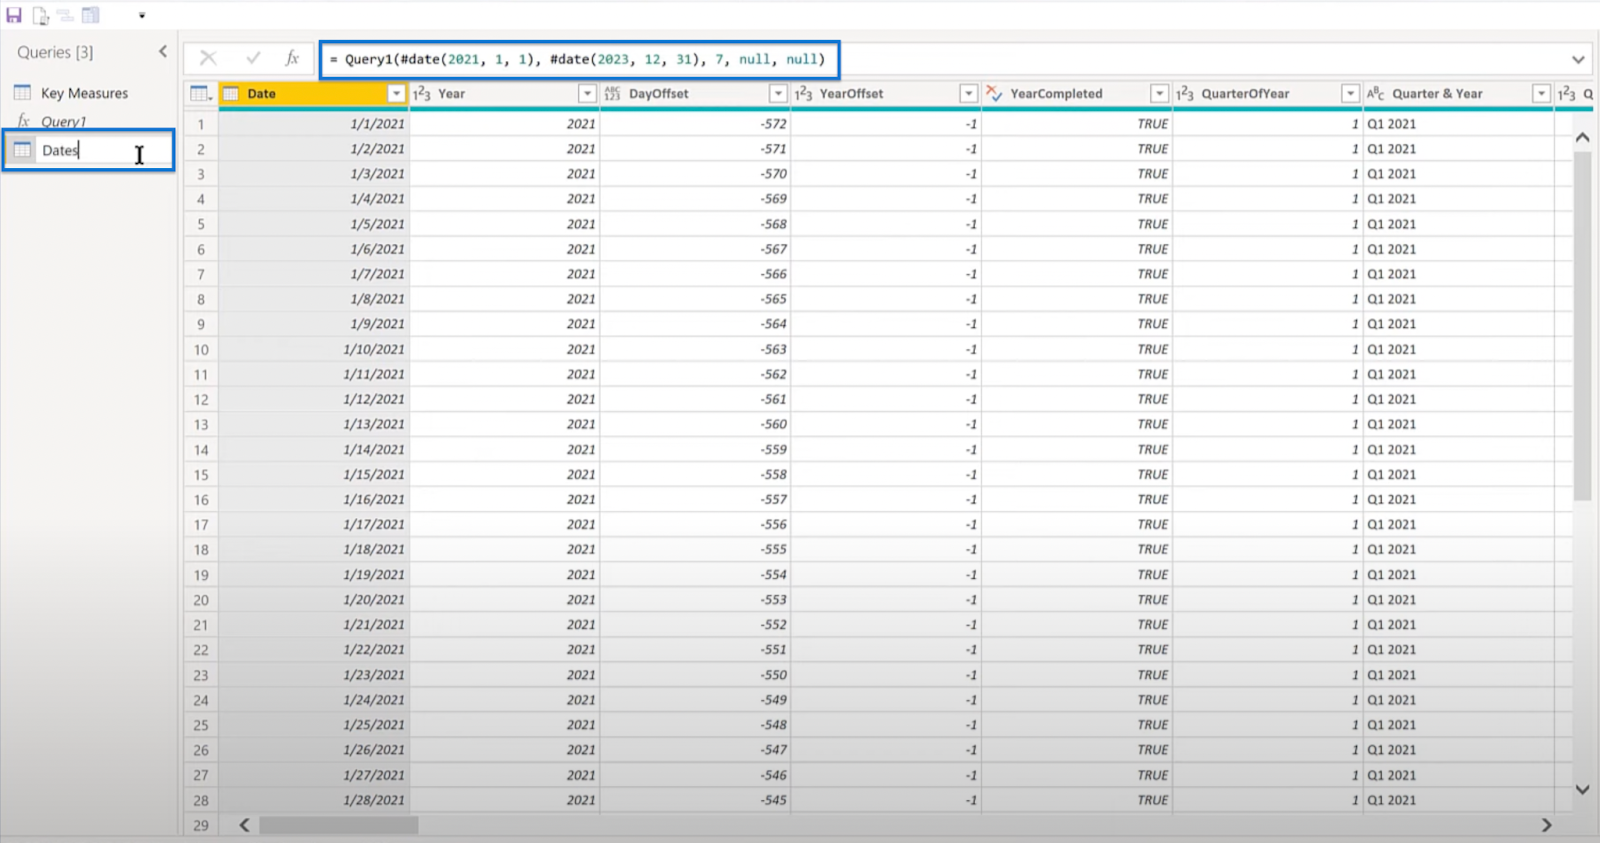
You cannot know exactly what the start and end dates are for every report that you will be doing. So what you can do is create a three-year table starting with the previous year (January 1st), ending the next year (December 31st), and with the fiscal year starting in July. Then, click Invoke.

You can always extend or shorten the parameters in the formula bar quickly. You simply change it to a date table as shown in the image below.
Even though Power BI has added a NETWORKDAYS function, I recommend the version that Imke Feldmann developed. His version incorporates directly into Power BI as an offset.
To use this version, go back to the Analyst Hub and go to the Community repository. Search for Imke Feldmann Networkdays Offset Custom Function and open the file.

Copy the code back to Power Query.

Create another blank query by right-clicking on the left side pane and choosing New Query then Blank Query.
Next, open the Advanced Editor and paste the function.

Rename it to fxNetworkday.

The next step is to go to your date table, Add Column, and Invoke Custom Function.
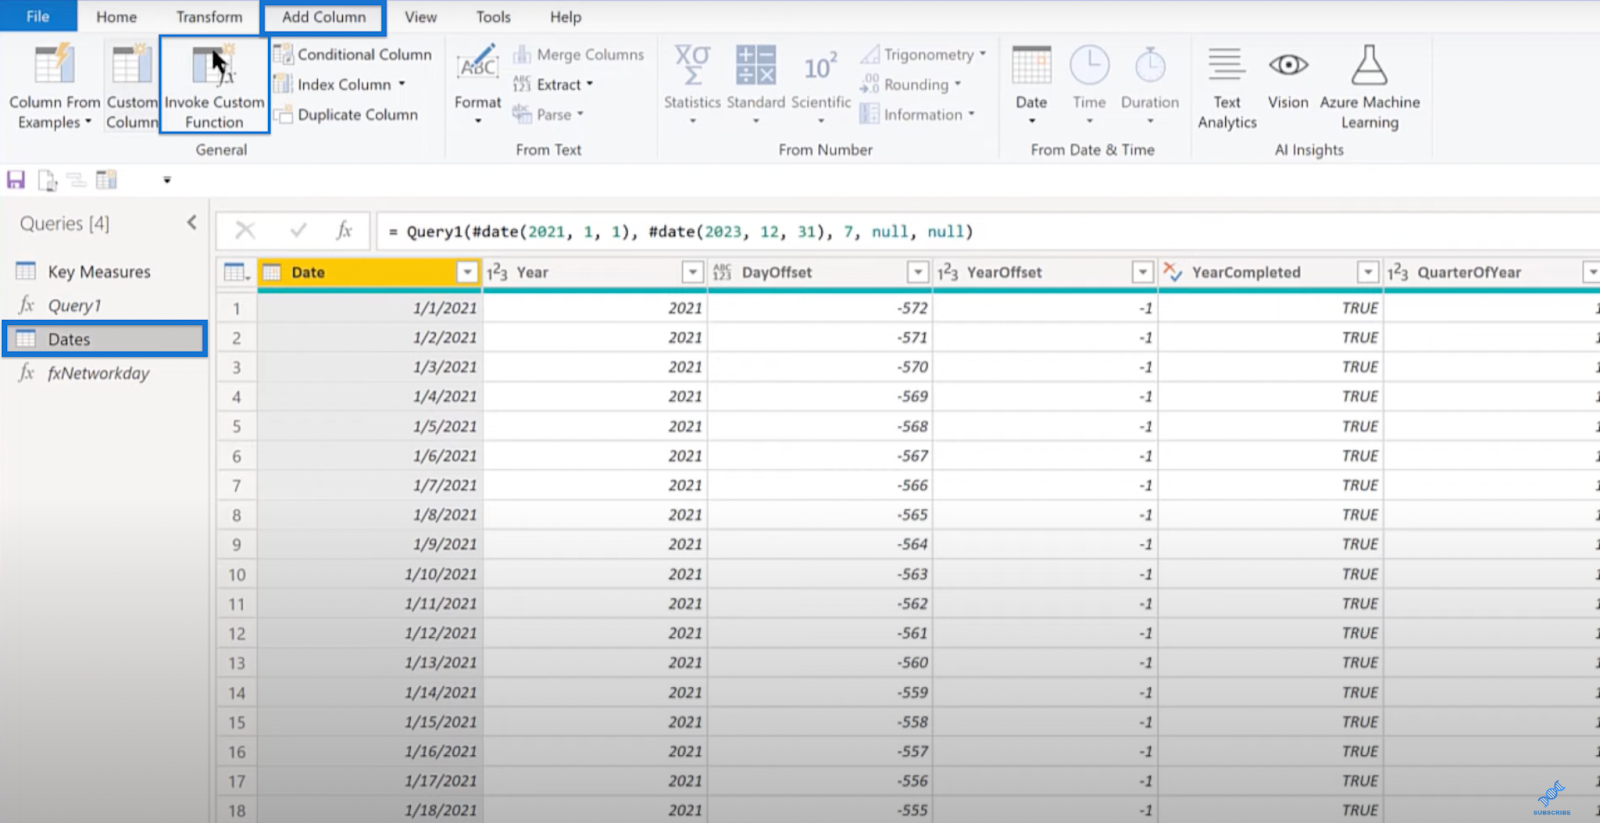
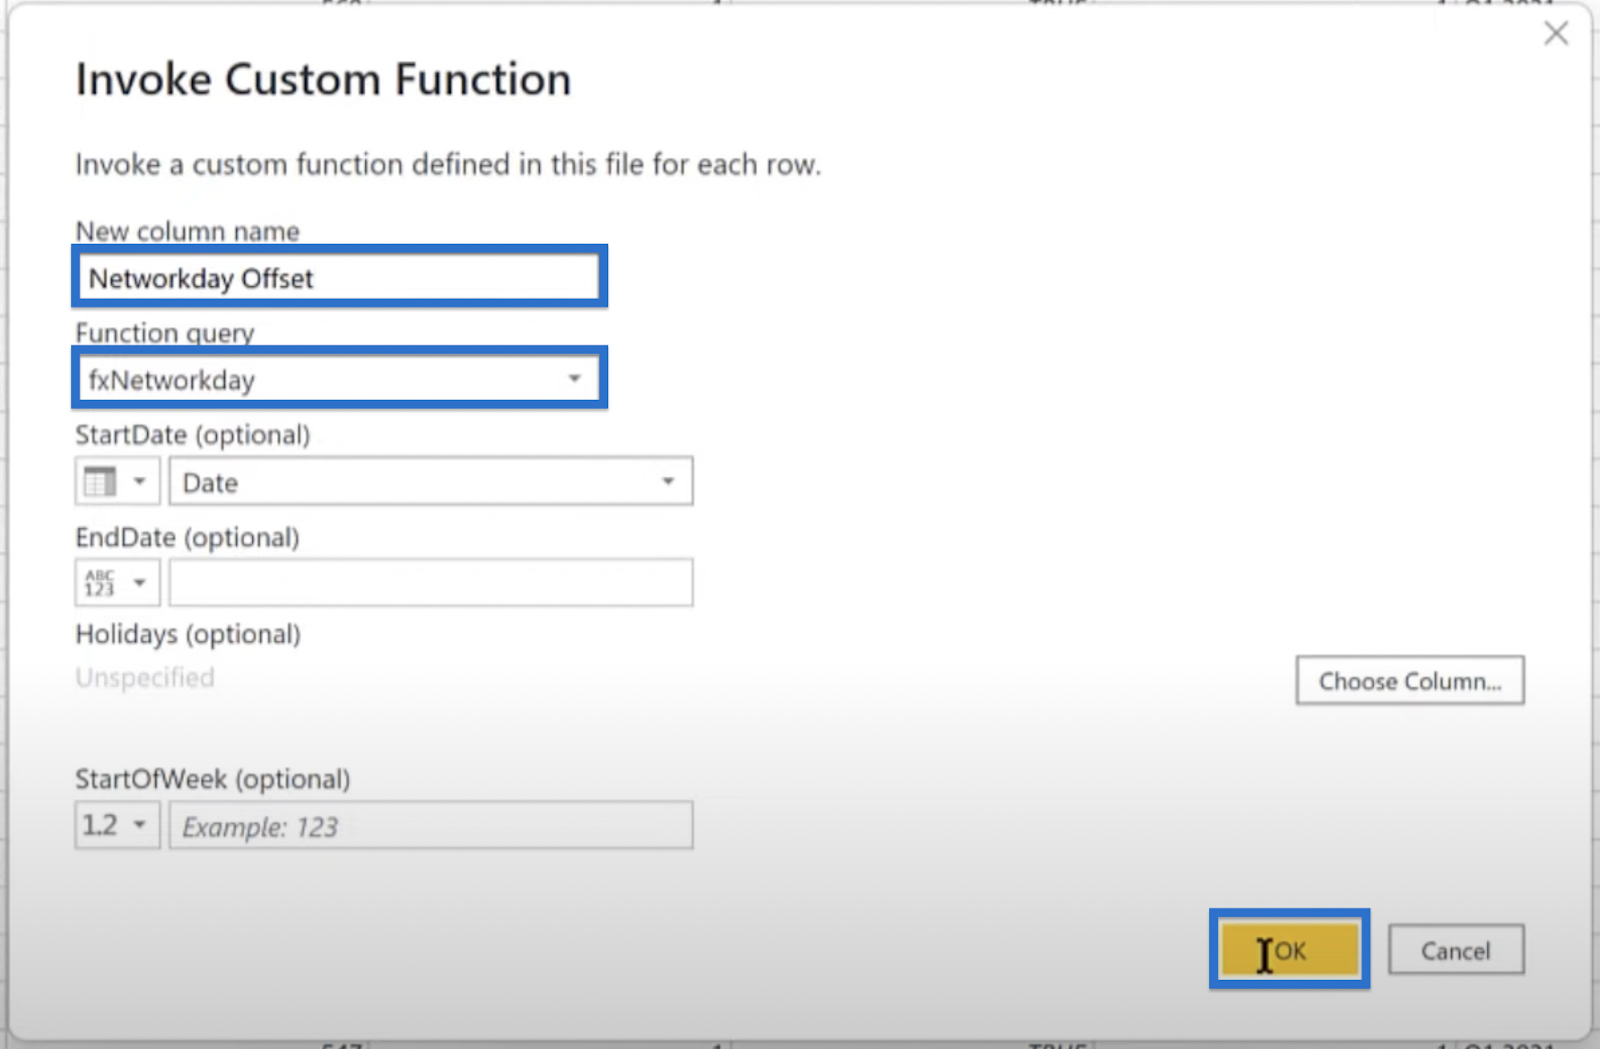
Then invoke fxNetworkday, create a column called Networkday Offset, and click OK. Your Networkday Offset should be good to go.
If you’ve reached this part, you’re making good progress on your Power BI template. To continue, set the Key Measures up as a new group by scrolling to Key Measures, Move to Group, then New Group. For the purpose of this tutorial, call the new group Data Model and click Okay.

Move the date table (Dates) to the Model. That does it for Power Query, so you can now Close & Apply.


Your date table should start loading at this point. Always remember to mark your date table by clicking Date, Mark as date table, and selecting our date field as shown in the image below. This is necessary to get your time intelligence functions working properly.

Refining The Options
To edit the options, go to the File tab and open Options and settings.

There are a number of options that I recommend turning off. I detest the Auto detect new relationships after data is loaded because it creates a ton of problems with the model.
Also, turn off Import relationships from data sources on first load. These options can be found under Current File then Data Load in the left pane.

In the Report settings, check Change default visual interaction from cross highlight to cross filtering and Use modern visual tooltips with drill actions and updated styling.


Using External Tools
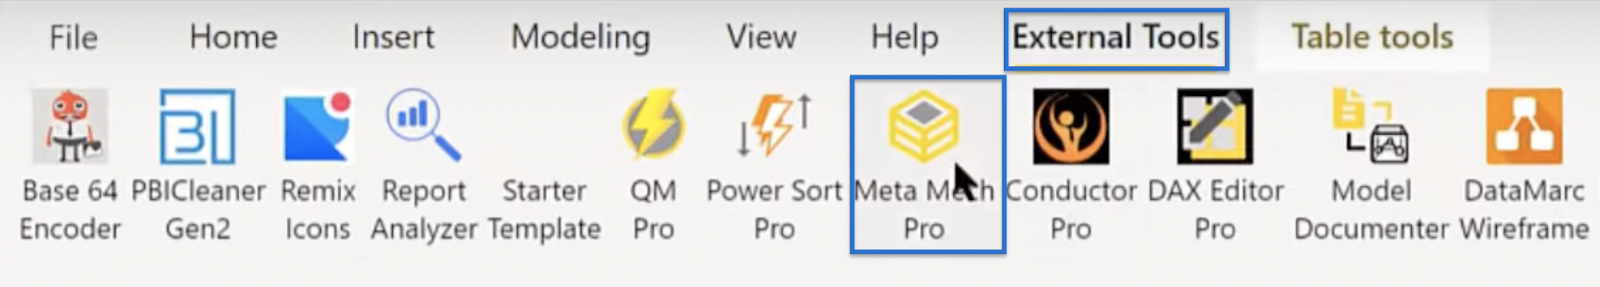
Power BI features numerous external tools available for use. In this tutorial, you will use some of the custom Enterprise DNA external tools.
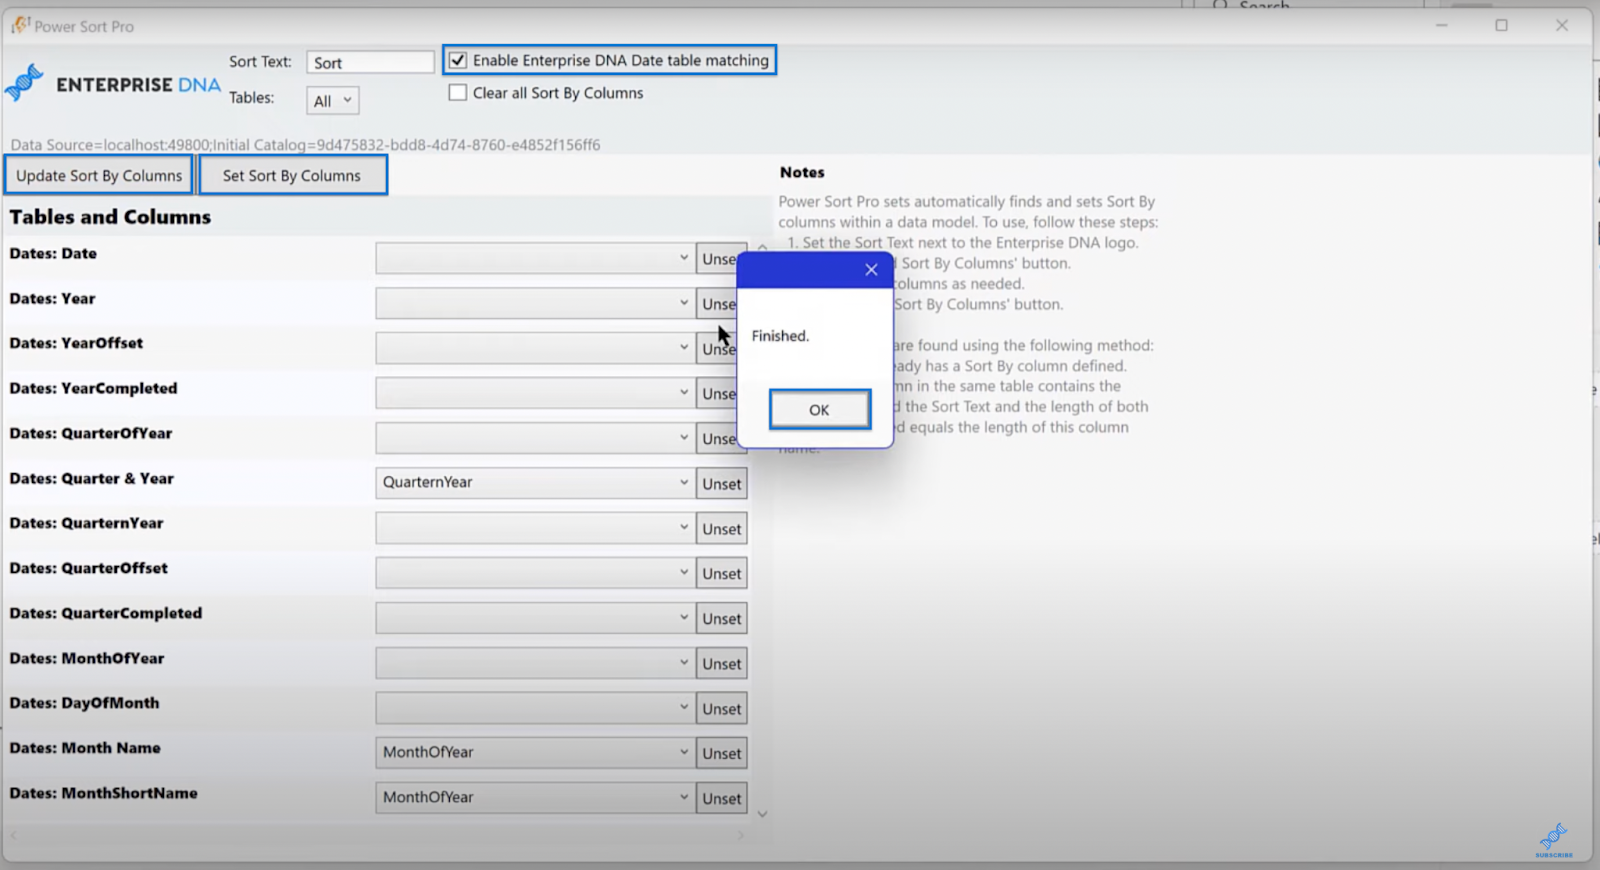
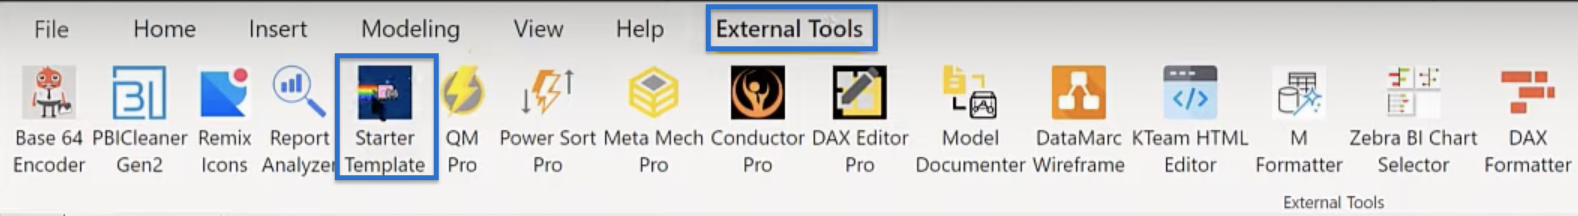
After changing the options, the next thing to do is use external tools to further modify your date table. So, go to External Tools and start with the Power Sort Pro.
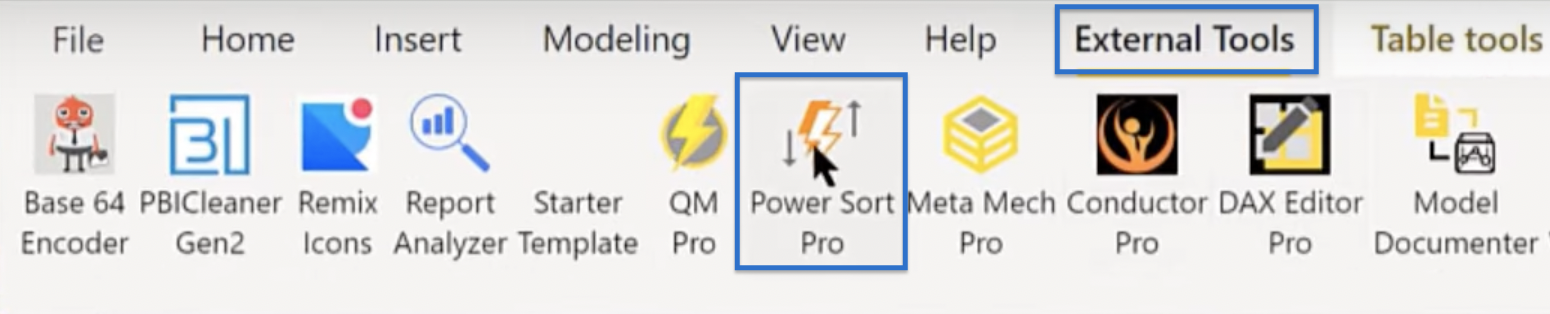
What this tool does is enable Enterprise DNA date table matching. With this tool, if you click Find Sort By Columns and then Set Sort By Columns, it automatically goes through your date table and sets each column to its proper sort column.
You no longer have to do any manual setting aside from the three clicks. A pop-up window saying Finished will show up.
The second external tool that you will use is Meta Mechanic Pro. Click on it and set some defaults in your metadata.
What you need to do is make all your dates in short-date format by clicking the corresponding checkbox. Also, turn off all the aggregations on your numeric fields (whole numbers, double numbers, and decimal numbers).
I recommend doing this because I believe auto-sum just creates a ton of problems. Finally, choose Key Measures in the drop-down under All Measures and check the box as shown in the image.
Click Get Metadata and Set Metadata. A success window will show up.

If you look at your dates table after this step, you will see all the aggregations are turned off and your dates are all in the proper format. It takes a little bit of time for that to update, so you may need to wait for a while.

Modifying The Data Visualization Pane
You are almost done! One of the last things you need to do is modify the visualization pane.

For example, I think the pie charts do not look good, and I don’t want them on my visualization pane. So, unpin that visual by clicking on the Pie Chart icon, choosing Unpin this visual, and confirming in the resulting window. Also, unpin the Azure Map.
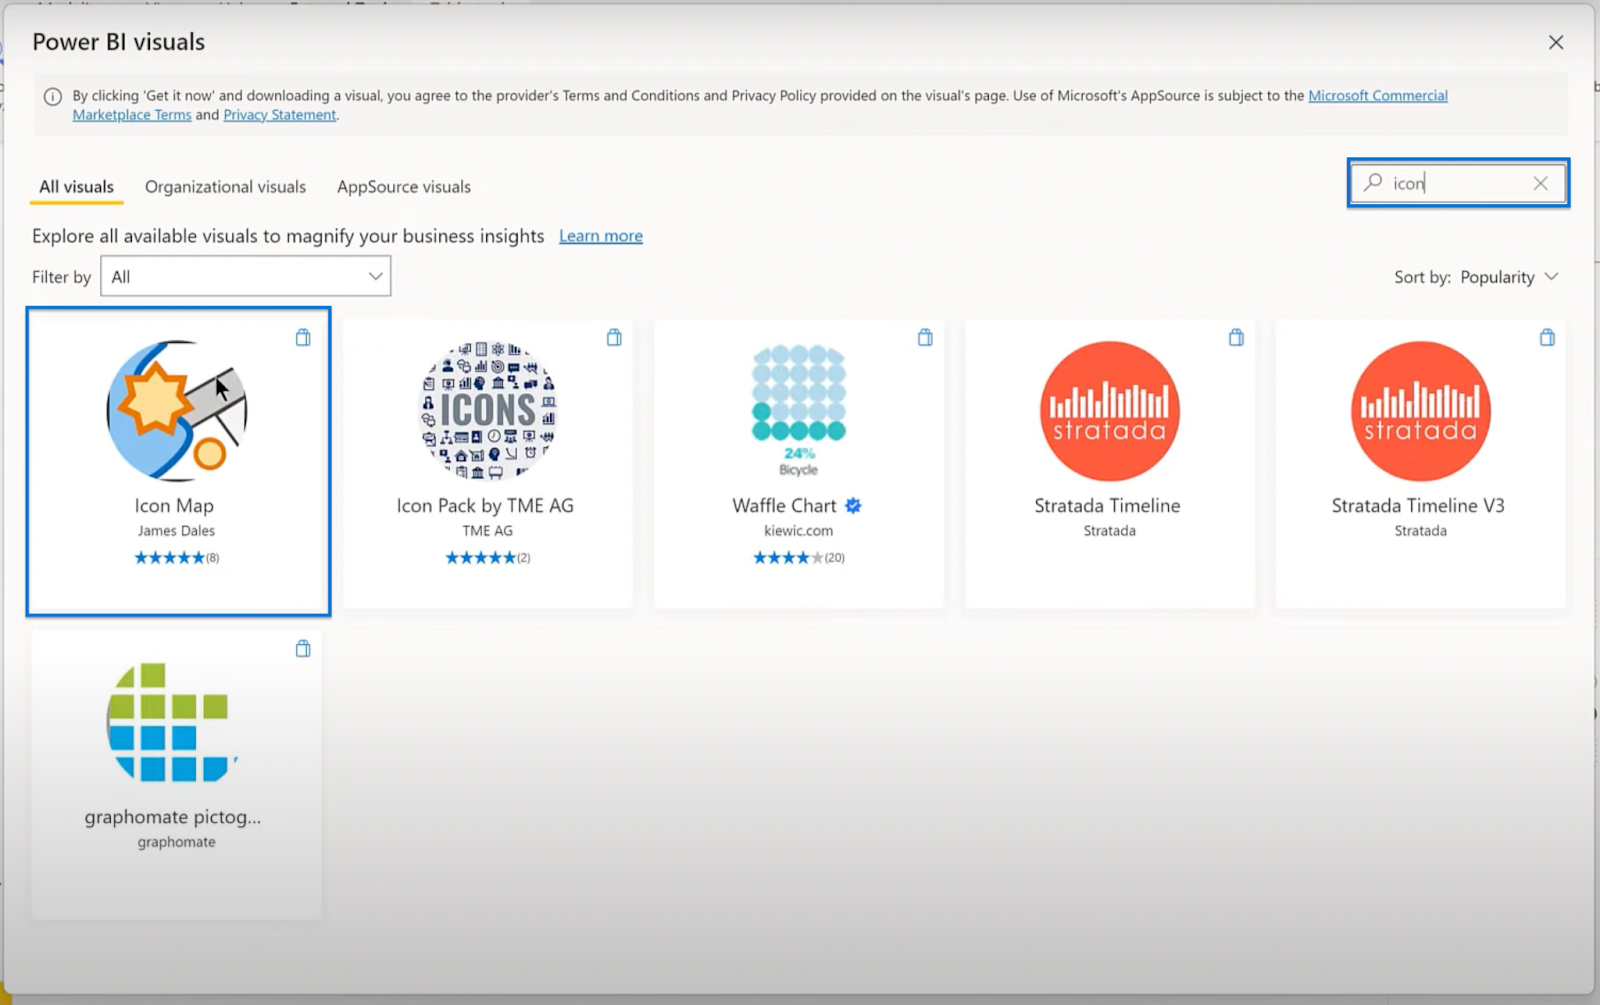
James Dale’s Icon Map is a better map visual, so you will use that as the replacement.

To do that, click the three dots (…) under the Build visual pane and click Get more visuals.

The screen will load and take you to AppSource. Search for Icon Map in the search bar, click on the appropriate result, and then Add.
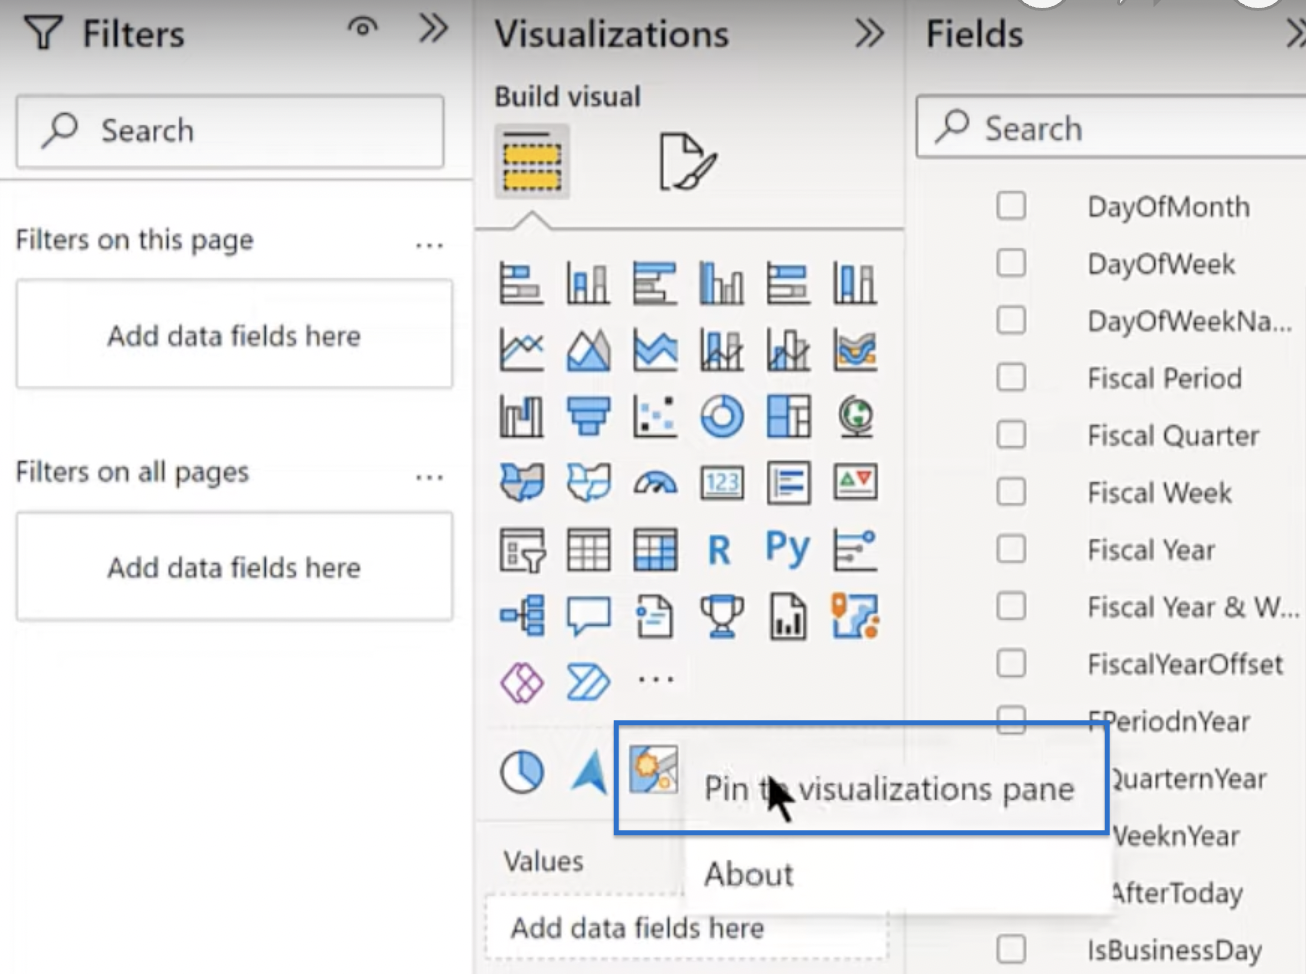
Once added, you can set it as the default visual by clicking on the Icon Map and then Pin to visualizations pane. After this step, every time you open the file to start off Power BI, it will start off with that visual.
There are other visuals that you may include in the defaults, such as Deneb, HTML, CSS, and Zebra BI visuals. You can use them as options to configure the pane based on your preferences, but you will not go through them in this tutorial.
Creating A Blank Button
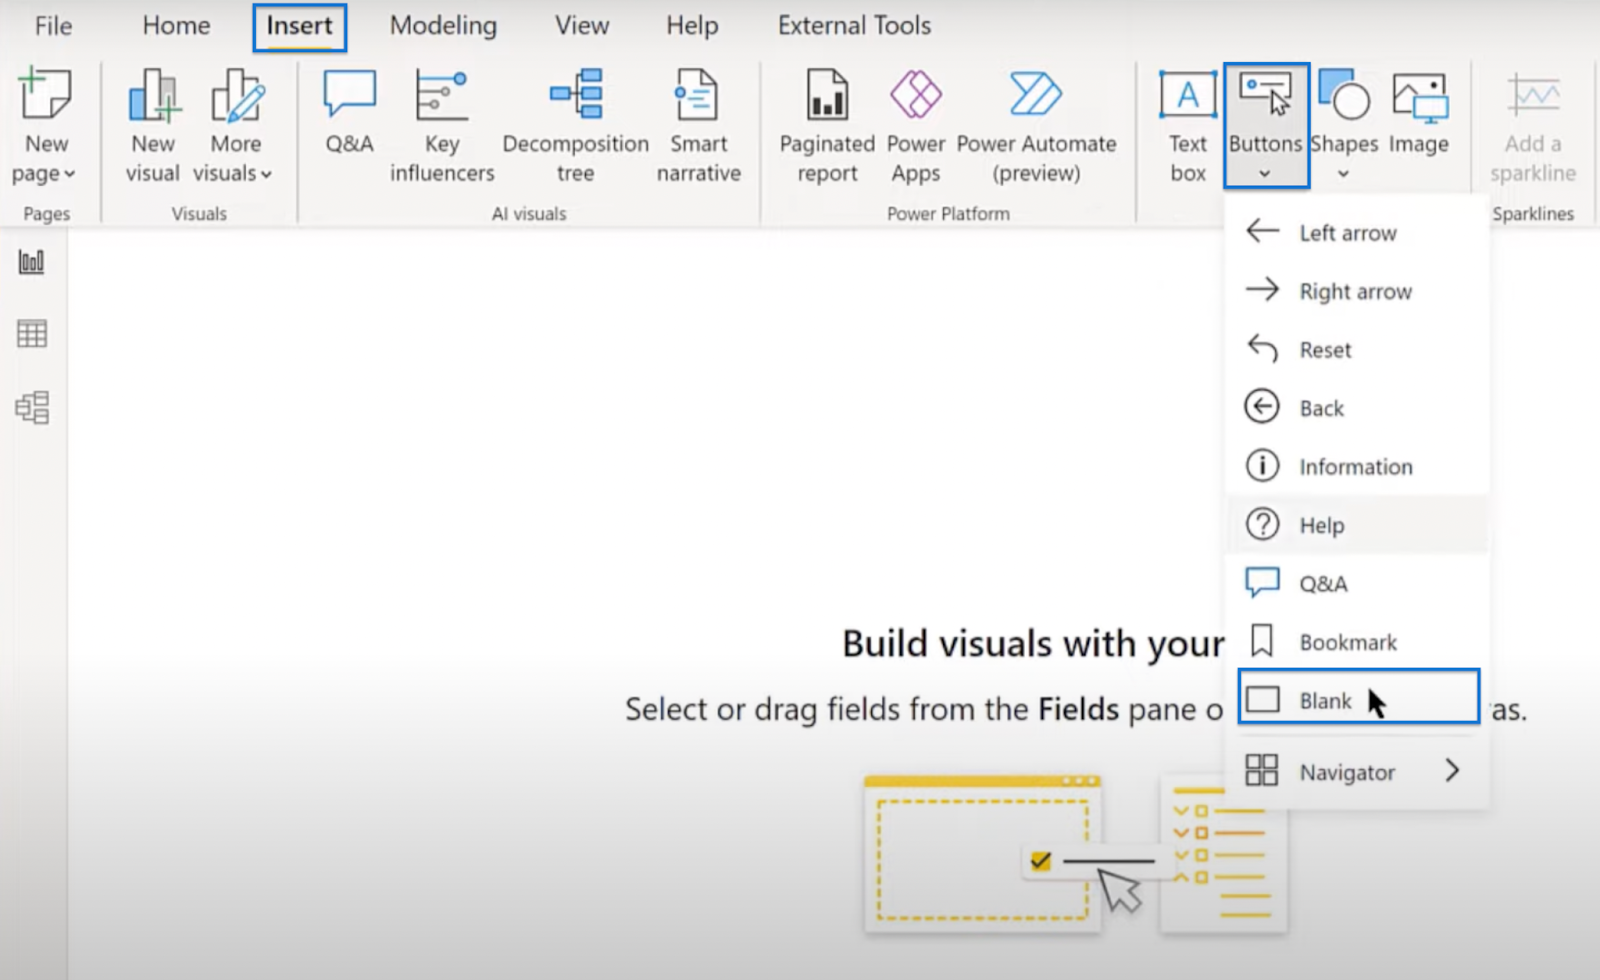
There are a couple more things to cover to complete your Power BI template. At this point, you will add a blank button to your template so that you can insert your logos.
Go to Insert, Buttons, and choose Blank in the dropdown.
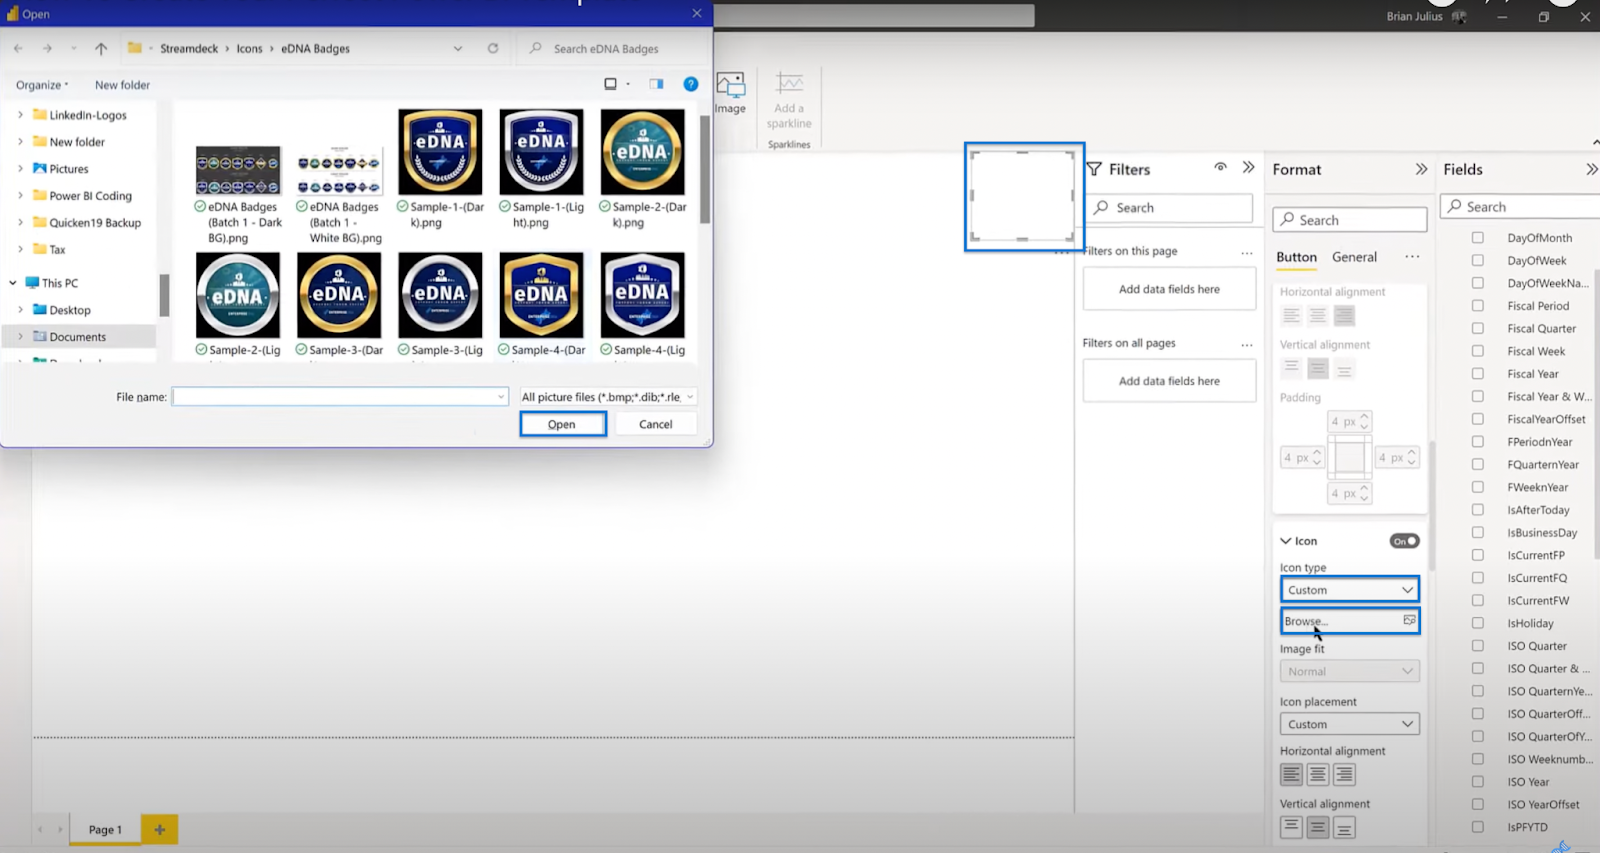
Expand the blank button to the shape of your logo and drag it to the upper right corner. Go to Properties, then under style, choose Custom Icon in the Icon Type. It will give you the option to pull in your logo file by clicking Browse. Search for the logo on your computer and open it.
Afterward, turn on Action, choose Web URL under Type, and add your URL (e.g., enterprisedna.co). Then, for the Tool Tip, put the Text that you want to show. In the sample image below, you can see that the text says to go to the Enterprise DNA site.

You can add a whole series of buttons such as mailto button or a button to your LinkedIn profile or other social media accounts. What you did earlier is just an example of how you can add a blank button.
Saving Your Power BI Template
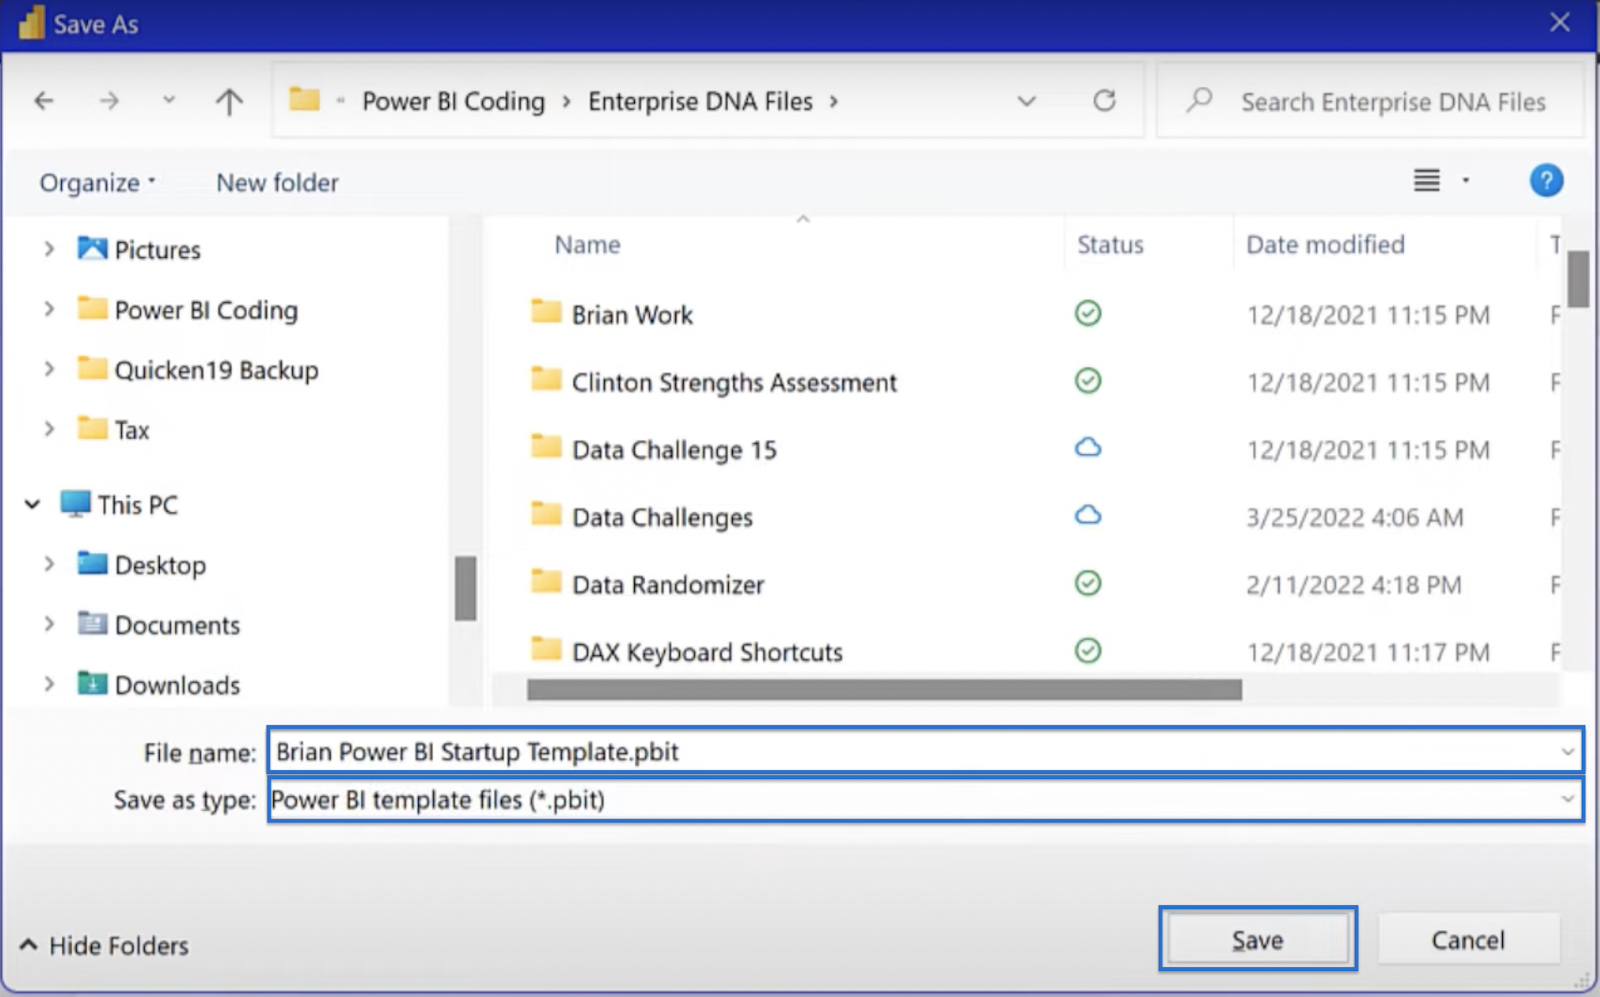
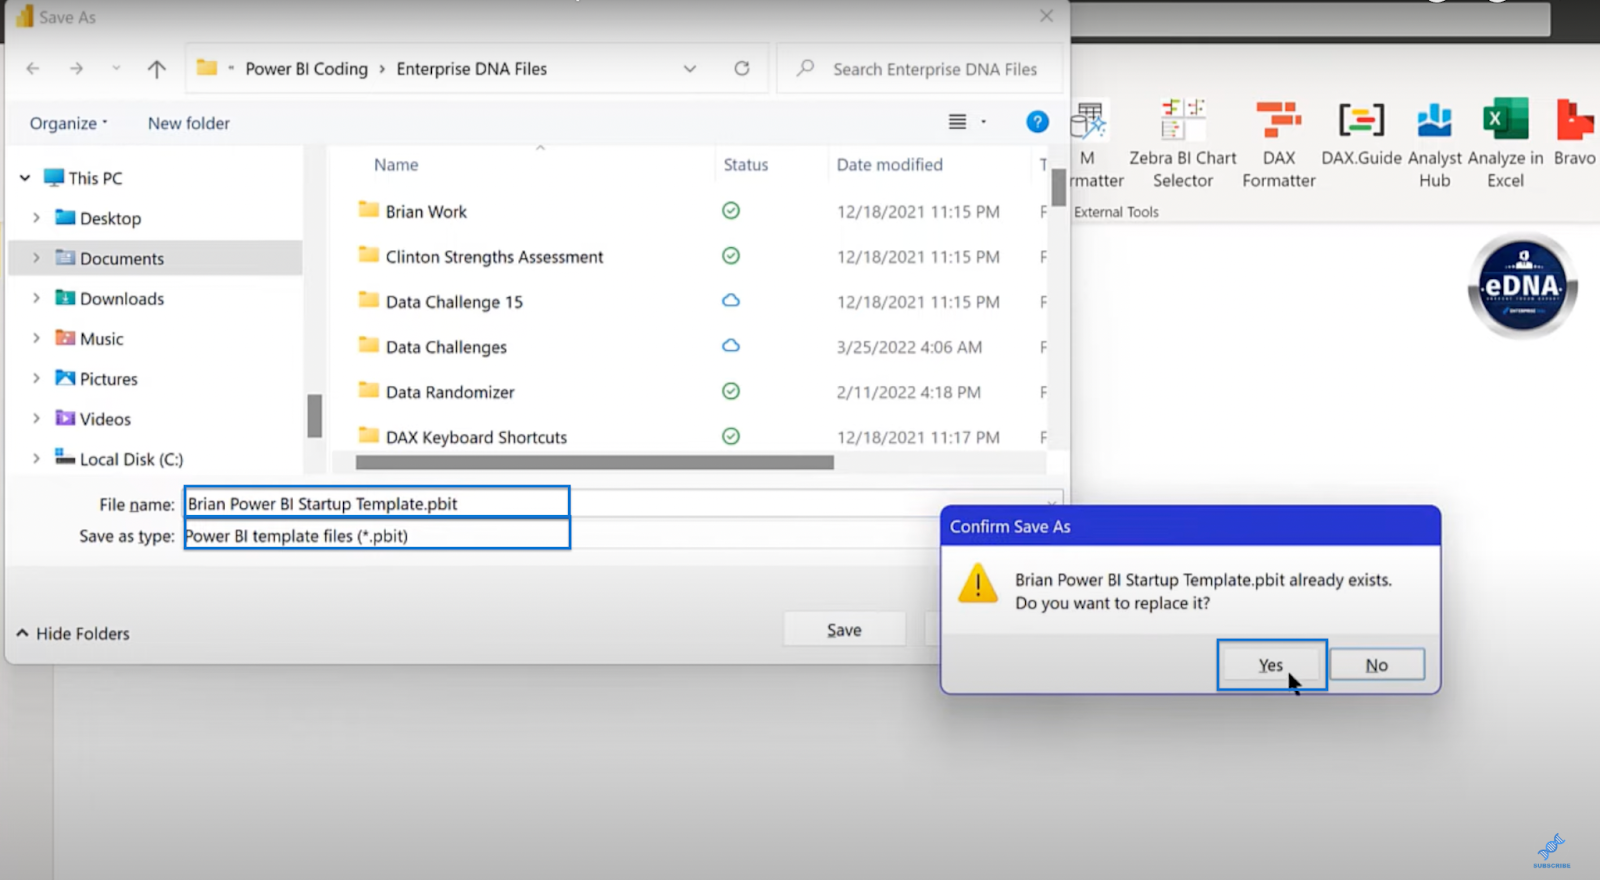
The last thing to do is save the file by going to File and clicking Save as. Find the directory and type your desired File Name. In the Save as type options, choose Power BI template files (*pbit) instead of *pbix. Click Save.
A window showing a Template description will show up. In the sample image below, the description says Basic EDNA theme starter report. That is a good description so simply click Okay.
Using Conductor Pro To Create The Power BI Template
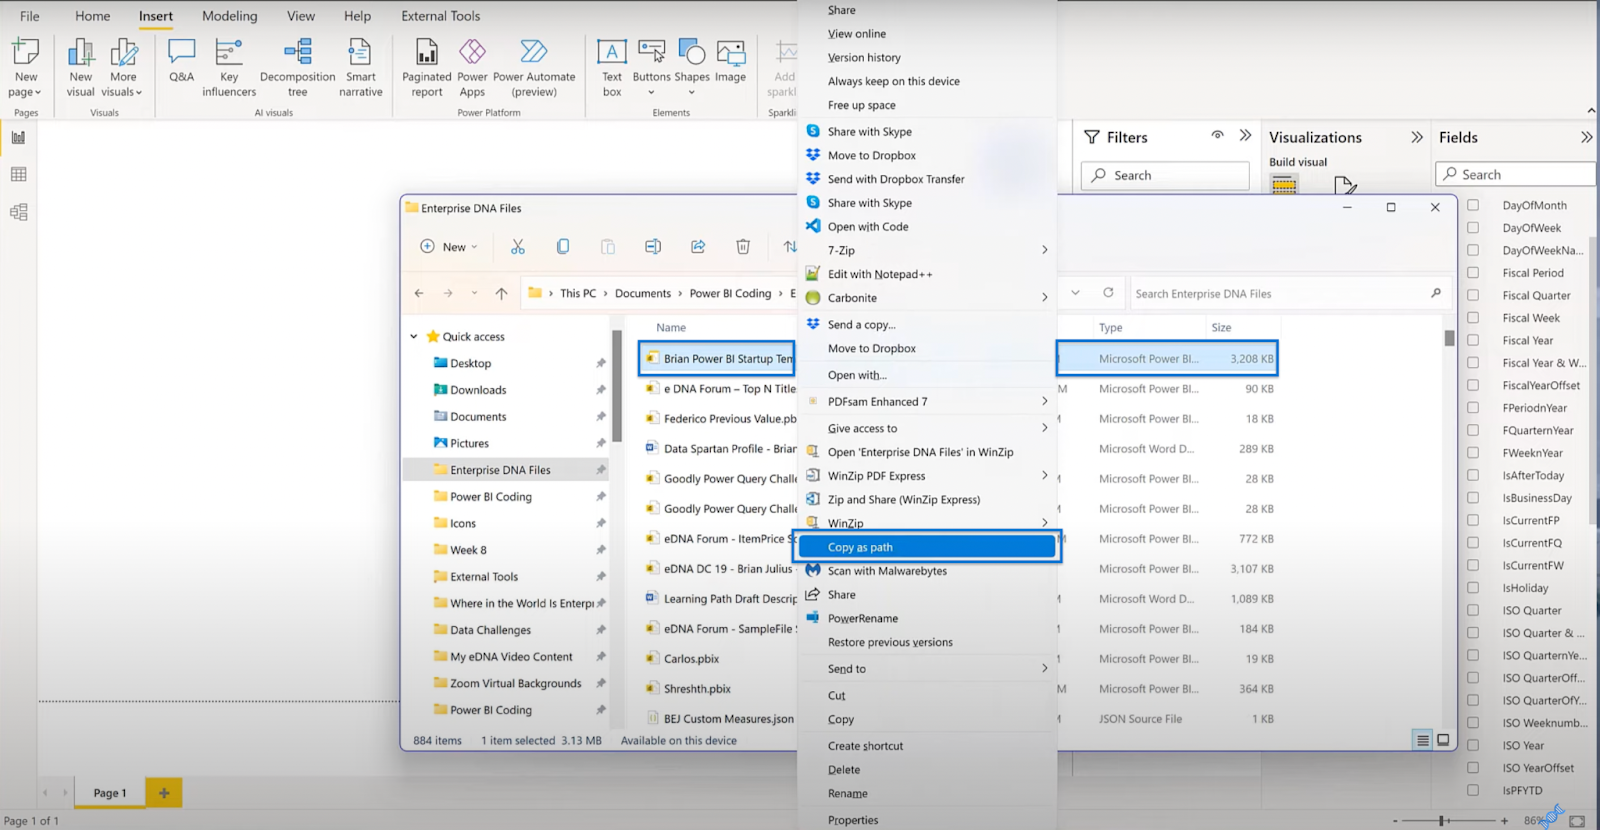
Once done, go to File Explorer. Search for the file that you just saved, right-click, and choose Copy as path.
What you can do is either create a JSON file from scratch or, if you are an Enterprise DNA subscriber, you can use Conductor Pro under the External Tools. I have made an entry named Starter Template, and you just have to click Edit.
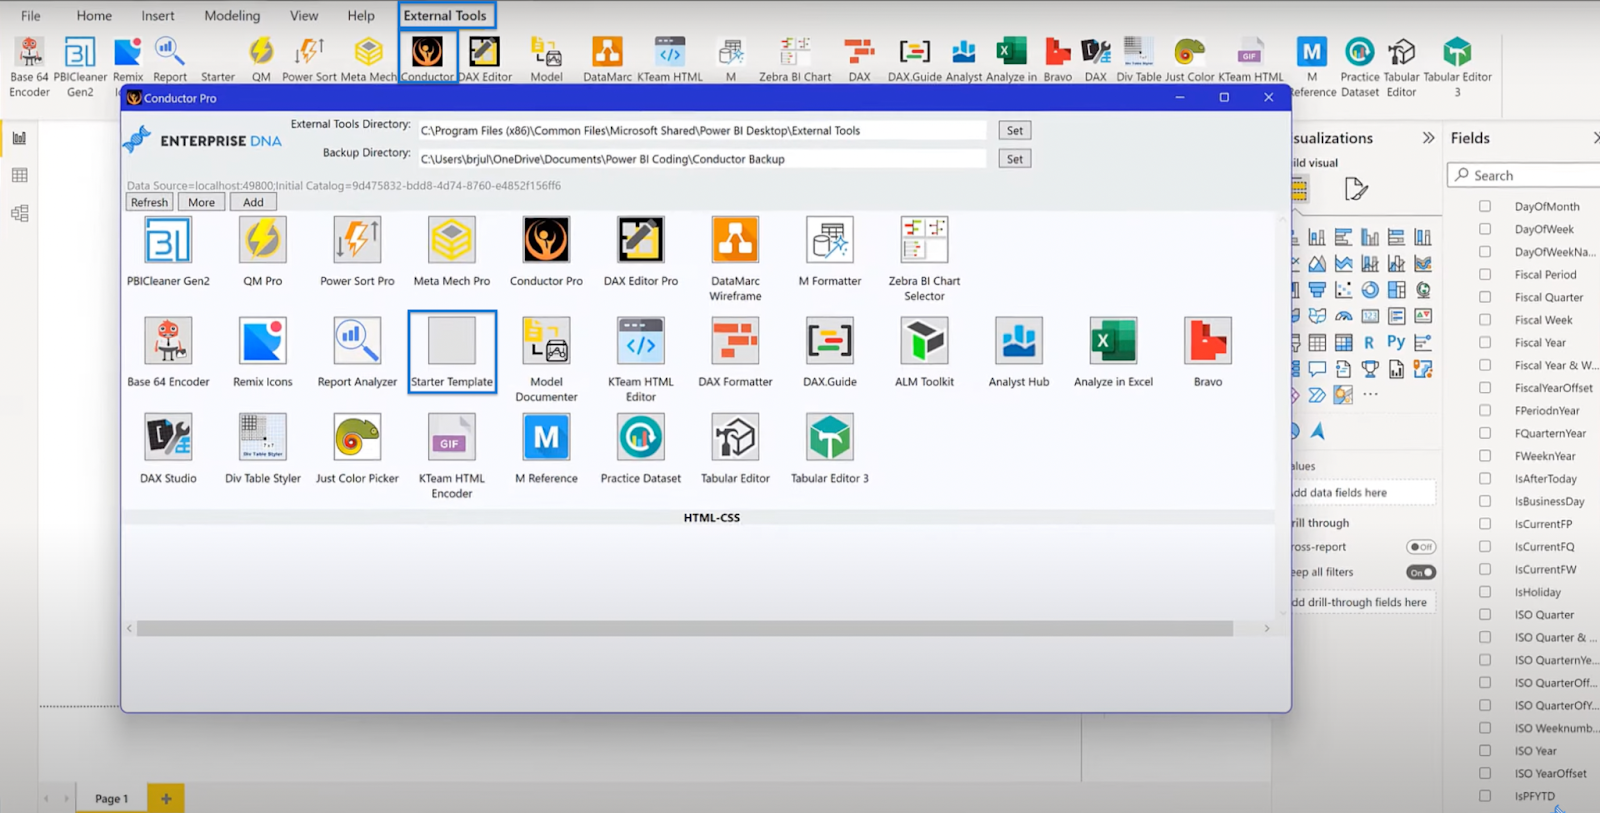
Basically, this creates the template for the JSON file. You can see that you already have a starter template, a description, and the path to Power BI. The only thing to do is to paste the path that you copied into the Arguments box. Keep the window open for now.

Creating Power Bi Template Icon
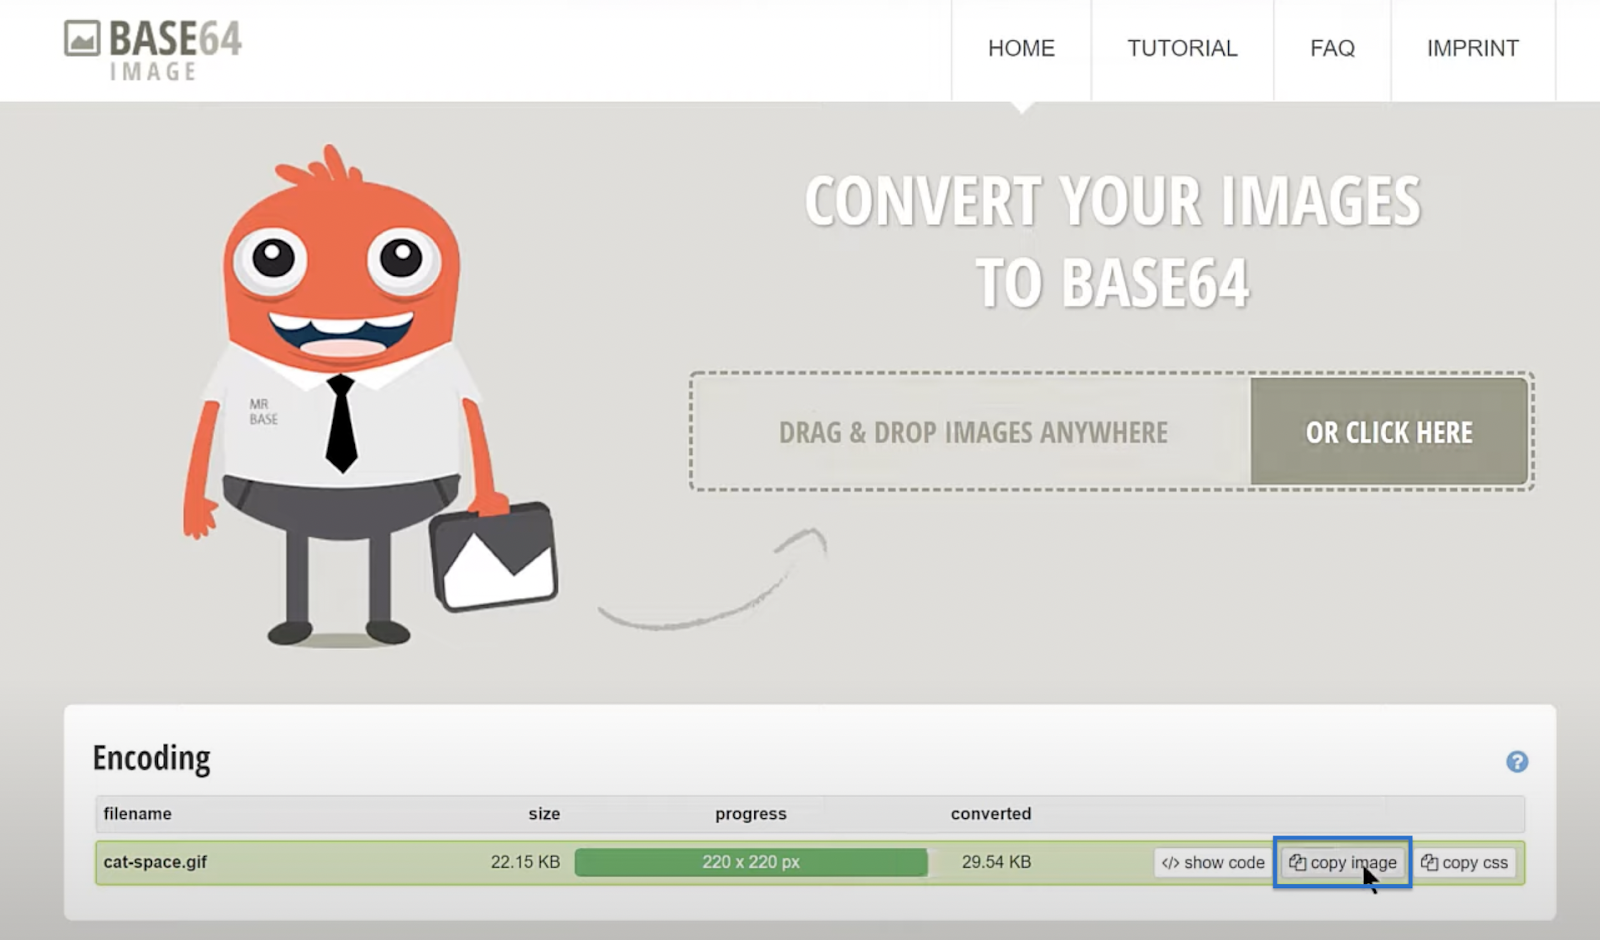
The last step in creating your perfect Power BI template is creating an icon via Base64. This website has good features in terms of image optimization and creating smaller files. Make sure that this feature is Enabled as shown below.

Find an image that you think fits as an icon for your particular template. Then, drop the file into the Base64 conversion site and wait for the conversion to finish. Once completed, click Copy Image then go back to Conductor Pro.
Paste the copied link in the Icon Data box. Then, scroll to the top of the pasted text and remove the word data so the text will only start with image. Click Save and you will be prompted with a message saying Successfully edited the tool.

Close the window and go back to your Power BI template. Then, save the template back to your file using the same name and file type as earlier. Click Replace and Okay.
After completing the last step, you can now shut down Power BI and let the changes take effect. You don’t need to save changes because you have already done that.
Your Power BI Template Results
It’s time to view the results of your work! Start by opening your Power BI and going to External Tools. You should see your starter template with your chosen icon. Click on it and that should load all of your settings.
You should see it creating the date and measures table, inserting the Icon Map and your logo, and everything should be set up and ready to go. The image below shows what your final template should look like.

***** Related Links *****
Report Builder In Power BI: Formatting Objects & Visualizations
Power BI Project Planning: Discovery & Ingestion
Overview Of The Query Editor User Interface In Power BI
Conclusion
In this tutorial, you learned how to create your perfect Power BI template. Now, every time you create a new Power BI file, you only have to click the Startup Template and save yourself 20 or 30 minutes. More importantly, you will have the template working exactly as you want it to. You can apply what you’ve learned to tailor the program to your specific needs.
All the best,
Brian Julius
[youtube https://www.youtube.com/watch?v=6TLNIFVNmj8&w=784&h=441]


")