In this tutorial, I dive into how to customize Power BI reporting templates efficiently. You may watch the full video of this tutorial at the bottom of this blog.
When you create tables inside Power BI, you can’t format or design them exactly the way you want them to be. You can only use the default order or sequential order that Power BI generates within the table, which can be determined by a value, by alphabetical order, or an ascending or descending order.

That’s why I developed Financial Reporting Templates. These are a development concept created by Enterprise DNA. With this technique, you can now create customized financial reporting templates using tables inside Power BI.
This tutorial session is taken from a much longer and more detailed Enterprise DNA member-only workshop. Here, I demonstrate key concepts around how to visualize financial information and data effectively in Power BI.
First, let’s have a look at this template that I made for financial reporting.
Sample Financial Reporting Templates
Financial reporting is a perfect example for this demonstration. However, there’s a lot of custom templates or custom tables that you might want to create with a variety of information, such as a summary table of your key metrics.
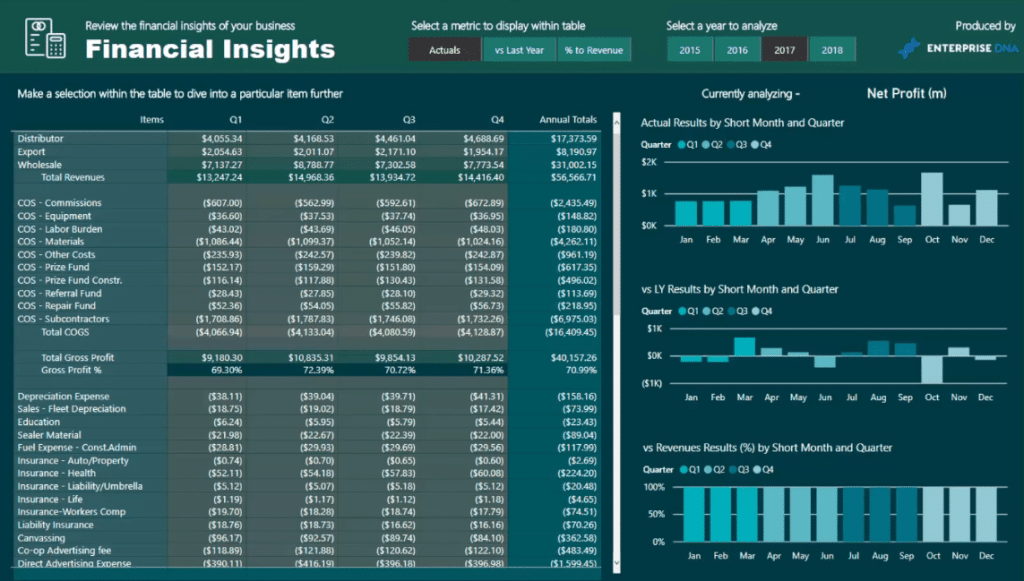
In the past, this was very difficult to do if you wanted to grab specific measures out of different measures and integrate them into one report and put them on top of the other.
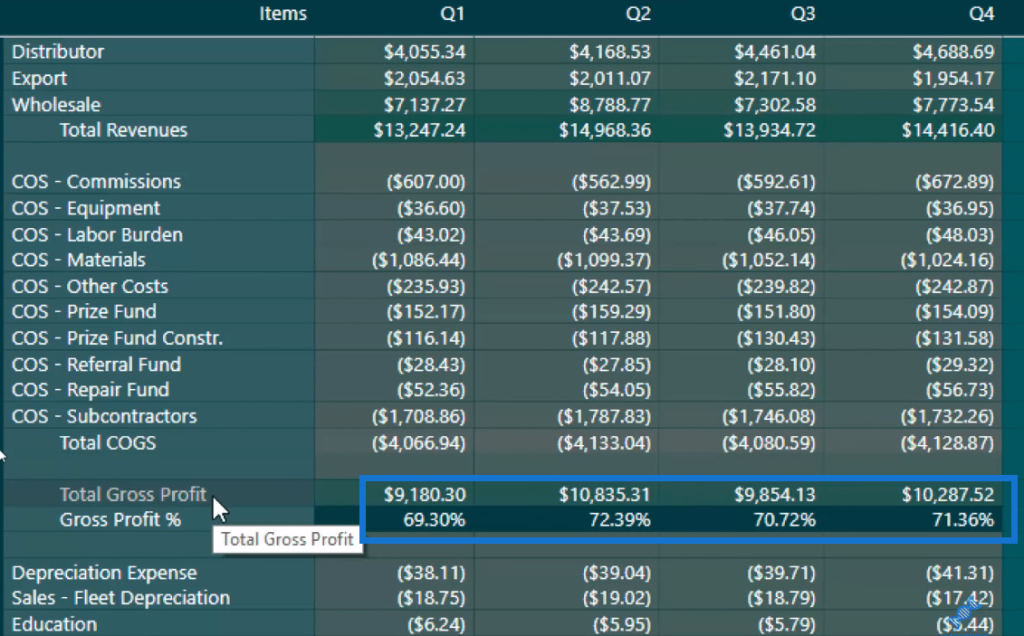
Now in this sample template I’ve broken it down by Total Revenue, Cost of Goods Sold, and even more, which is where the true customization comes in. I’ve left a space in the table, then I have Total Gross Profit.
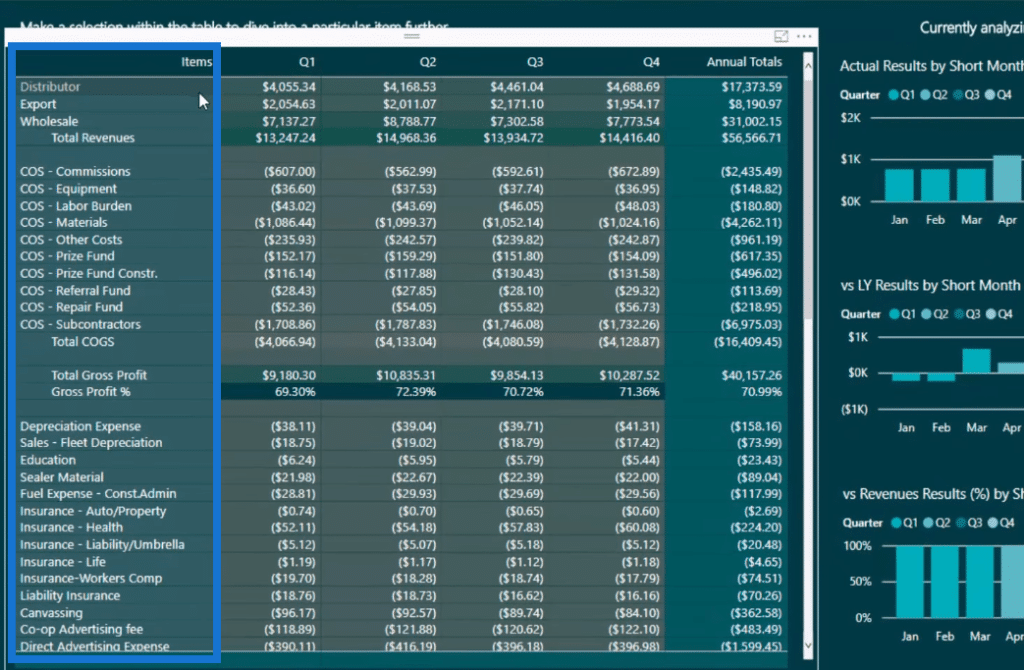
I’m integrating a percentage with dollar amounts as well, which is again with a customization.
Let’s get to how I created it…
How To Create A Customized Template
To get to this point of having to customize Power BI templates, it requires a lot of re-configuring in the background, the model set up, and the technique to grab revenues and costs, and then integrate them into one.
The first thing to do is to actually create the template – a unique table that looks somewhat like this – but of course you can customize in whatever way you want. You can put different columns or have some items indented in a different way.
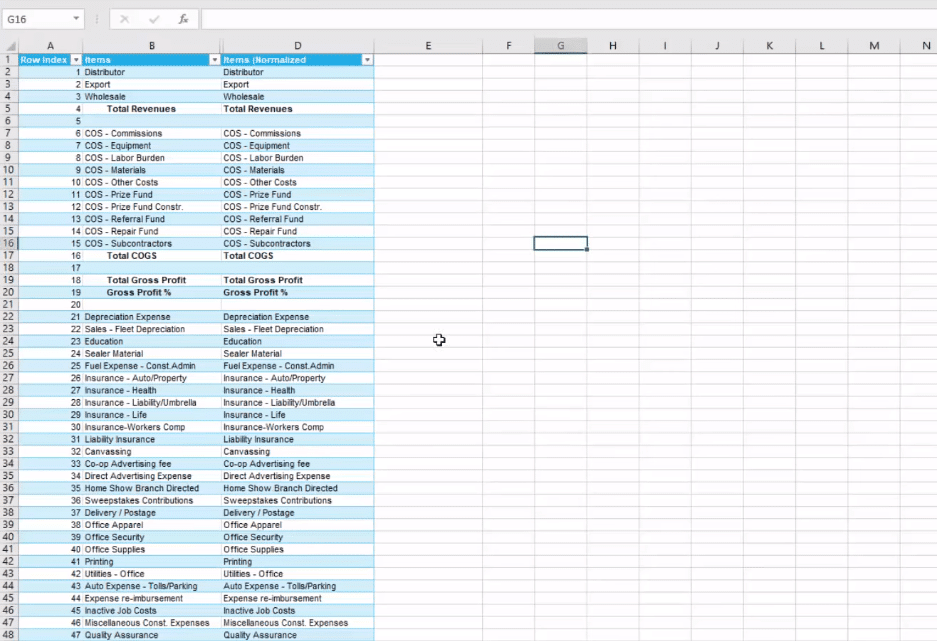
You also need a Normalized Column, where we’re going to run a logic through. We’re going to identify which line we’re on in our custom template based on this normalized column.
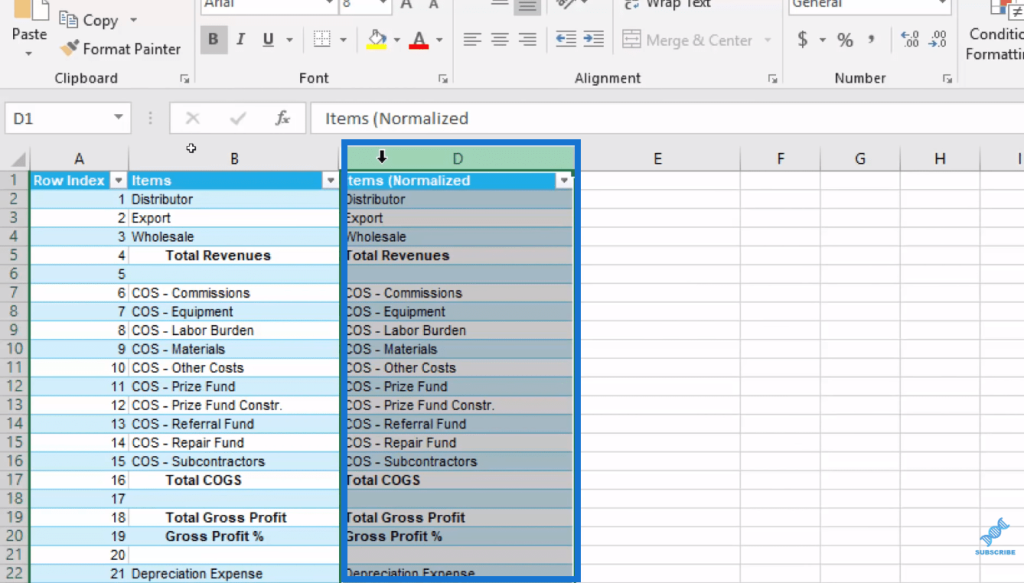
So this is the set up of a customized template, but then you need to find a way to integrate this into your report. This is where the data model comes in.
Integrating the Template Into Your Data Model
The structure of the data model is key to integrating your customize template into your table. As you can see in my data model, the Financials Template is right at the bottom and it has no relationship to any other tables.
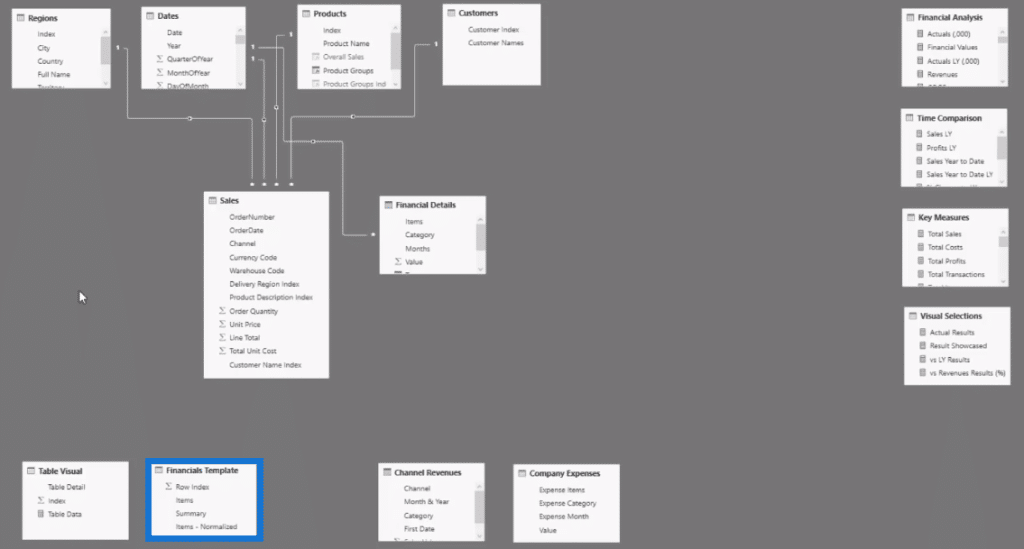
This is where I put my template column and use a formula to work it out at every row in the table.
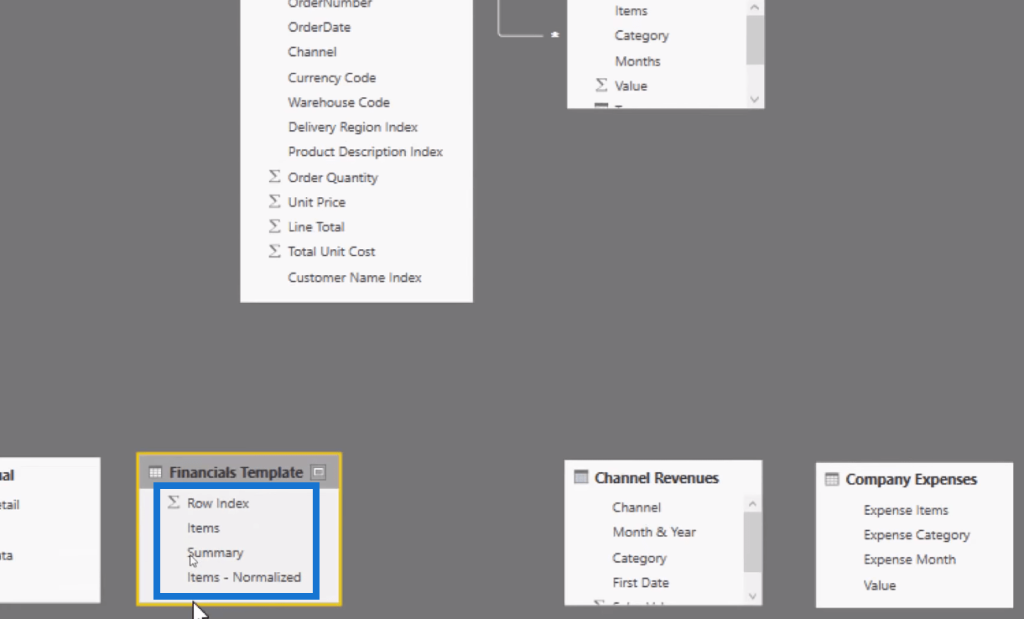
So let’s have a look at the DAX formula I created to solve this.
Using SWITCH TRUE Logic To Allocate Results
I used the SWITCH TRUE logic in the formula, which enables me to integrate the customized template that I made into the table. It works out at each row in the table, identifying the items.

This is what the SWITCH TRUE does. For instance, if I’m on the Total Revenues row, the calculation DIVIDE Revenues by 1,000 is applied. If I’m on the Total Cost of Goods Sold row (COGS), it will show DIVIDE Revenues by 1,000 etc.
It’s the SWITCH TRUE logic that enables the allocation of results to the rows in the table.
Utilizing Row Index To Sort The Template
The final piece of the puzzle for this Power BI template technique is the Row Index, which sorts out the template in the table.
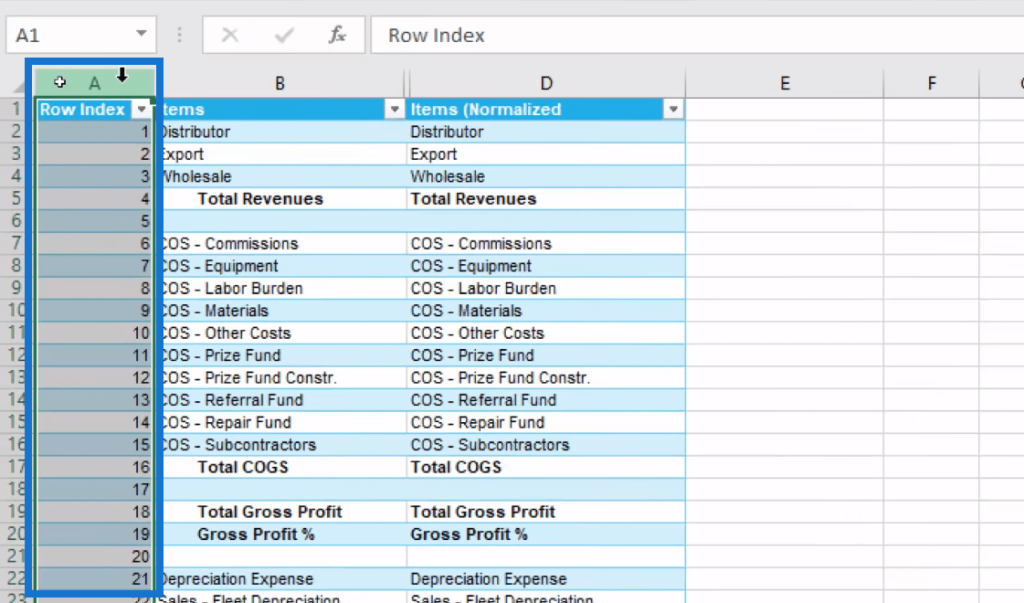
If you don’t have this, it’ll get confusing and won’t sort the items in a unique way. And what I did was, I hid it so you can’t see it in the table, but it’s actually there.
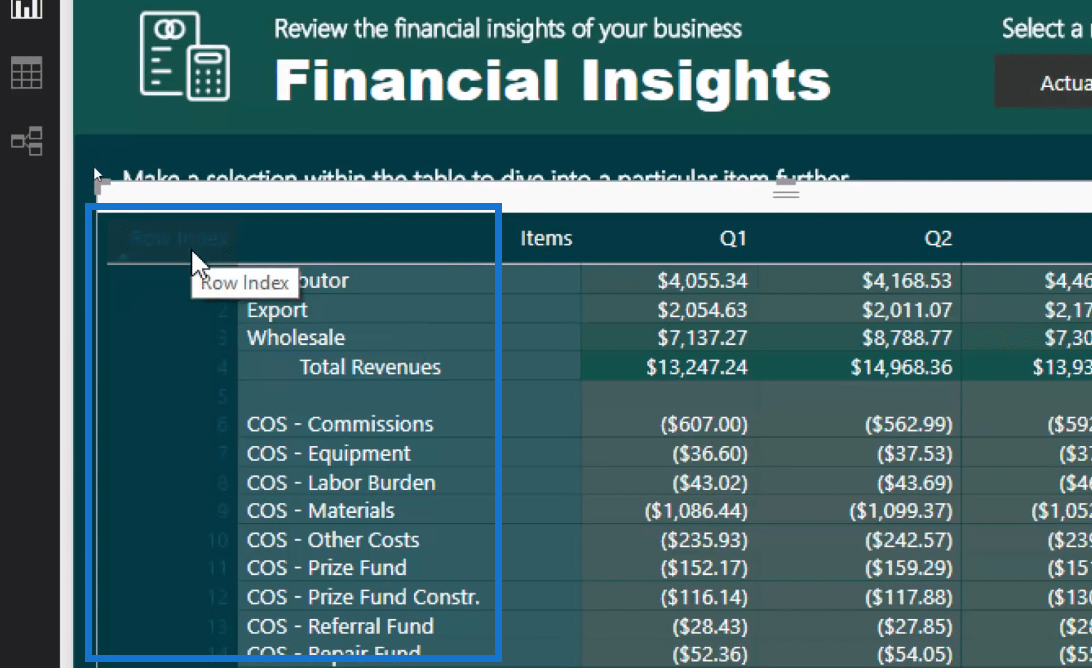
If you look closely, you can see that I have the Row Index and I’m able to sort 1, 2, 3, 4, 5, and so on. That’s how I get the exact template set up as I want.
Conclusion
This tutorial is a breakout session from a members-only Enterprise DNA workshop around financial insights. Here I focused on the technique that I developed to customize Power BI reporting templates. The technique involves the integration of data model, DAX formula, and template creation.

I hope you able to understand how valuable this concept is and implement it in your own business. You will find it helps a lot with your financial reports and any accounting presentations you might have.
Cheers!
Sam
***** Learning Power BI? *****
FREE COURSE – Ultimate Beginners Guide To Power BI
FREE COURSE – Ultimate Beginners Guide To DAX
FREE – 60 Page DAX Reference Guide Download
FREE – Power BI Resources
Enterprise DNA Membership
Enterprise DNA Online
Enterprise DNA Events
[youtube https://www.youtube.com/watch?v=wSgJXGAJaz4&w=784&h=441]

***** Related Links*****
Power BI Tips & Techniques For Accounting & Finance
Allocating Results To Pre-Determined Templates – Financial Analysis In Power BI
Create Unique Table Template Designs Within Power BI – Power BI & Financial Reporting
***** Related Course Modules *****
Data Visualization Tips
Financial Reporting w/Power BI
Scenario Method Workshops
***** Related Support Forum Posts *****
Financial Reporting Template Categories In Template Table
Financial Reporting Template
Financial Reporting Template Formatting
For more template queries to review see here…..


