Today, we will learn how to calculate Power BI ranking in a hierarchical form which is a little bit more complex subject in comparison to the concept which we discussed in my previous tutorial. You can watch the full video of this tutorial at the bottom of this blog.
In the previous tutorial, we saw how to calculate the percentages in a hierarchical form. We showcased how to calculate ranking over a specific set of data of a particular set of products, either in the form of a product category or subcategory. Also, in the case of the region, it is either in the form of cities, territories, or countries.
This time around, we will go one step further in the calculation of hierarchies. We’ll learn how to calculate ranking when all the different sets of fields are combined in a single set of hierarchies.
Levels Of Hierarchy
Let’s head over to Power BI and see how it is being done. In this scenario, we have created a set of hierarchies where the first level of the hierarchy is in the form of territories.
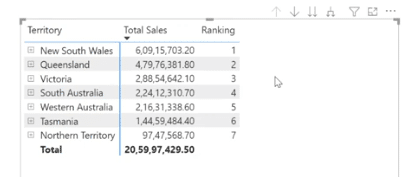
The second level is in the form of customers.
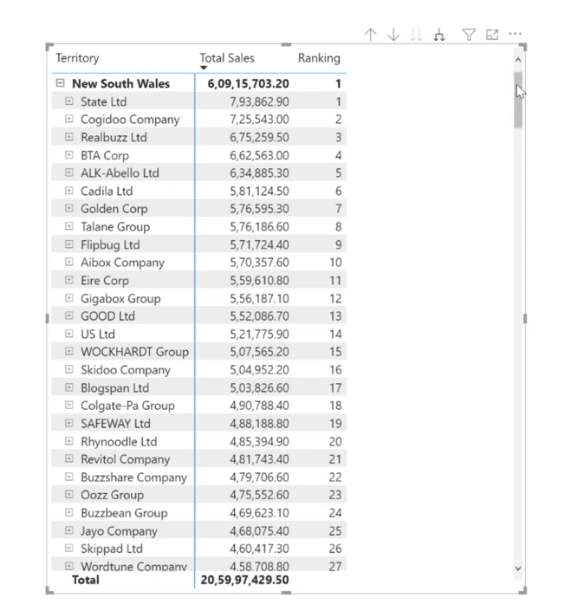
And the third level is in the form of product names.
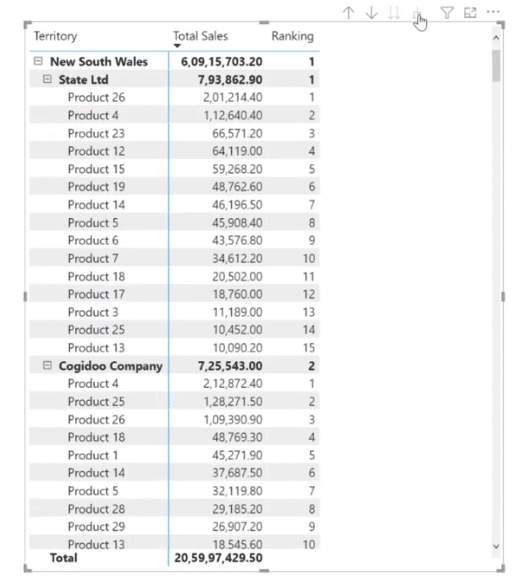
So, what’s the logic behind creating this type of hierarchy? We need to find out how we are performing at each and every territorial level. Then, inside each territory, we need to determine who is our best-performing customers.
Additionally, we want to figure out what are the best products our customers like to purchase in their respective territories over a period of time.
Steps On How To Calculate Power BI Ranking In Hierarchical Form
To begin with, we will use the wrong approach how to calculate Power BI ranking by using the RANKX function. By doing this, we will understand why the conventional way of doing this will not yield the correct results.
It’s also worth looking at the errors so we can rank the correct measures to evaluate the results for each and every level of the hierarchy in the right manner.
The Wrong Yet Common Approach
To save time, I copied and pasted the measure based on a simple RANKX function. With this, we created three variables for each of the hierarchies using the simple RANKX function. Additionally, we used the ISINSCOPE function since we are dealing with hierarchies.
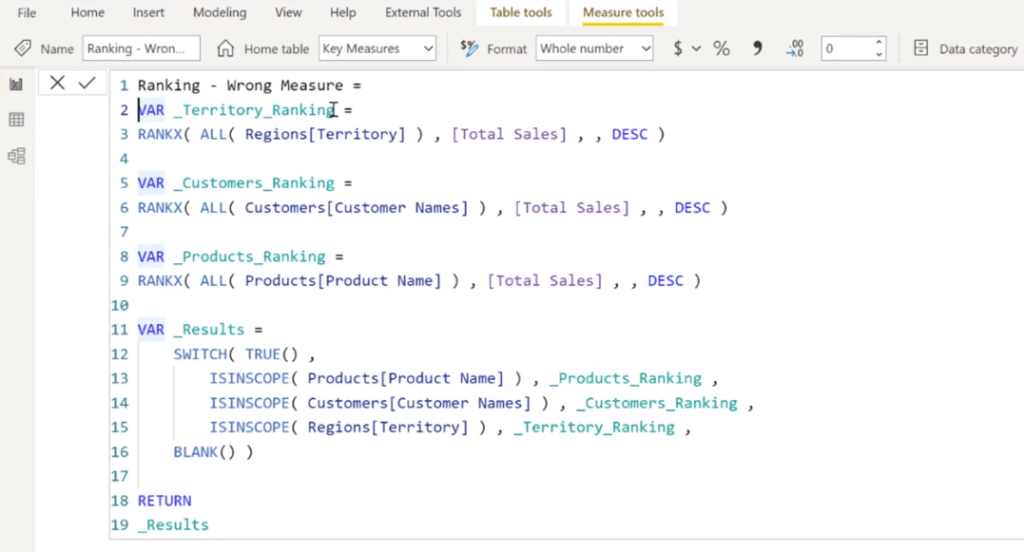
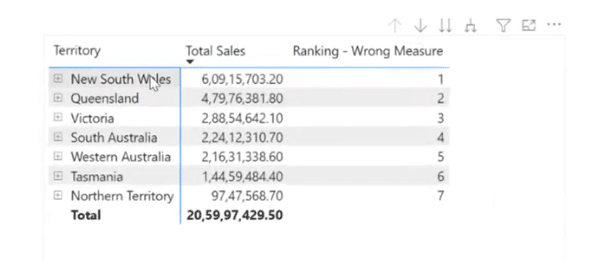
Let’s now load this measure and check out the results. As we can see, the territory with the highest total sales is ranked first and the territory with the lowest total sales is ranked last. So far, we are getting the correct results.
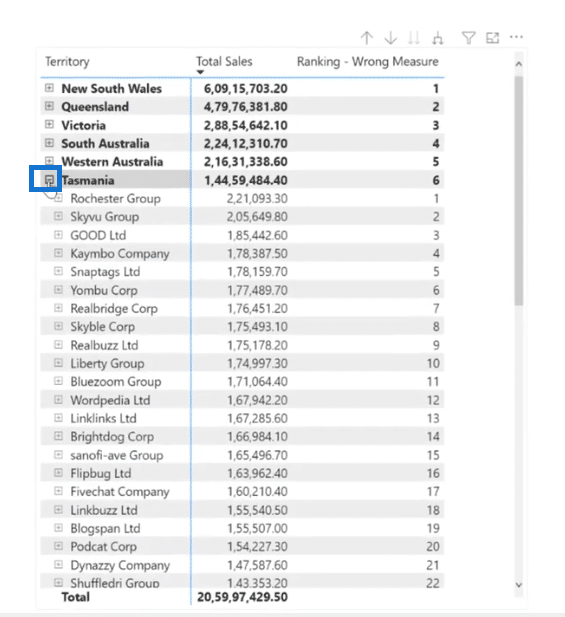
To see how our customers are evaluated, click on a plus sign to expand any of our territories. It’s noticeable that our customers with the highest total sales are ranked first under that particular territory as well. We can also scroll down and see that they are ranked correctly.
Next, check the results for the products to see whether they are also correctly arranged or not.
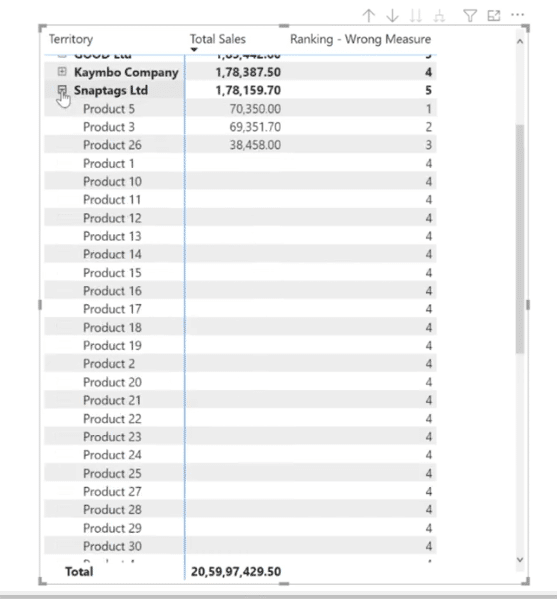
Let’s click the plus sign of Snaptags Ltd customer as an example. Evidently, the product with the highest sales for that particular customer under that particular territory is ranked first and the others accordingly.
However, we observed that the customers and products which don’t contain any sales value are still getting ranked. We can stop evaluating these by using the ISBLANK function.
In this case, let’s click Drill up and Expand all down one level in the hierarchy instead of clicking on each plus button individually.
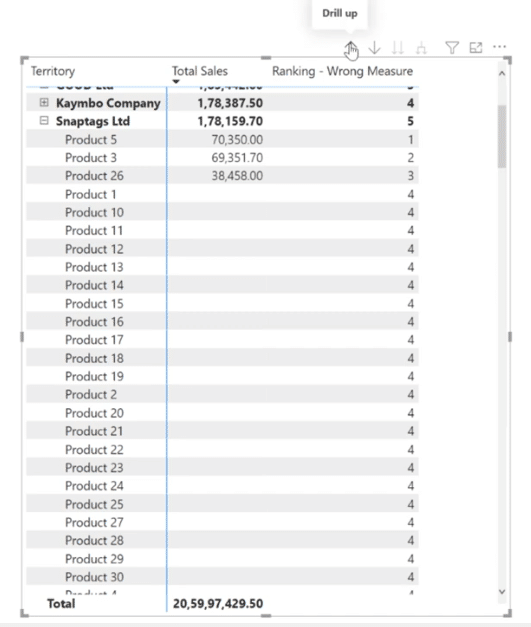
As shown below, we can still see that the first territory and customers for that particular territory are still evaluated correctly.
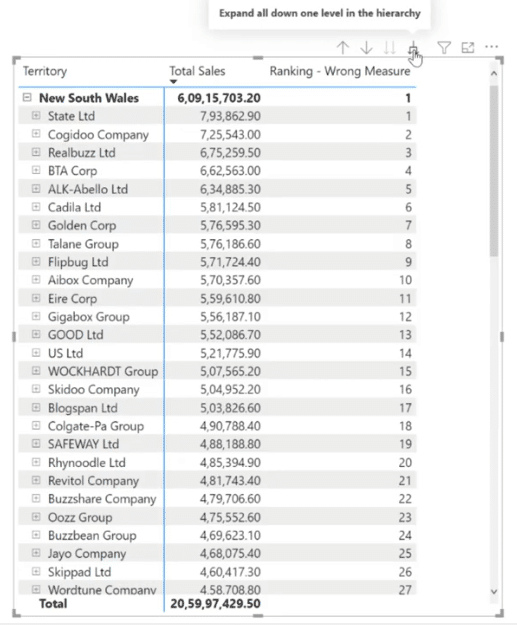
Scroll down to see how our next territory is ranked.
At this stage, we can now see that there is a problem because the Queensland territory was ranked as second earlier but now, it is evaluated as third.
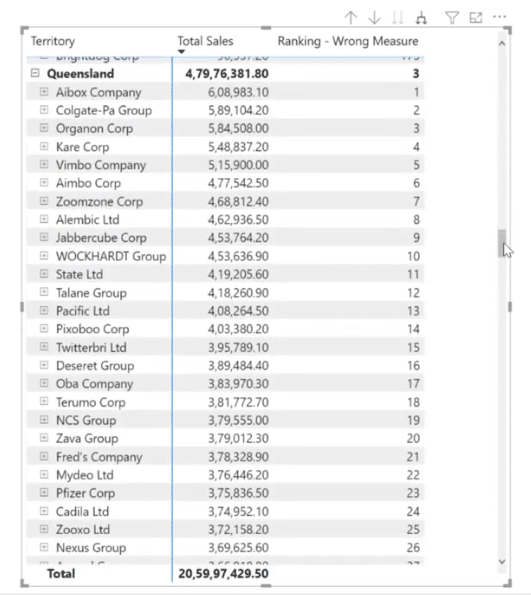
To be sure, let’s also check how our products are evaluated.
Similarly, the New South Wales territory and the State Ltd customer were both ranked first in the earlier scenarios, but are now second.
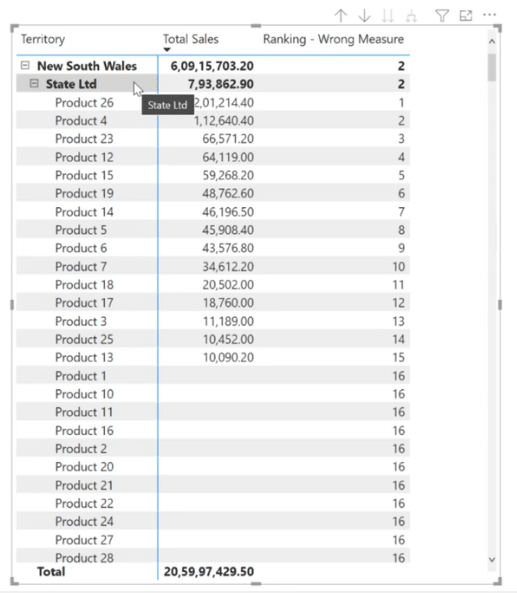
We started seeing these incorrect results when we clicked on the Expand all down one level in the hierarchy button instead of clicking on each plus button individually.
Why is this happening? The reason behind this is when we click on the plus button individually, we are just simply sneaking it under the hood by still staying at the top level of the hierarchy. Technically, we haven’t drilled down to the next level.
On the other hand, when we click on the Expand all down one level in the hierarchy button, we are moving down to the next layer, and that’s the time when the actual context transition takes place.
Therefore, we cannot use the conventional method of calculating ranking in the case of hierarchies because drill down actually means that we move down from the first level to the next level.
The Correct Approach To Calculate Power BI Ranking
After identifying these problems, let’s solve them by clicking New measure and creating the correct ranking measure.

Let’s name our measure as Ranking – Right Measure and create three variables for calculating the ranking for the respective hierarchies.
Type in VAR_Territory_Ranking for our first variable. Inside this variable, the first process is to create a virtual table using SUMMARIZE (Regions, Regions[Territory]). We referenced this to the regions table since territories are coming from that table.
Once we have created our virtual table, inside this, we need to create a virtual column using the ADDCOLUMNS function. This will help us to evaluate the ranking for that particular territory hierarchy.
Then, let’s name our virtual column Territory Ranking and use the RANKX function. We want to rank our highest sales first and the lowest sales last. So, we’ll convert this virtual table into a scalar value by wrapping it up inside the SUMX function.
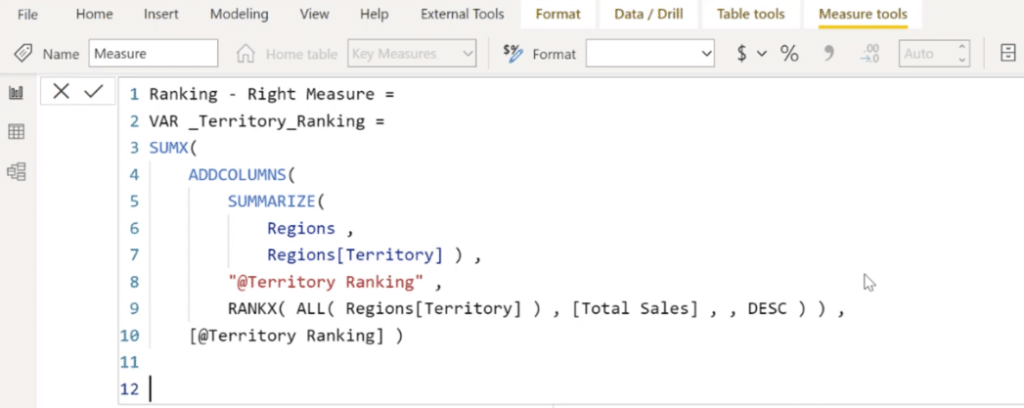
We implemented the exact same technique for the other two variables such as the VAR_Customers_Ranking and the VAR_Products_Ranking.
Of course, we used the ISINSCOPE function and called out each of our variables against that particular level of hierarchy.
So far, what we’ve done is to create variables for each levels of the hierarchy, and placed each variable against that particular field using the ISINSCOPE function.
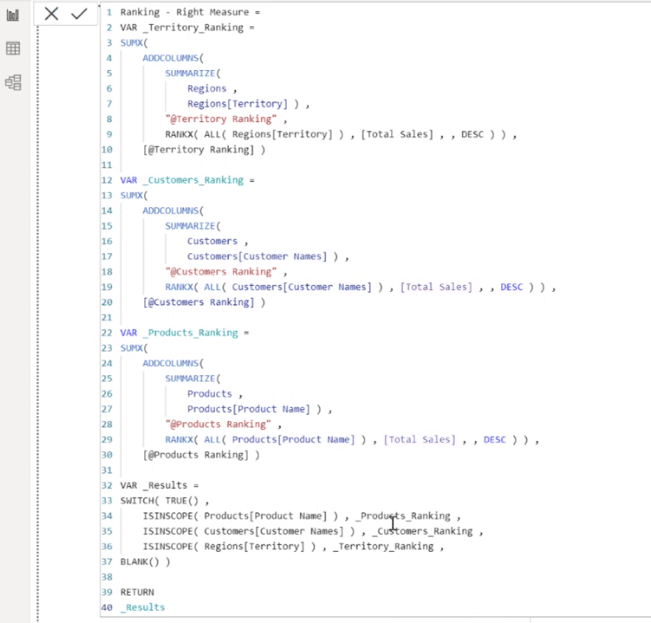
It’s time to test our formula and check the results by bringing the measure into our matrix visual and expanding it.
As shown below, the ranking at a territory level is getting evaluated correctly.
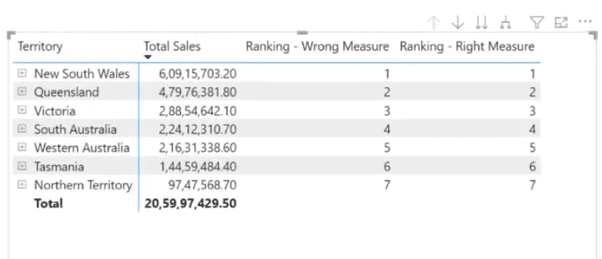
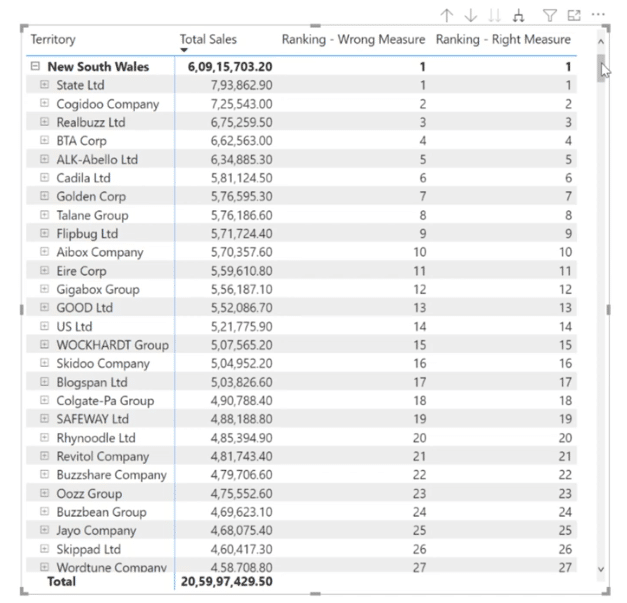
Let’s drill down further and check our customer ranking. The New South Wales territory and State LTD customers are ranked correctly as well.
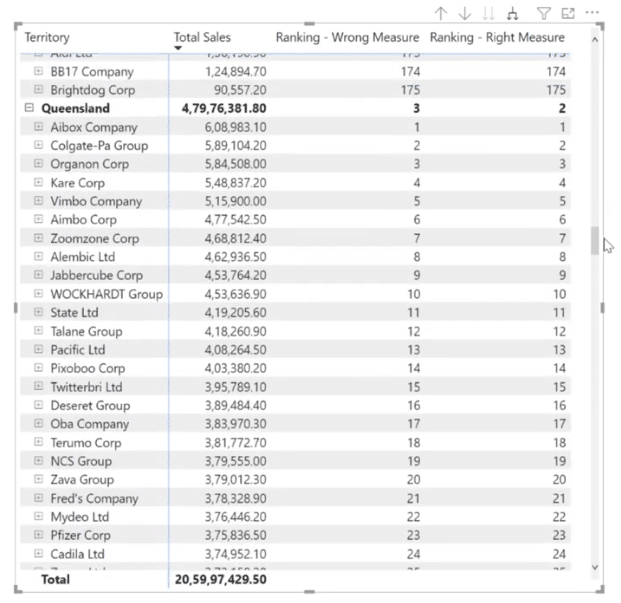
This time around, let’s see how our Queensland territory is evaluated. Finally, it is now ranked accordingly.
For our product levels, it is nice to see that they are also ranked perfectly.
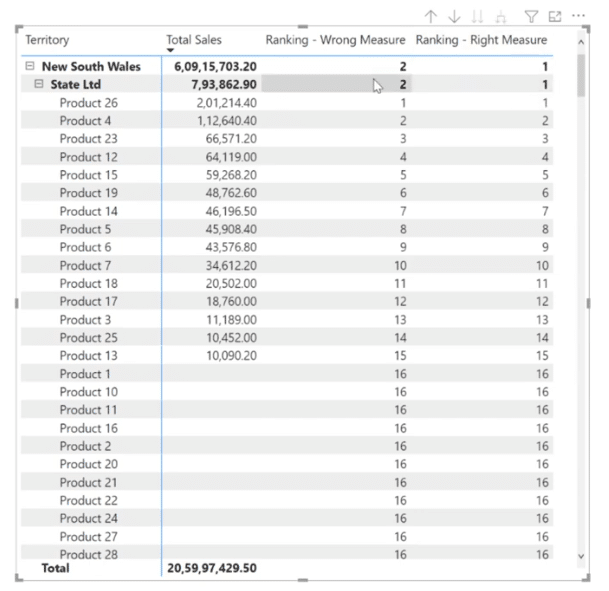
If we’ll also take a look at our second and third customers, we also got the correct results.
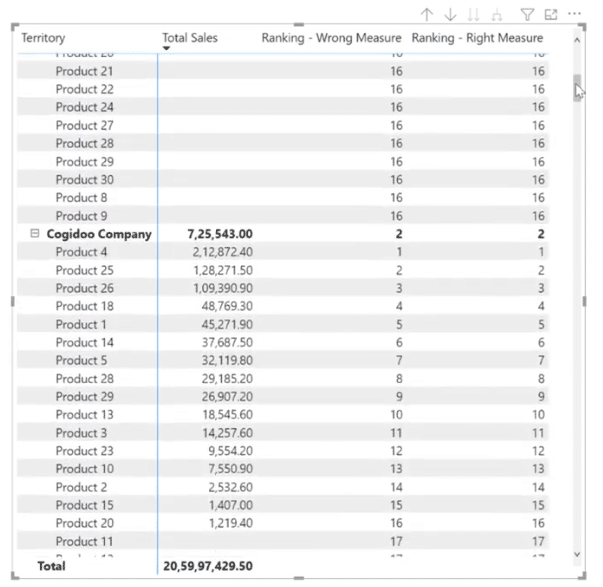
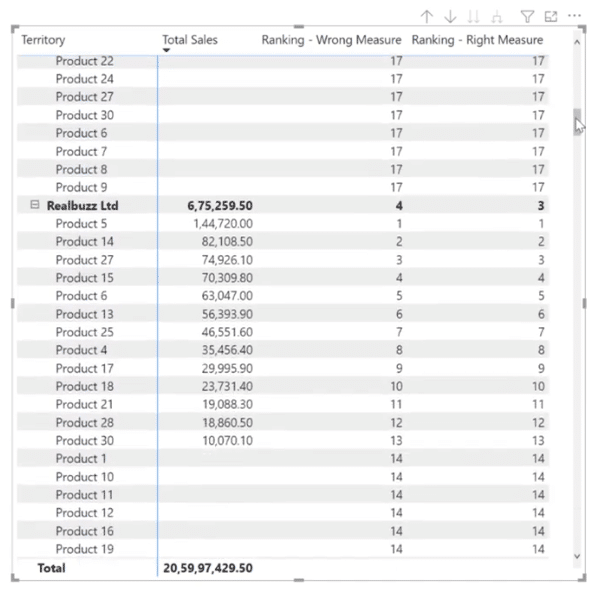
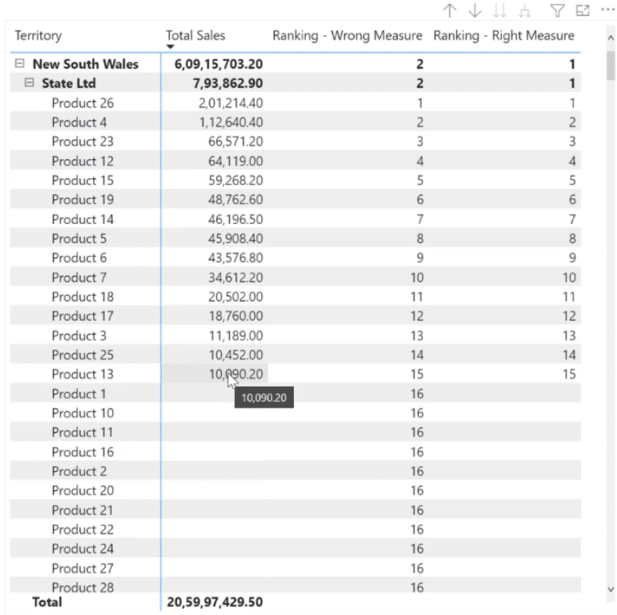
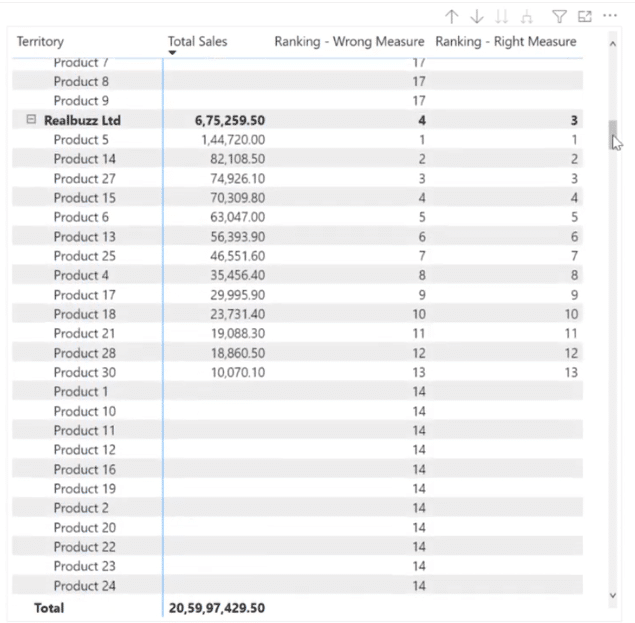
Lastly, let’s get rid of the ranking against the blanks by replacing the reference of the respective dimension table names with the Sales table name.
We do this because the Sales table has a lineage with each of these dimension tables. For example, if sales haven’t taken place for a specific product against a particular customer in that territory, then by default, ranking will not be evaluated against that particular data point.
So, let’s go ahead and replace our reference of dimension tables with the Sales Table.
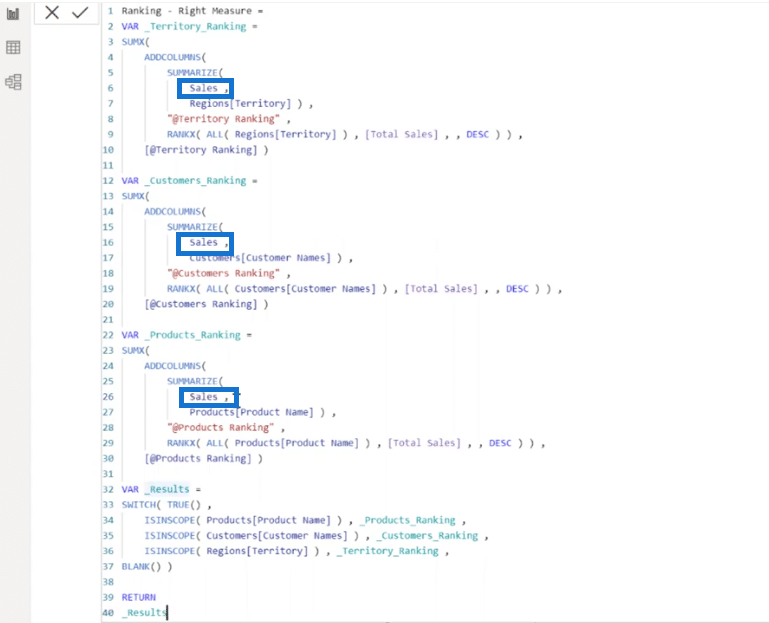
Finally, let’s check the results one last time.
It worked! We can now see that our ranking is only limited to a data point where we have a sales value.
***** Related Links *****
Calculate Percentage In Power BI In Hierarchical Form
Temporal Scale Using Calculated Columns In Power BI
CALCULATE Function – How It Can Affect Your Calculations In Power BI
Conclusion
Calculating ranking in a hierarchical form involves complexity especially if you’re dealing with different sets of fields combined in a single set of hierarchies, but it’s worth it because it can really drill down to the next level.
Another important thing to note is that if you would like to see calculate Power BI ranking change based on the selection made into the slicer, then instead of using the ALL function, you can make use of the ALLSELECTED function while evaluating the rankings.
So that’s it for me, I hope you enjoyed this tutorial. There are plenty of resources and further learnings that you can access easily on the Enterprise DNA website, so please check it out.
All the best,
Harsh
[youtube https://www.https://www.youtube.com/watch?v=Q_rMQ89ng70&w=784&h=441]


