I want to show you a really simple, but super effective technique to create additional filtering or Power BI dimensions to filter by in your reports. You can watch the full video of this tutorial at the bottom of this blog.
There are many places where you can add different dimensions. And when I say different dimensions, I mean that you have your Power BI model.
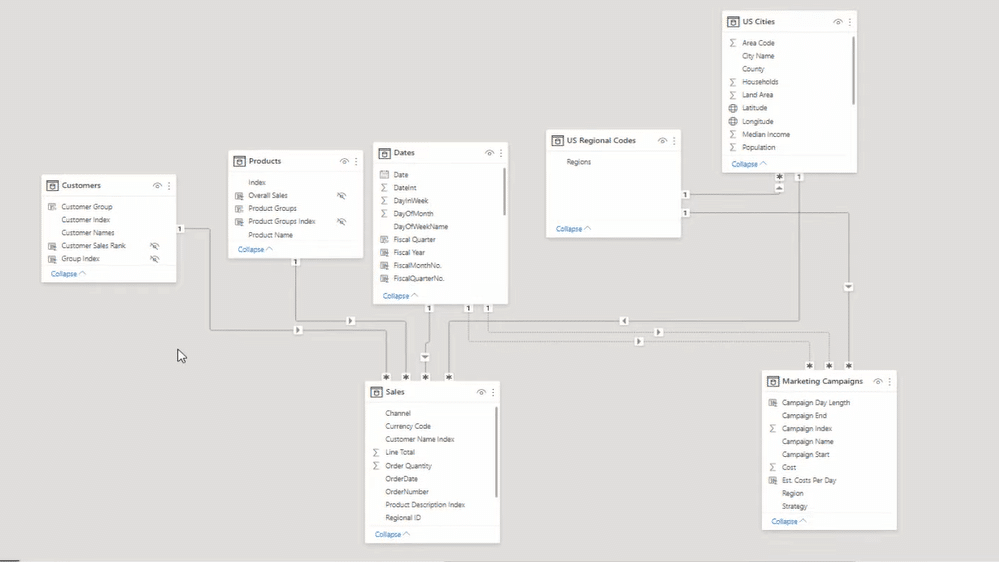
For the data model, we want to create a waterfall. We have our lookup tables at the top and our fact tables at the bottom. All these relationships are generally one-to-many, and we want to create filters from our columns or dimensions and have them flow down to our fact tables down the bottom. And so, we’re going to create some new dimensions.
Ways To Add Power BI Dimensions
We can create some of these dimensions inside the Query Editor, but sometimes it doesn’t make sense. Sometimes, there’s a lot of additional logic that you might need to create that just cannot be created inside the Query Editor.
The Query Editor is great for simple things, where we can utilize some great features to add additional columns in our data sets. I want to show you how you can do it using virtual groups. But first, I’m going to show you how you can use formulas to create additional dimensions.
Below is the original table we had in our Products table. As you can see, it only had two columns. But what I wanted to work out was to group these products.

And so, I created an initial calculation of sales, then I created some groups based on those sales. These are hardcoded. This is actual logic that I’ve hard coded. However, there are some downsides to this approach. One is that this is not dynamic.

Now I’m going to show you another way to consolidate and create new dimensions quite effectively. Click on the column that you want to aggregate. In this case, it’s the Product Name. Then, go to New Groups.

Then, within we can create these groups quickly and in a dynamic way. This is a demo data set, but what might happen is that you’ll have a data set, which has a lot of values, and you might want to aggregate these in some way by creating a new dimension.
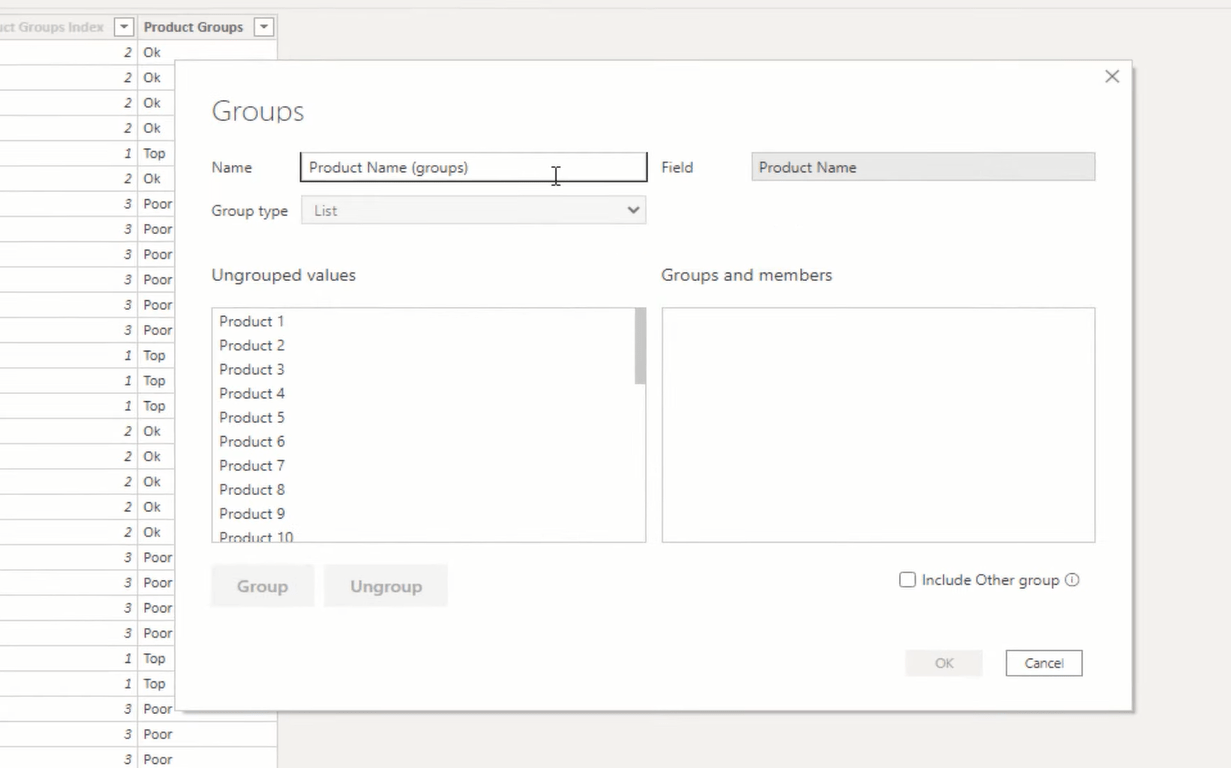
In this example, I’m going to call this Product Categories. Then, by just holding down the control key, and clicking on the products of my choice, I can create a group. And so, you can see below that I have three groups, namely Export, Local, and Wholesale. I can add more categories here, or I can simply click on Include Other group, which creates a category that contains all ungrouped values.
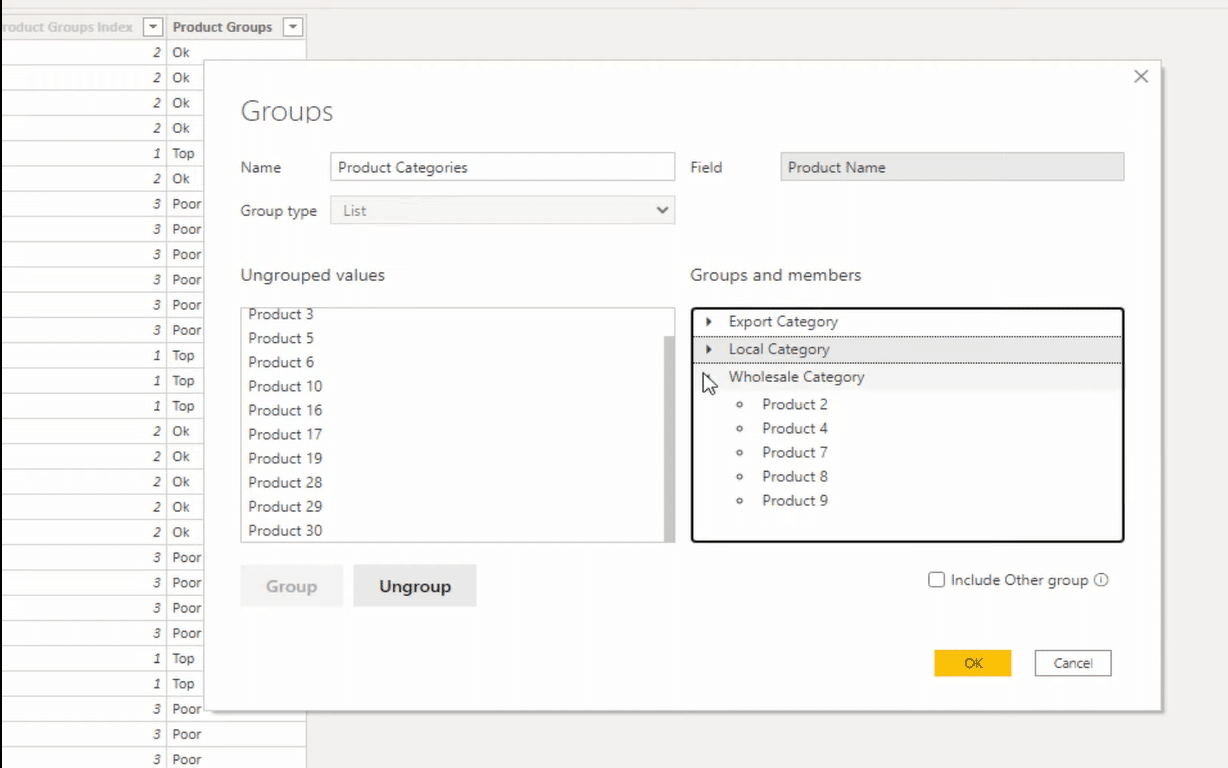
This will make a lot more sense on the data that you’re actually operating. I used to use this extensively. I had a lookup table that was more than 500 with close to 1,000 unique values. That was going to be no use to me on a table. A thousand values are not going to produce any insights.
So, what I wanted to do was to roll these up into a different calculation or create a different dimension that I could aggregate at. I didn’t need to create a new table. I could just create this virtual grouping. Once I click OK, we can see that this grouping or dimension has been placed inside my report.
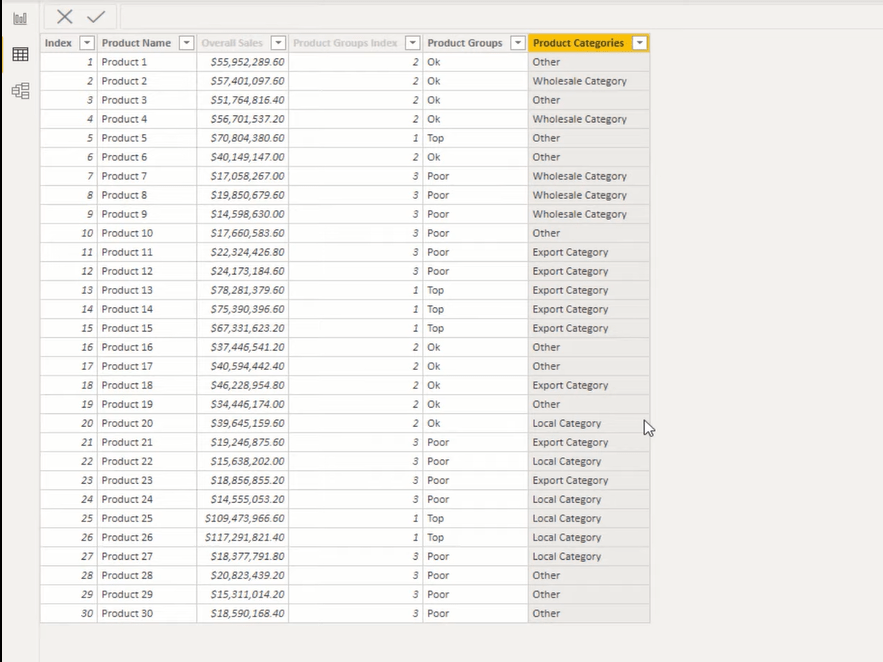
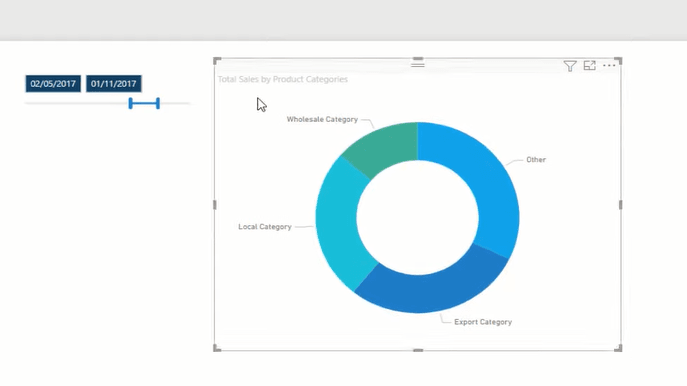
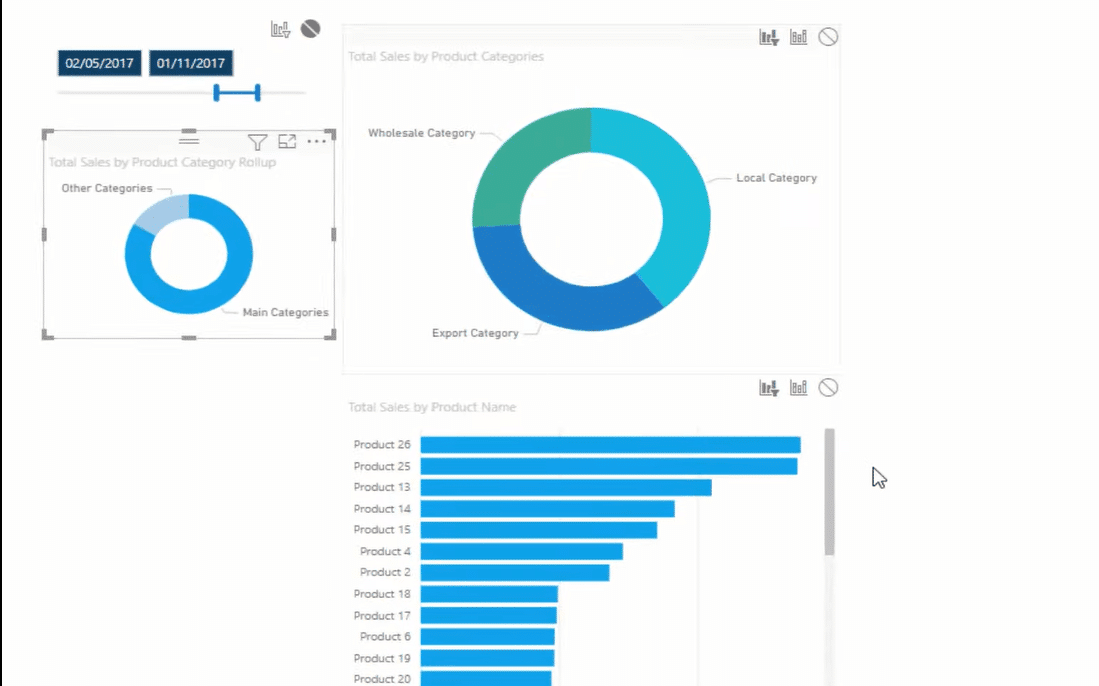
I can then use this dimension to create a visualization, which has rolled up at a different hierarchy. We don’t see every single product here, which would look ridiculous. Now we have this grouping system that didn’t exist in my model earlier.
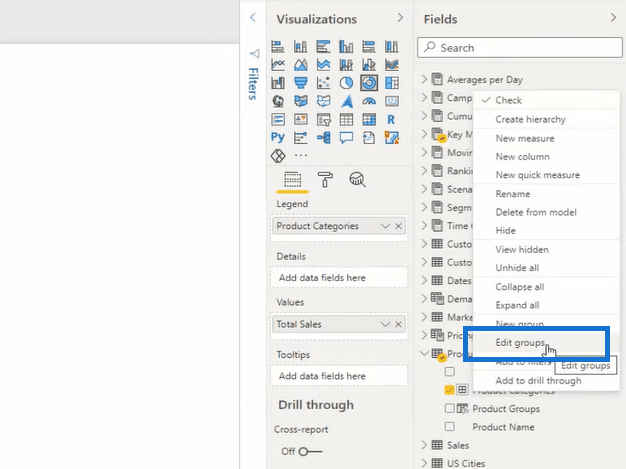
This can also be used as a filtering mechanism because it’s part of your core model. You can always update these groups as well. Just go back to the Product Name, click on the ellipsis, and go Edit groups.
What’s also cool is that we can create groups on groups. To do that, we go to the ellipsis on Product Category and click on New Group. Within here, we can create groups out of the groupings or categories we created (Export, Local, Wholesale, Other).
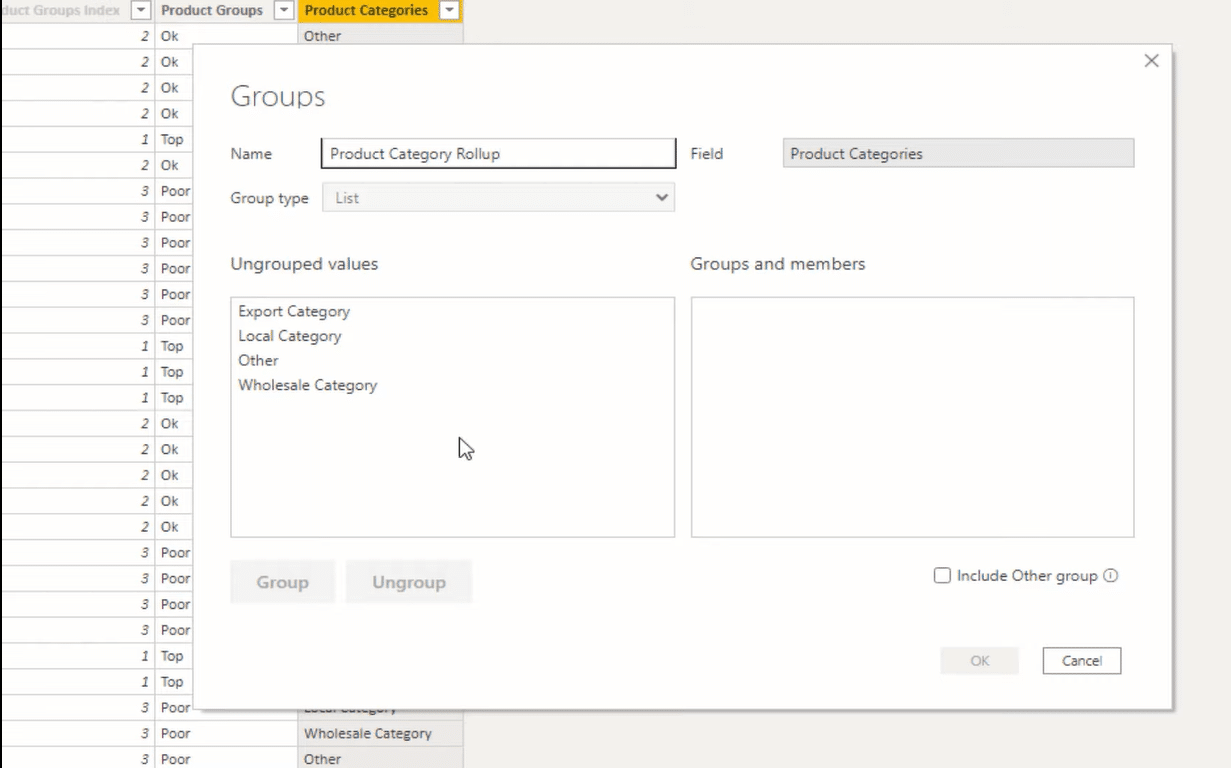
With that, I can create another visualization, where I can drill down to the products.
***** Related Links *****
Building Data Dimensions In Power BI
Filtering Data By Custom Fiscal Years And Quarters Using Calculated Columns In Power BI
Custom Dynamic Segmentation Using DAX In Power BI
Conclusion
Adding custom dimensions helps you filter your tables in your reports. It enables you to create visuals that look easier on the consumer’s eye and easier for them to navigate around.
I’ve shown you several ways to create additional dimensions in your Power BI reports. I hope you’ve found this tutorial helpful. I highly recommend that you implement these techniques to build insightful reports.
Cheers!
Sam
[youtube https://www.youtube.com/watch?v=XWC_RRsSlno&w=784&h=441]


