February was a busy month here at Enterprise DNA as we continue to make sure that everyone’s getting as much valuable content as possible from our team. We’ve always advocated for better opportunities to learn and develop our skills as a community, and the things we did in February are great steps toward that goal. You may watch the full video of this tutorial at the bottom of this blog.
2021 Course Content Rollout
In January, part of our monthly update was to tell you about the new course about optimizing DAX by one of our Enterprise DNA experts, Nick Moné. Well, that was just the start. True to our promise of delivering courses made by our experts, we’ve rolled out the list of courses you should watch out for this year.
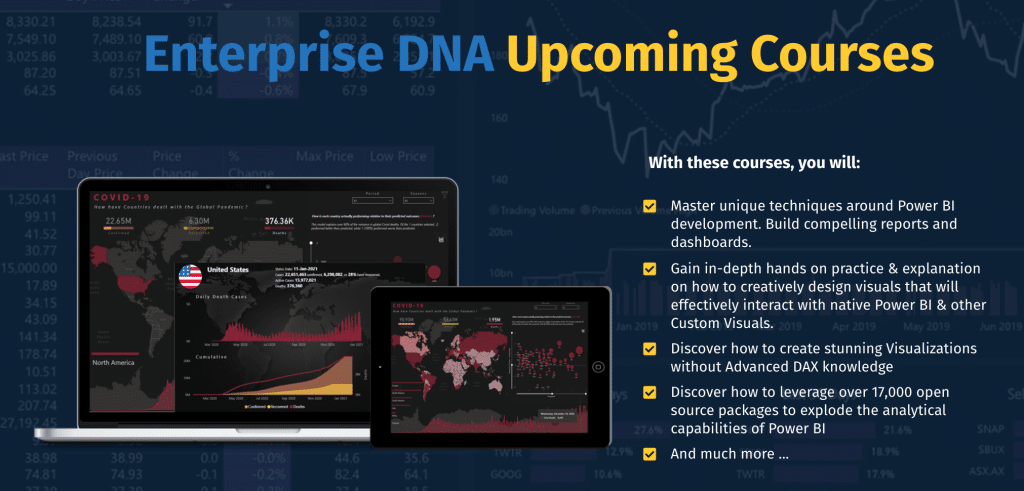
The first quarter alone already has amazing topics lined up. We started with the DAX optimization course in January, and have released a course called Mastering Report Development by Jarrett Moore in February. This March, we’re going to see a course called Advanced Visualization Techniques, the first installment in a two-part series by Mudassir Ali.
For the rest of the year, be ready for courses about geospatial analysis, the Power Query, machine learning and so much more.
Mastering Report Development – Start To Finish Course By Jarrett Moore
As mentioned earlier, we launched the course Mastering Report Development – Start To Finish by Jarrett Moore on the Enterprise DNA Education Platform.
Those who have been following our Power BI Challenges might remember Jarrett’s amazing submission for Challenge #10, which tackled Supplier Insights. Because of the overwhelming feedback, we realized that a lot of people could put reports like that into good use. That’s why Jarrett is giving a detailed tutorial of how he develops his reports from start to end.
Those who enroll in the course will learn:
- Jarrett’s step-by-step process on creating high-quality reports that can be applied to any reporting task
- How to create backgrounds using PowerPoint to improve the aesthetics and performance of your reports
- How to set up an efficient Power BI data model that will support advanced analysis
- How to organize measures into subfolders
- How to use icons, buttons and bookmarks to develop an intuitive user navigation experience
- How to incorporate recently added features into your report – Zoom Sliders, Anomaly Detection & Smart Narratives
- Becoming proficient in creating advanced DAX measures using variables
Anybody who eventually wants to become a Power BI expert will definitely pick up a number of tips and tricks here that can change the way they can maximize the tool.
Here’s Sam, Jarrett and Brian discussing Jarrett’s course.
PBIC 11 Concluded
We concluded the first Power BI Challenge of the year, and wow, it was a tough call! There were amazing submissions in this round, each having its own unique way of delivering insightful data in creatively made reports.
The 1st Power BI Challenge for the year required participants to show the current status of the COVID-19 pandemic using actual data taken from the extensive resources provided by the John Hopkins University. The numbers mostly focused on the number of confirmed cases, deaths, and recoveries.
What made this round unique was the fact that the winning entry is a result of the combined efforts of an entire team working on a single report. The JMAP team, who bagged the prize for Challenge #11, was made up of Enterprise DNA experts Brian Julius, Jarrett Moore, Mudassir Ali and Greg Philps.
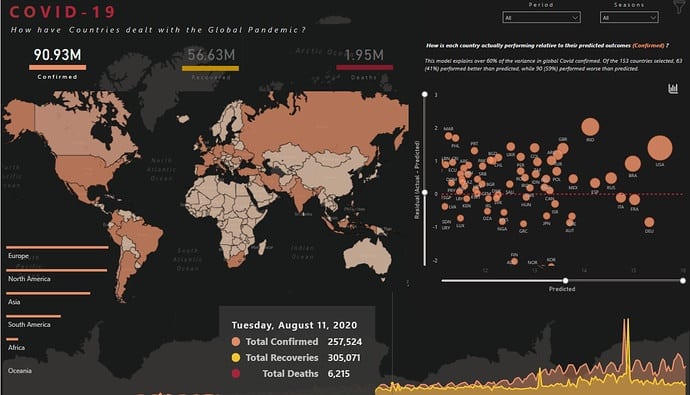
The team’s writeup was just as incredible as their report. It detailed how they split the responsibilities among the members of their team, playing on each person’s strengths. That level of cooperation allowed them to create an amazingly insightful report.
Congrats again, JMAP!
Three Brand New Showcases On COVID 19
The Power BI Showcase features reports and dashboards that can be downloaded and used for real hands-on experience by Power BI users. Each showcase focuses on a unique industry and purpose, showing how dynamic Power BI is as an analytical tool.
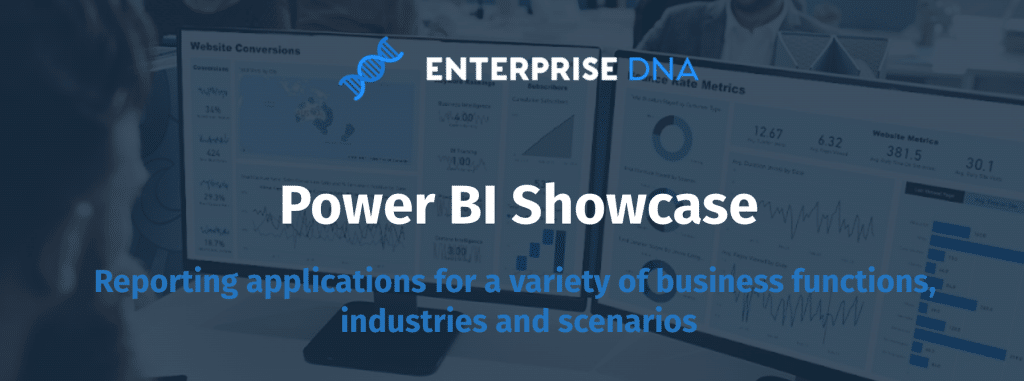
Seeing the amazing reports submitted on the 11th Power BI Challenge (especially the winning report we just talked about), the newest reports in our showcase are three of the best submissions from that recently concluded challenge round.
Each of these reports take a different perspective and show different ways to deliver insights based on COVID-19 data, with some reports looking at each country’s numbers, while some zoom in on specific states. Again, this plays to the main goal of the Power BI Showcase. Not only has the entire Power BI Challenge been showing that it can be used across different industries, these three reports clearly show that a single tool can be used to deliver different sets of insights while working on a single industry as well.
Power BI Mastermind (Member-Only Event) Launched
An Enterprise DNA membership has always had amazing value, considering the amount of resources members have access to. This year, we promised to add even more value to every member. That’s what we’re doing by launching the Power BI Mastermind series.
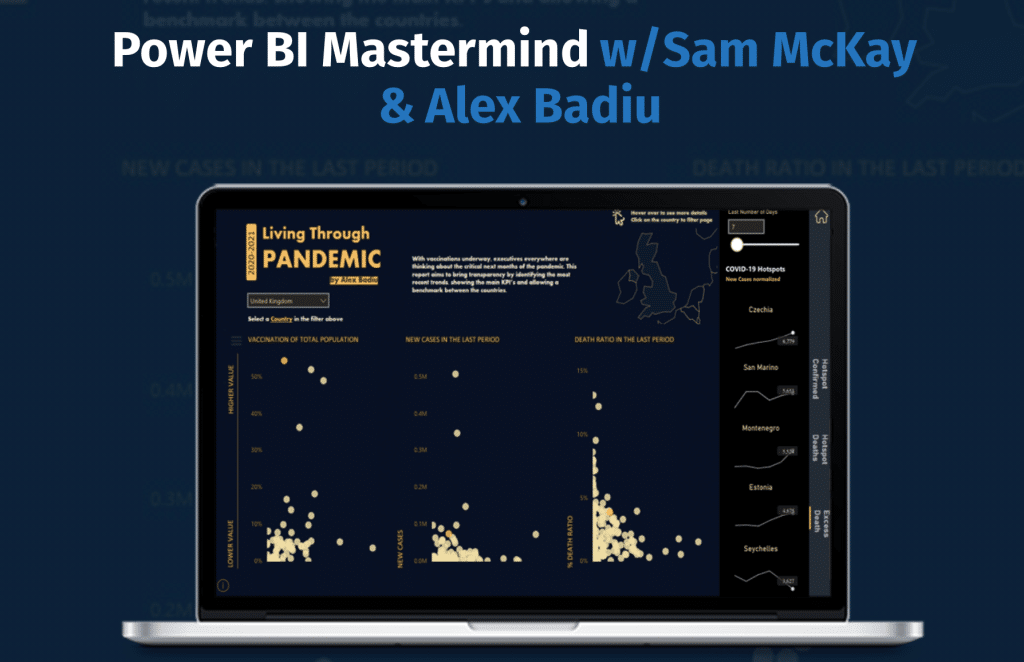
A member-only event, the Power BI Mastermind is a series of live workshops for analysts, Excel users, database professionals, data enthusiasts and more. We currently have two Mastermind sessions, one with Sam McKay and Alex Badiu, and another one with the eDNA Covid Dashboard Expert team.
These sessions will allow attendees to ask questions and find out tips and tricks from our experts about data modeling, mapping, development of tooltips and custom visuals, R integration, data storytelling and design strategy.
So if you aren’t an Enterprise DNA member yet, take this as a sign to finally signup and become a member!
Business Intelligence Summit Concluded
We’ve concluded the Business Intelligence Summit, and we must say that those 4 days were amazing.
Imagine over 30 hours of content that cover Power BI techniques and multiple showcases that you can download — all for FREE! It was a huge success, with thousands of attendees learning about:
- Evaluating your data and planning your model
- Thinking analytically and developing effectively
- Enhancing your insights and value proposition
- Distributing your analysis and driving better decisions
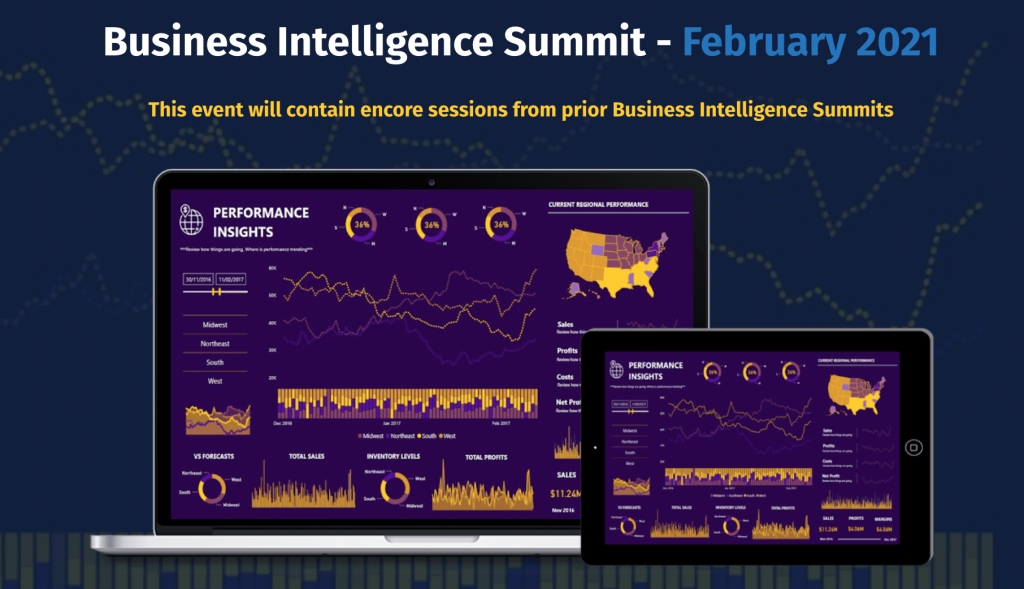
Those who registered for the event still have access to the materials used for a few days before we move everything into a members-only section. Seeing the success of this summit, we’re definitely coming up with more events like these for you soon.
17 Episodes Played In The Analytic Mind Podcast Covering Various Industries
In January, we announced the launching of our CEO Sam McKay’s podcast called The Analytic Mind. Now, we have 17 episodes that you can listen to.
Data opens up so many learning opportunities, knowing that there are many facets to it and can be seen from different perspectives. Through his podcast, Sam invites different data leaders and talk to them about trends, challenges, and opportunities for innovation in the world of data and analytics.
The Analytic Mind can be accessed through Spotify, iTunes and Google Podcast. If you’re a data leader or know someone who can share insights and knowledge by guesting on our podcast, just click this link.
Five New Apps In The Analyst Hub
We launched the Analyst Hub last year with the intent of giving Power BI users all the apps they need to create powerful reports and dashboards.
Initially, we had the DAX Clean Up tool, which helps users clean up and properly format their codes. The Colour Theme Generator was just as useful, giving users the chances to create beautiful reports through the use of different colour palettes.
Now, users have access to 5 more powerful apps within the Analyst Hub:
- Power BI Portfolio – allows users to share links and images with the user’s team and the entire Analyst Hub community
- Analytics Planner – allows users to plan their analytics workload right inside the Analyst Hub
- Priorities Matrix – allows users to set priorities for tasks assigned to their team
- Data Model Planner – allows users to plan their data model workload inside the hub
- Data Pipeline Planner – allows users to improve their workflow and plan their data pipeline with their team
The Analyst Hub also contains the EDNA 1.0 bot that answers Power BI and DAX queries, as well as the Knowledge Base, which houses amazing Power BI tips and techniques that any user can take advantage of as they work.
Stay tuned to the Enterprise DNA Blog and stay connected to our community at the Enterprise DNA Forum for more updates and announcements.
All the best,
Enterprise DNA Team


