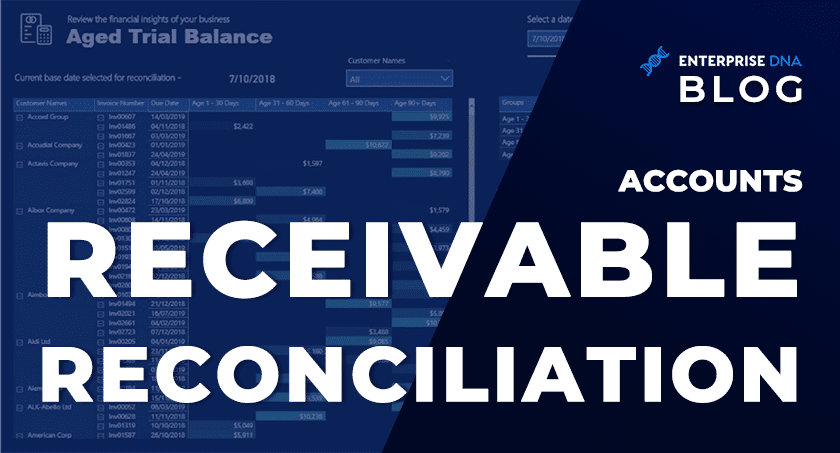
In this tutorial, I want to talk about how to use dynamic grouping in Power BI for your accounts receivables so that you can understand when the cash is coming into the business. You may watch the full video of this tutorial at the bottom of this blog.
This is a real-world application of Power BI, especially within the accounting and finance space.

This tutorial is a breakout session from the full financial reporting course released in Enterprise DNA Online.
Dynamic Grouping In Power BI Reports
For this example, I have a large company that receives many invoices.
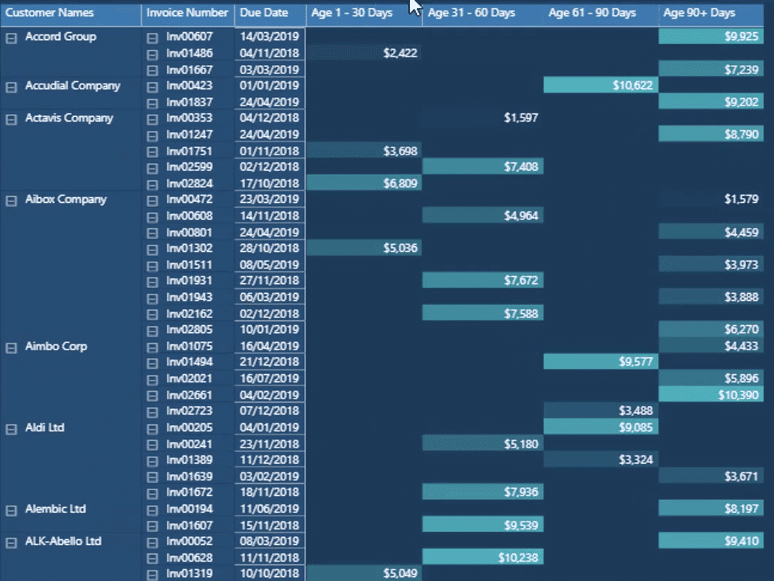
I’ve grouped the invoices based on certain amounts of time, for example, 1 – 30, 31 – 60, 61 – 90, and 90+ days. I can see when the cash is expected to come in from a customer.
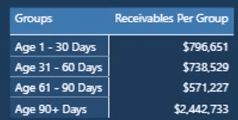
I can also see a summary of the total cash coming in from all the customers.
Now, this is a fully dynamic report. So, I can change the date selection of the report using the slicer, and then automatically get an updated report that shows what things will look like at a certain time on a certain day.

This method is better compared to other static examples for financial analysis.
Now, I’m going to show you the DAX formula behind this technique.
The main topic is dynamic grouping. You need to know how you can dynamically group these pieces of financial information.
This is a very reusable technique that can be used in many situations or scenarios that you’re dealing with in Power BI.
For this example, I’ve created a new page containing a table with my Customer Names, Invoice Numbers, Invoice Dates, Due Dates, and Selected Dates.
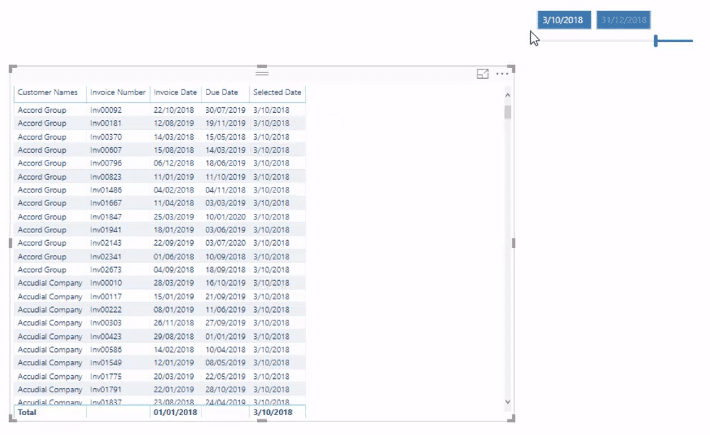
The Selected Dates column reflects the selection you’ve made using the slicer. For this example, the Selected Date is the 3rd of October.
The dynamic aspect behind this report is created using the slicer.
Making An Analysis From Receivables
Let’s look at the model.

You can see the Invoices table. Now, the unique thing about it is its relationship to the Dates table.
They’re both inactive. This is what you need to do when dealing with multiple dates inside the Fact table.
Creating inactive relationships is the key to making dynamic grouping work in Power BI.
Now, let’s look at the logic of the formula used.
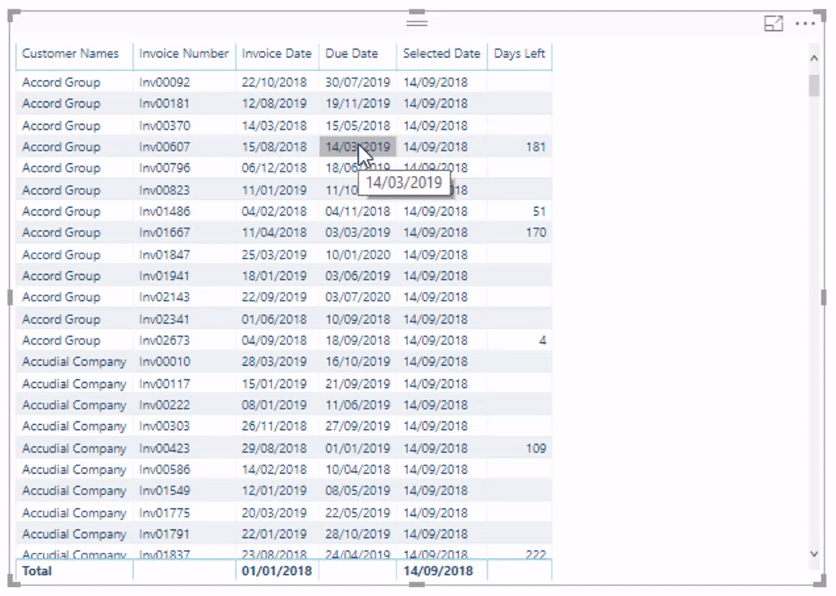
You need to work out how many days the Due Date is from the Selected Date. However, you also need to check if the Invoice is live. You also need to understand why you can see blanks in the Days Left column.
So, let’s use the first row as an example.

You can see that the Due Date is after the Selected Date but the Invoice hasn’t been issued yet based on the selection. So, you don’t need to include this particular Invoice because it didn’t exist at the current state of the particular date.
So, if you extend the date selection using the slicer, the Invoice becomes live because it’s now invoiced before the Date Selected.

So, you’re only looking at the live invoices a customer has during a particular time.
You now have information on the number of days each invoice has until they’re due. And because of this information, the dynamic grouping technique in Power BI can now be used.
Placing Receivables Into Groups
You can now put the Invoices into groups.
First, you need to create the groups and bring them in as a supporting table.

You can see that the Groups are grouped according to Age. There’s Age 1 – 30, 31 – 60, 61 – 90, and 90+ Days. The invoices are going to be categorized into these four distinct groups.
The Min and Max represent the range of the groups. All the relevant Invoices will fall into one range.
This is the formula that I’ve used.

This part of the formula iterates through every single Invoice and creates the Day’s Left for each Invoice.

It will assess if the Date is greater than a Min and less than a Max and then evaluate to TRUE on one of the groups.
If it does evaluate to TRUE then, it will CALCULATE the Invoice Value.

Now if you drag this Receivables Per Group measure to the table, it will give you this information:
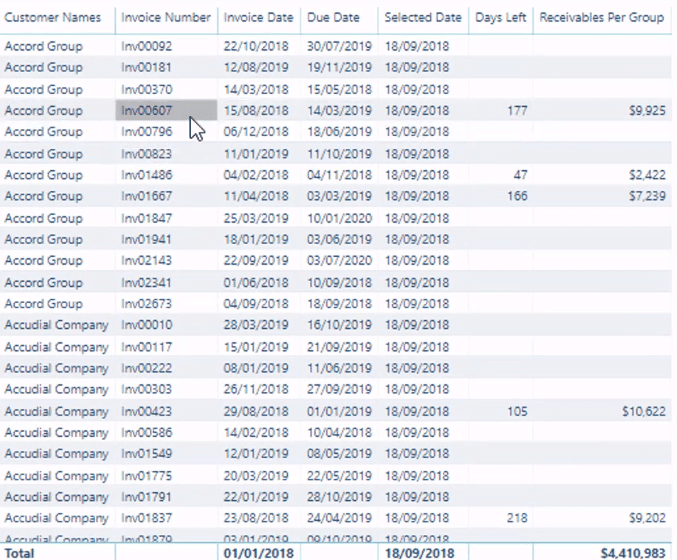
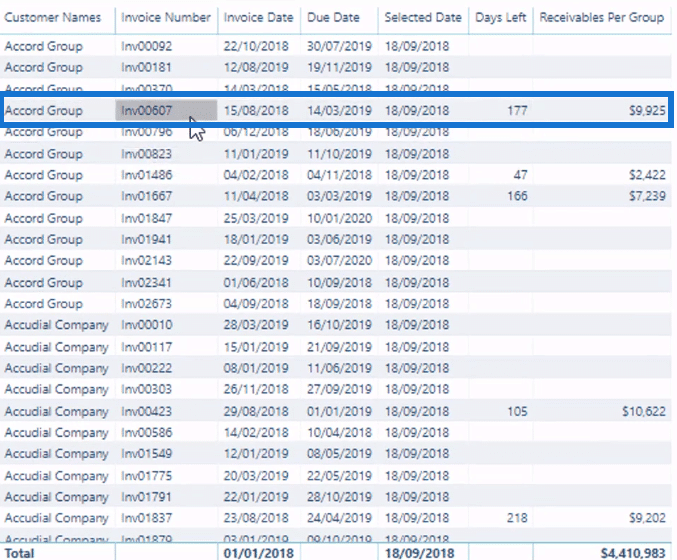
With that context in the table, you’re now only looking at one Invoice per row.
The table is now being filtered for only one Invoice. So, the Invoice with the 177 under the Days Left column is placed in the Age 90+ Days Group.

Showing The Dynamic Grouping In The Table
To make the Groups show in the table, I’m going to first turn the table into a matrix.
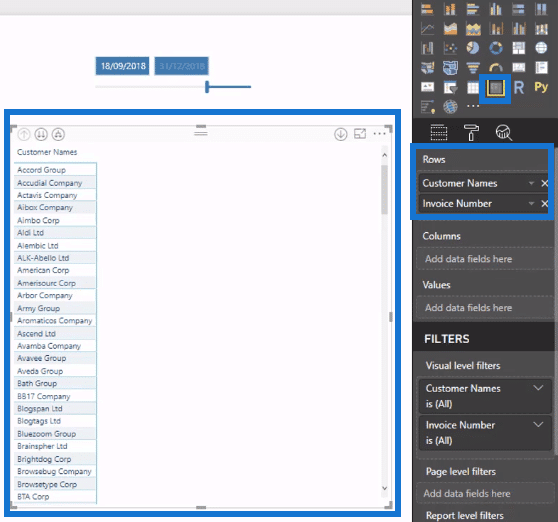
Then, I’m going to bring in the Groups measure into the table by putting it under Columns.

You can see that there’s an error in showing the results. But when you add the Receivables Per Group formula into the table, you’ll be able to see the specific groups.

I now have all the Receivables for each individual client.
If you want to have a more granular level of the actual Invoice, just click the third arrow located in the upper left corner of the matrix.

The Invoices are now in their specific groupings.

***** Related Links *****
Group Customers Dynamically By Their Ranking With RANKX In Power BI
Power BI Customer Segmentation: Showcasing Group Movement Through Time
Power BI Dynamic Ranking By Group
Conclusion
Dynamic grouping is a very powerful technique from an analytical point of view. You’re able to have a dynamic way of regenerating the calculations and seeing how things happen through time.
When you incorporate that into other financial reporting techniques in Power BI, you’ll be able to get more insights from your report.
Once you understand the concepts of this technique, you’ll see how it can be applied to different situations to generate very valuable analyses.
All the best,
Sam
[youtube https://www.youtube.com/watch?v=5_KDJGPjMnI?rel=0&w=784&h=441]

