

This tutorial aims to discuss how to calculate distance and bearing in Power BI and how to efficiently use them for geospatial analysis.
You can find a lot of distance calculations on the web. For this demonstration, I’ll use a simplified example of a solution I needed to build for one of my supply chain network projects.
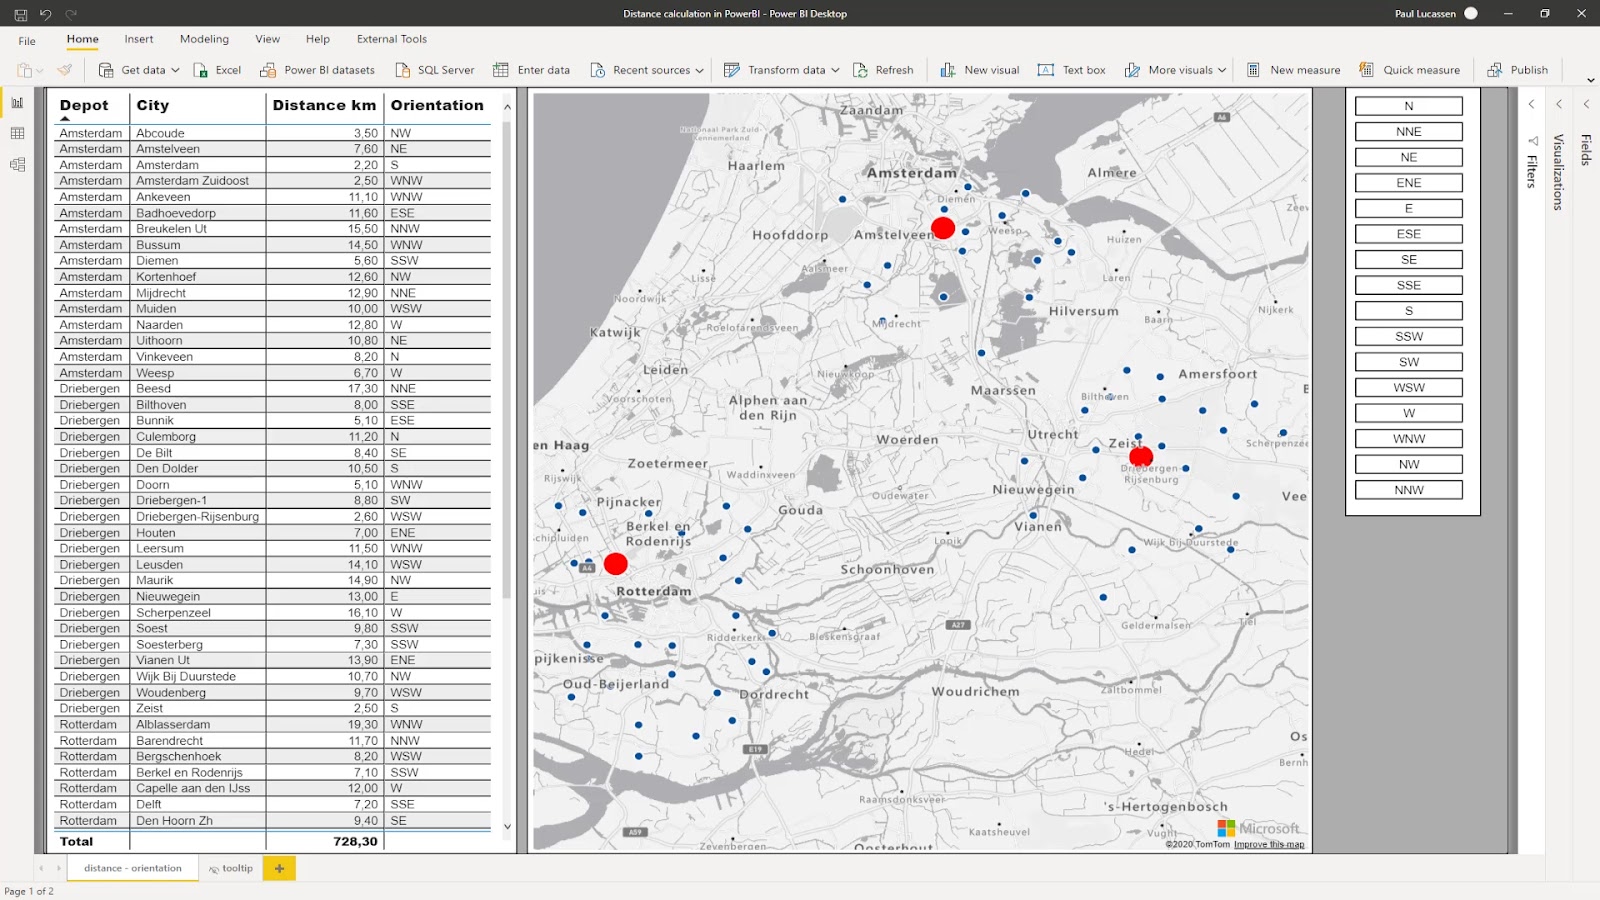
I’ll also show the calculation of the straight line distance from a delivery depot to service locations.
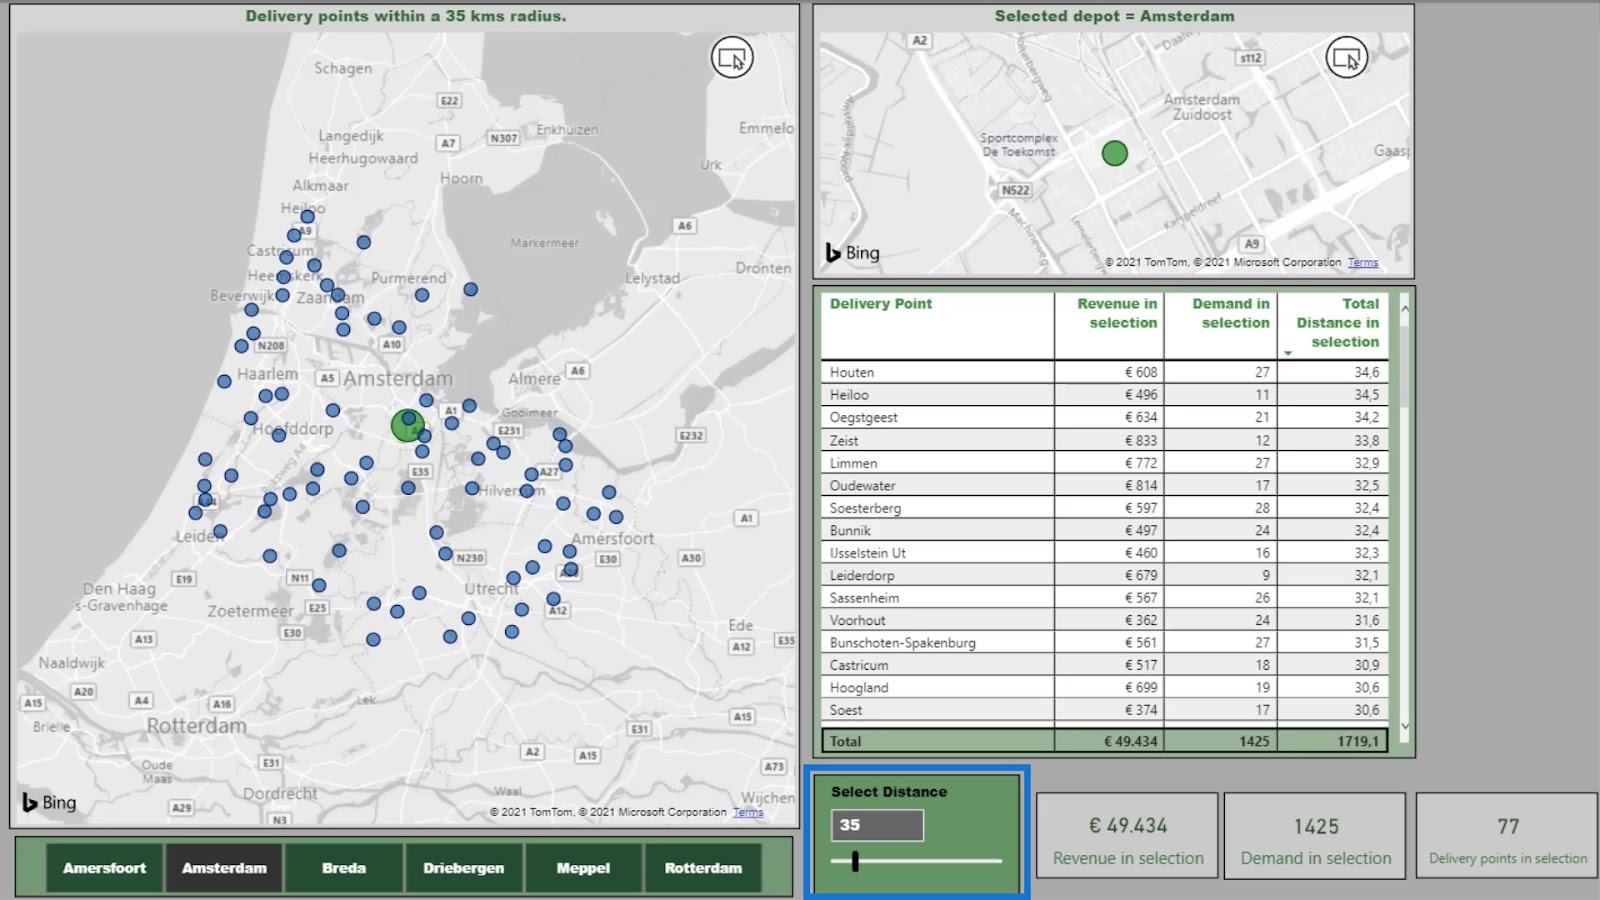
Here, I have a slicer to select a distance using a DAX measure. This allows dynamic analysis of the customers, flows, weight, revenue, and any other value within the selected distance.
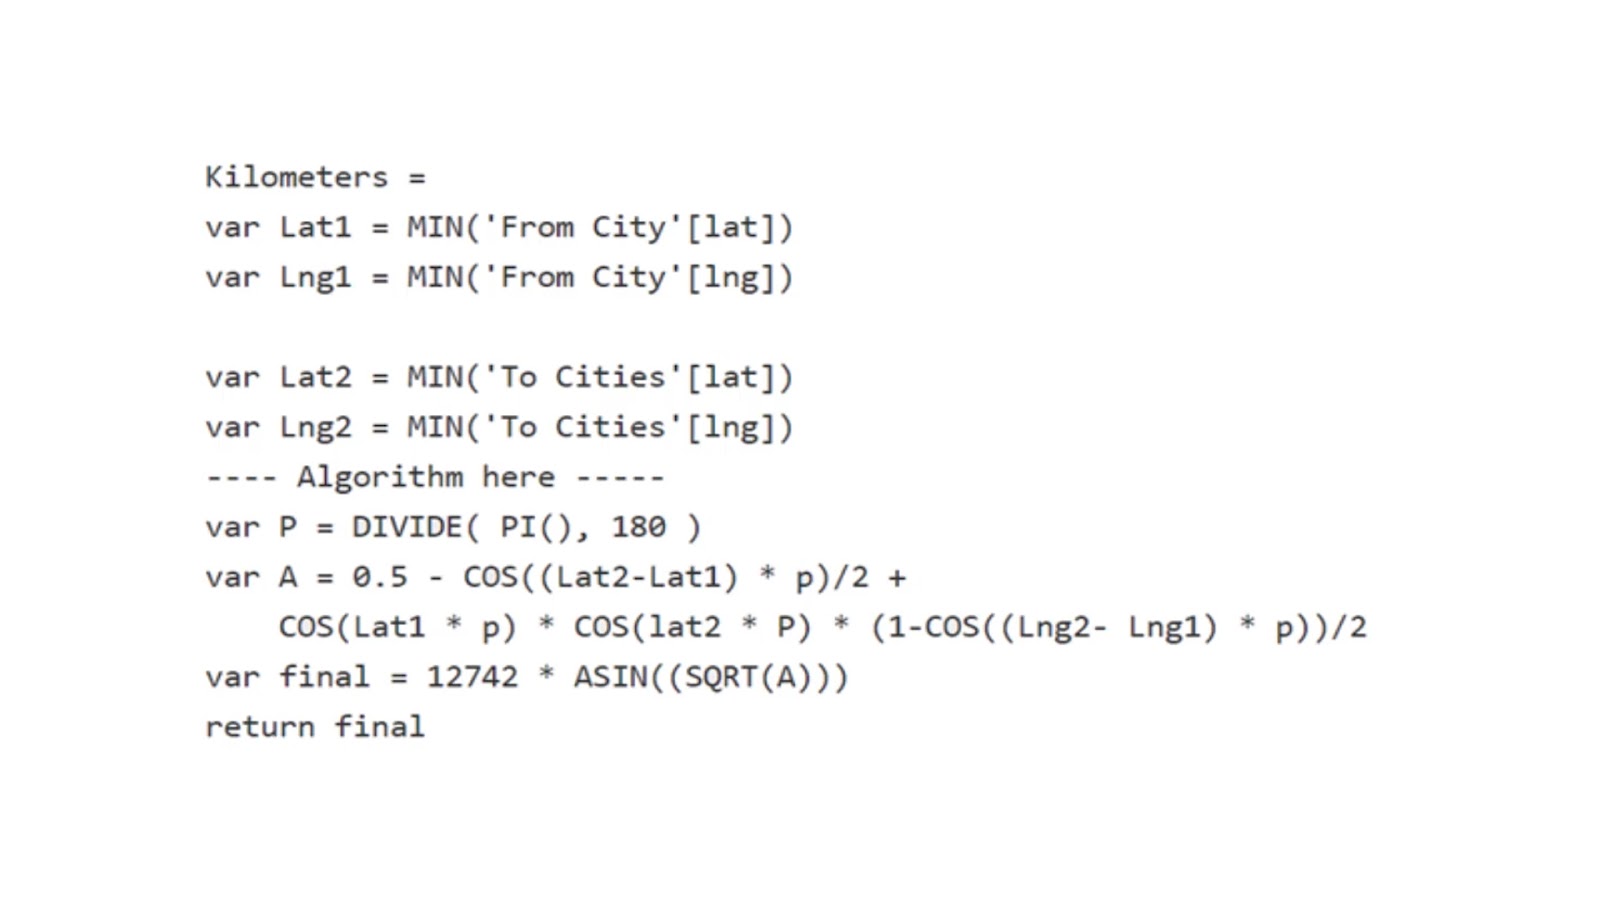
The great-circle distance calculation also known as the Haversine formula is the core measure for this tutorial. If you master this technique, you can tackle any required distance and bearing calculation.
Although I prefer to do most calculations in Power Query, it’s required to use a DAX measure when you need to analyze the data dynamically based on the selectable distance.
If available, the actual distance could be the preferred option. However, you won’t need this in many cases as the straight line distance will be sufficient.
Google or Bing API can be used to add the distance in Power Query for both the actual and straight-line distance. It’s a good practice to have more tools in your geospatial toolbox. However, applying API to Power BI will not be discussed in this tutorial.
Understanding The Scenario
I was asked to help with the allocation of the nearest business to business parcel lockers to service engineers’ home addresses.
The service engineers worked in predefined working areas that could change over time and started that job from home.
Overnight, the replenishment of urgent spare parts took place to the parcel lockers. The following morning, the engineer would collect the spare parts from the parcel locker on his way to his working area.
Normally, I use GIS (Geographic Information System) software to do this kind of analysis. But now, I’ll try to do it with Power BI to obtain a dynamic allocation model. I also used both the straight line distance and bearing calculations.
In GIS, bearing angle is used for navigation or direction. In this example, I added the bearing that’s converted into a direction (Orientation) because the Distance itself doesn’t offer the full solution.

The nearest parcel locker might be positioned in the opposite direction from the working area. So, I wanted to display the direction as well.
This allows restricting the selection for the locker allocation to be based on corresponding geographical headings with the working area.
As an example, the working area is North of his home. So, the preferred parcel locker location should be in the same direction.
Analyzing The Distance And Bearing Dataset
In this simplified example, the dataset comprises addresses in the Netherlands and the free parcel locker locations.
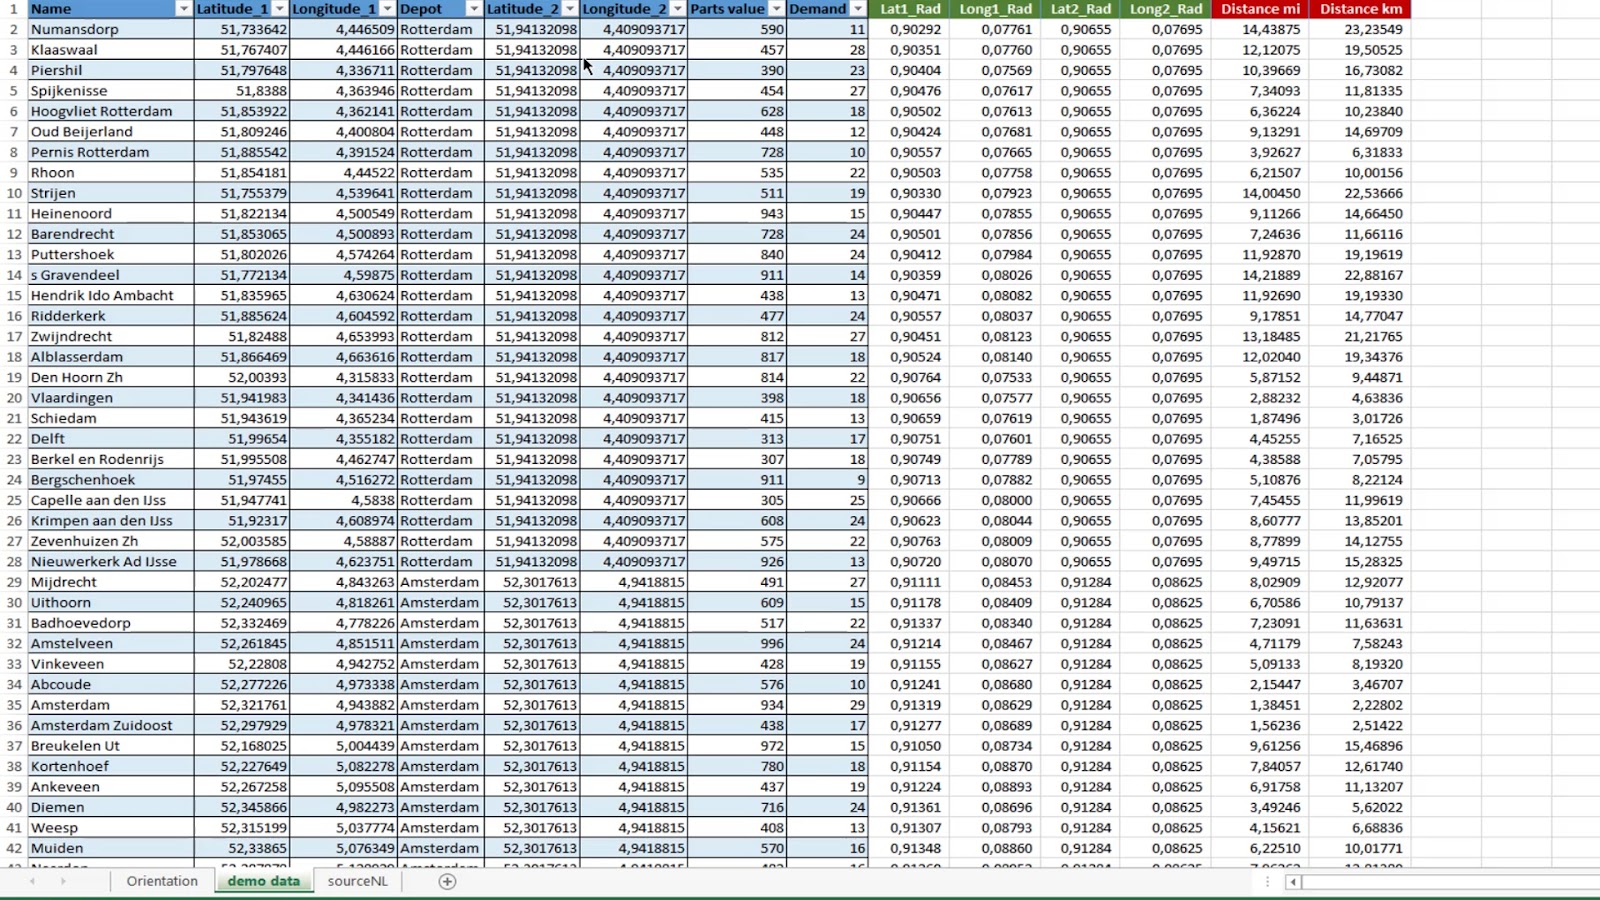
This contains columns for the Latitude and Longitude (to and from), Depot, Name, Parts value, and Demand.

Adjacent to the initial table are the calculated columns and the distance calculations in Excel. First, I calculated the radians.

Then, I created the actual distance calculations for both miles and kilometers using the radians and Haversine formula.

Distance And Bearing Calculation: Creating The Demo Data
The calculations for the bearing initially result in a decimal number in degrees. So, I need to convert this into something more practical.
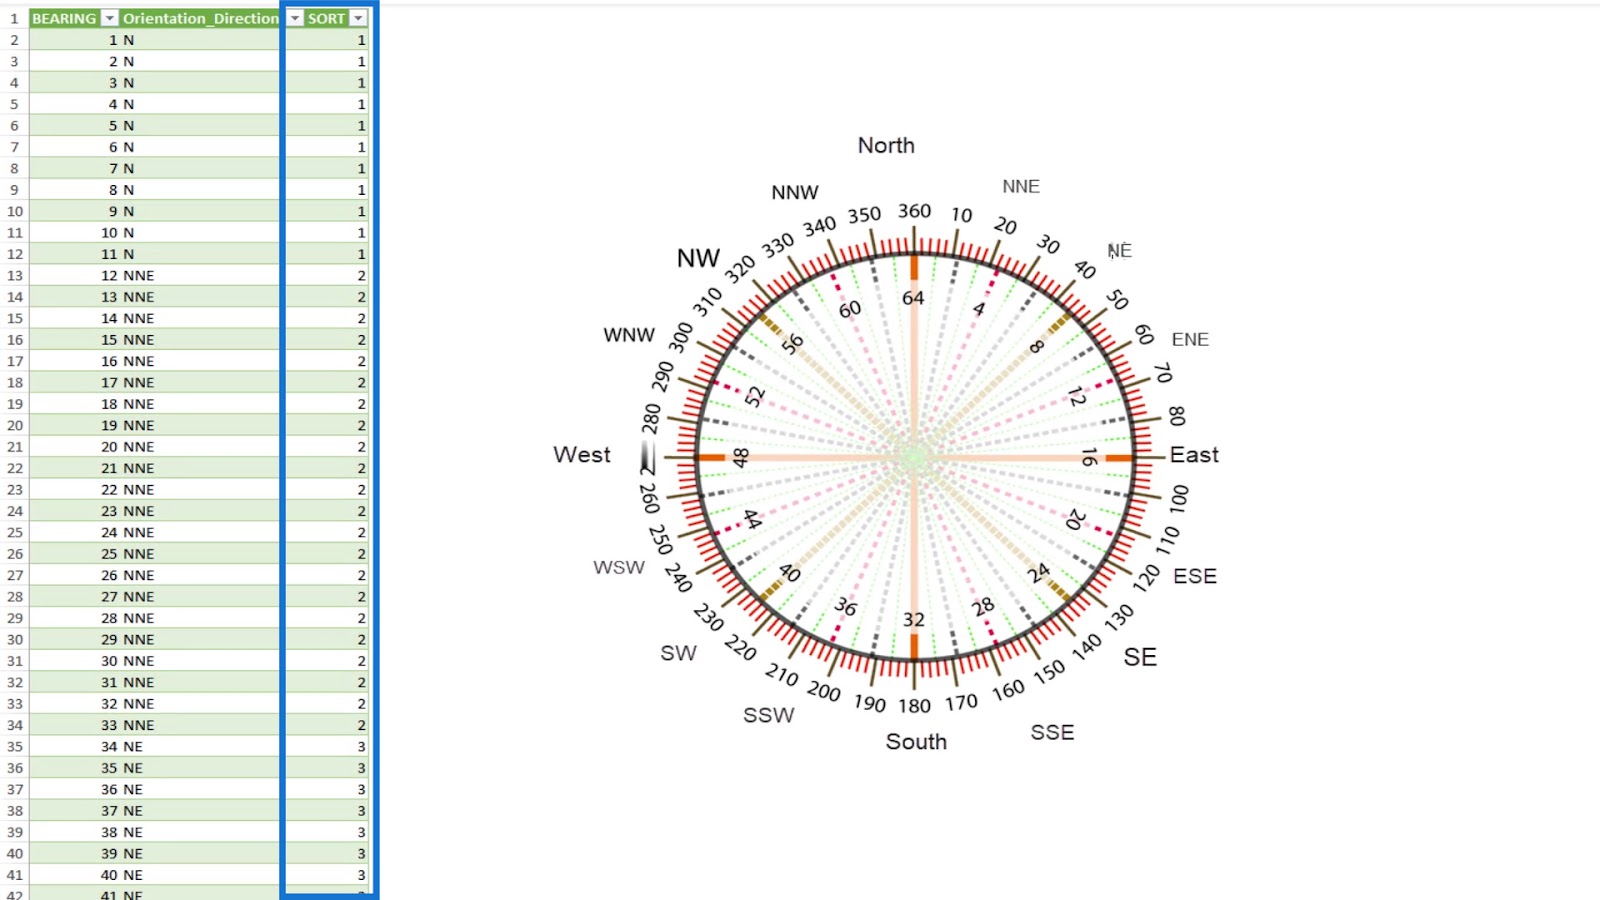
I created a table column with the degrees from 1-360. I also added a column for the directions as per the compass.

Moreover, I added a SORT column for sorting the directions clockwise in Power BI.
After that, I loaded the sourceNL dataset and the Orientation table in Power Query.

Let’s take a look at the sourceNL table.
Adding The Columns
First, I added an Index column. Whenever I do transformations in the editor, I add an Index column either for reference or for sorting.
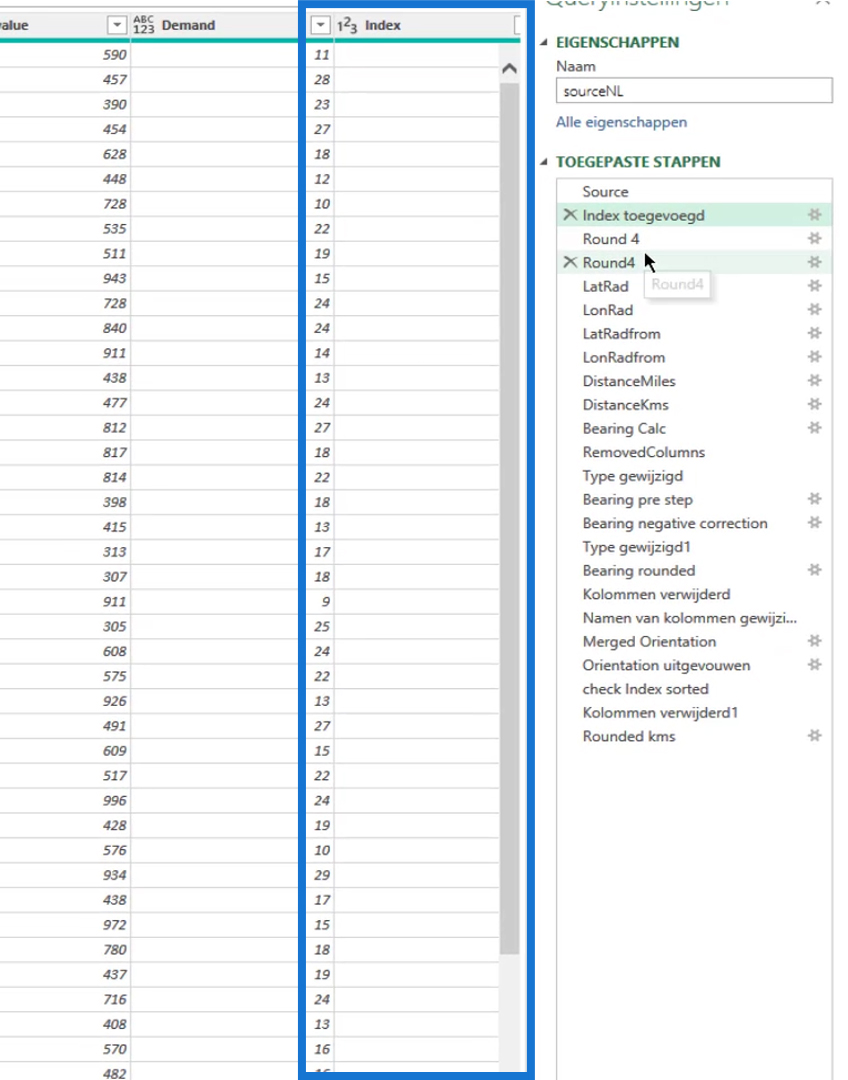
Then, I rounded the latitude and longitude to 4 digits, which is important in bigger datasets. By doing this, it will return an accuracy of 11 meters which is still enough.

For the sake of this example, I have added each step in a separate calculated column to show the map. I calculated the radians of the latitude and longitude values, just like what I did in Excel.


Then, I applied the Haversine formula to calculate the distances both in miles and kilometers.


Bearing And Orientation
For the bearing, the calculation is another formula that I took from the web. I just tweaked it a bit to fit my purposes for this scenario.

Initially, this calculation is in radian. It’s completely useless. So, I need to convert it.
This is the Bearing pre-step. This is for converting the radians into the next step of my calculation.


For the next step, I changed the negative numbers and corrected them by applying this calculation.


After that, I rounded the Bearing to get a whole number.


I deleted the Bearing (rad), Bearing pre, and Bearing columns. Then, I renamed the Naar boven afronden column as Bearing Roundup.


I can now merge the Bearing Roundup column in this table with the BEARING column from the Orientation table.


By doing this, I would be able to obtain the direction.
Now, I have the bearing (Bearing Roundup) and the direction (Orientation_Direction) columns that I’ll be using for the next model.
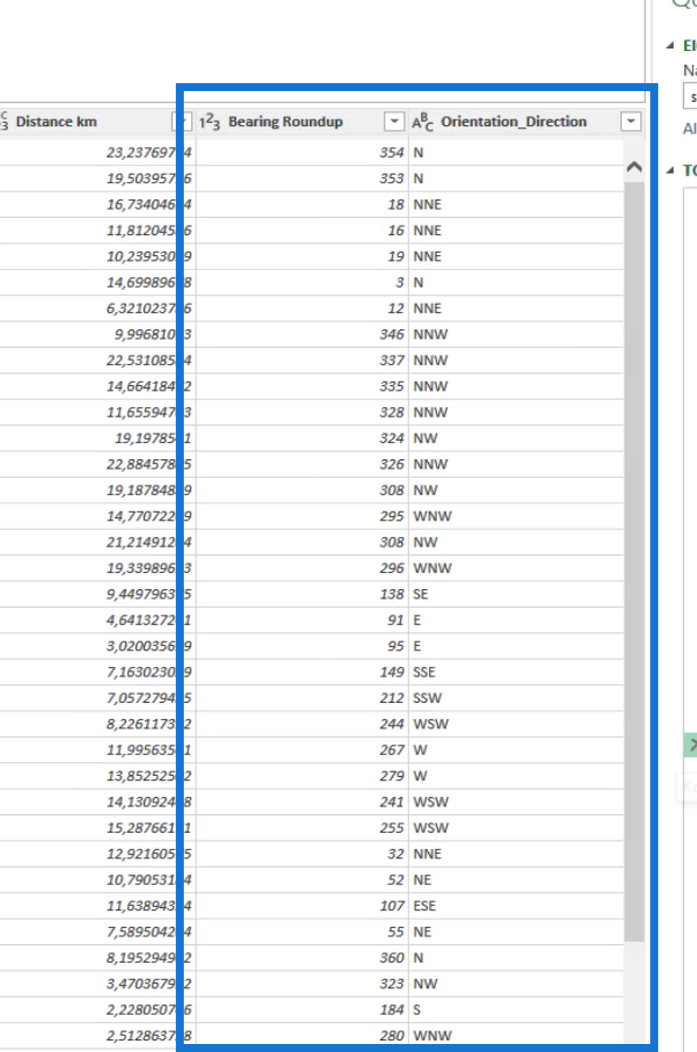
Here’s the result in Power Query.

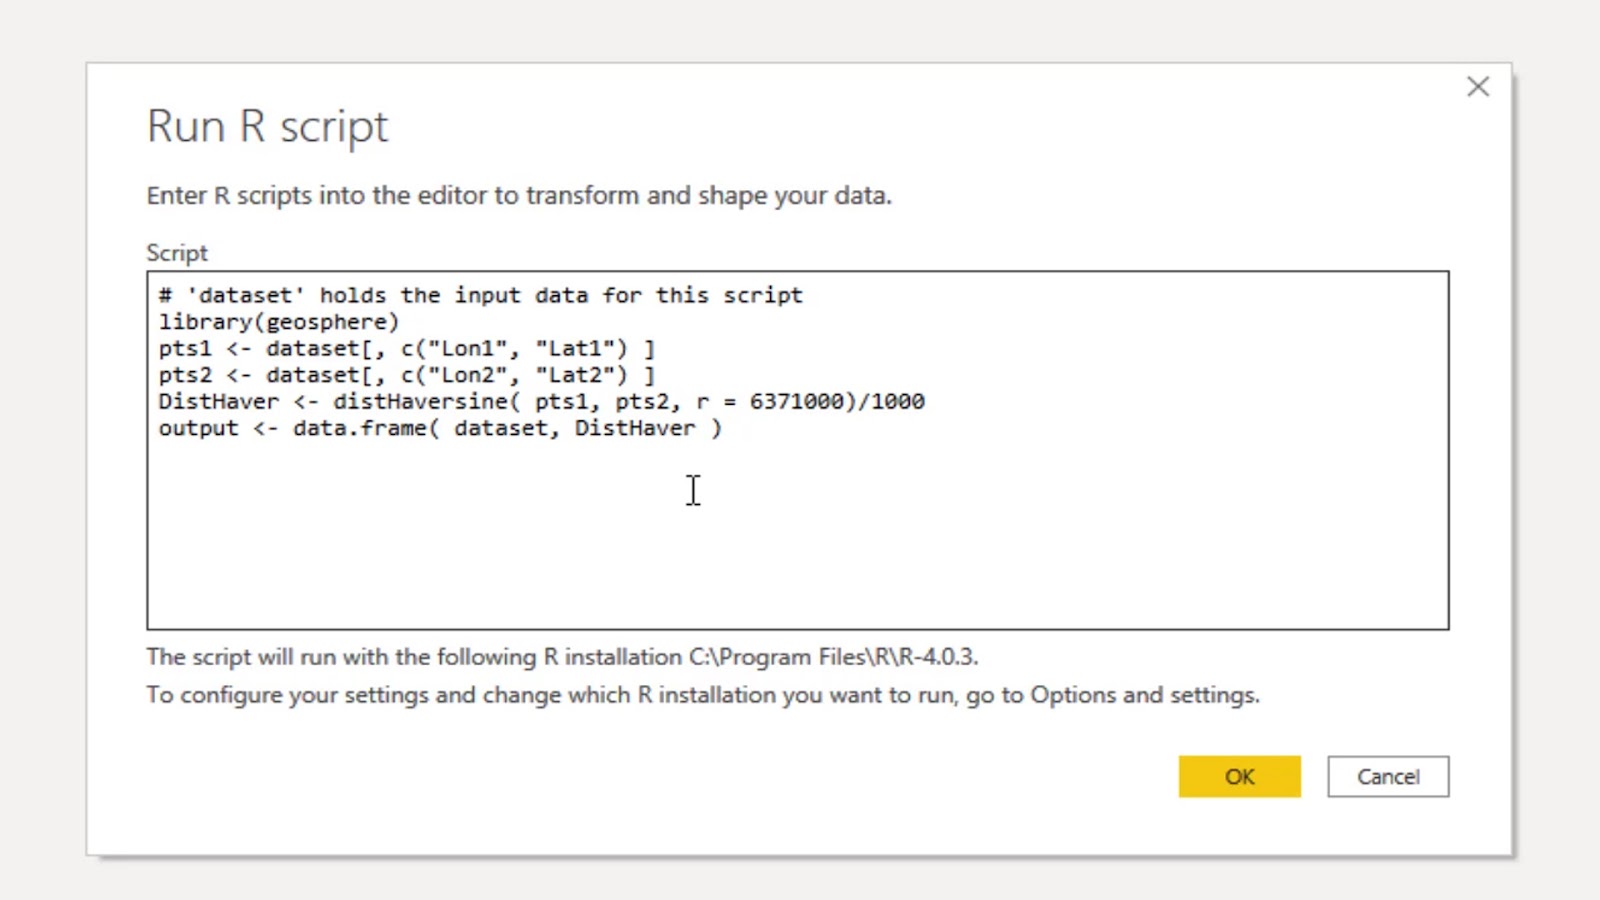
R Script For Distance And Bearing Calculation
For this one, I’ll be using a solution with an R script. This is a dataset with the calculated distances in miles and kilometers.

I’m running this R script which is much shorter and cleaner than the formulas.
After running the R script, I now have 3 tables.

Here’s the output. I also rounded it off.

As you can see, the results for the R script calculation and the Excel calculation are similar.

Adding Map Visuals
Lastly, I’ll add a visual display to the end result.
To do that, I repeated the steps in a Power BI report. I loaded the table with the 3 locations. I also loaded the Orientation table and the dataset (selectionNL) with the Sort column. Then I merged columns for the Orientation.

This completes the final model.

***** Related Links *****
Geospatial Analysis – New Course on Enterprise DNA
Data Visualizations Power BI – Dynamic Maps In Tooltips
Power BI Shape Map Visualization For Spatial Analysis
Conclusion
In this report, I have chosen to show the direction seen by the customer. You can reverse this or show both in your report, depending on your preferences. All it takes is to exchange the from and to latitude and longitude in the calculation.
Hopefully, this tutorial contributed to a better understanding of the distance and bearing calculations in general.
Check out the links below for more examples and related content.
Cheers!
Paul


")