One of the most common questions you’ll encounter as a data analyst is what is the best way to explore a given data set. This is an important consideration primarily if you want to put all the data together in a report that’s going to be easy to interpret by yourself or your team. In this tutorial, I’m going to demonstrate how you can efficiently explore datasets in Pandas using ProfileReport(). You can watch the full video of this tutorial at the bottom of this blog.
When you’re given a data set, what do you do? How do you explore the data set? Primarily, if you want to put it all together in an easy-to-read report for yourself, for coworkers, etc., you have a lot of things to consider.
First, you think about what sorts of variables are they because that’s going to influence how you analyze them and how you treat them. Data means what is given. So, what is missing is going to be what data we don’t have. Another thing is to visualize those relationships. What do they look like? We want to use that visualization power early and often.
These are a lot of interlocking complex questions. The good thing is that there is this profiling report function available that will give us those answers. So, let’s look at all of that in Python.
Explore Datasets In Pandas Using The ProfileReport() Function
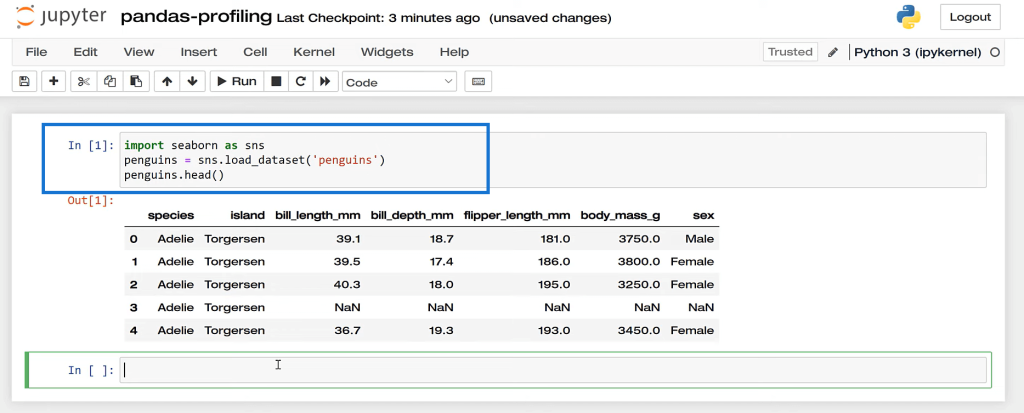
First, we’re going to load the dataset.
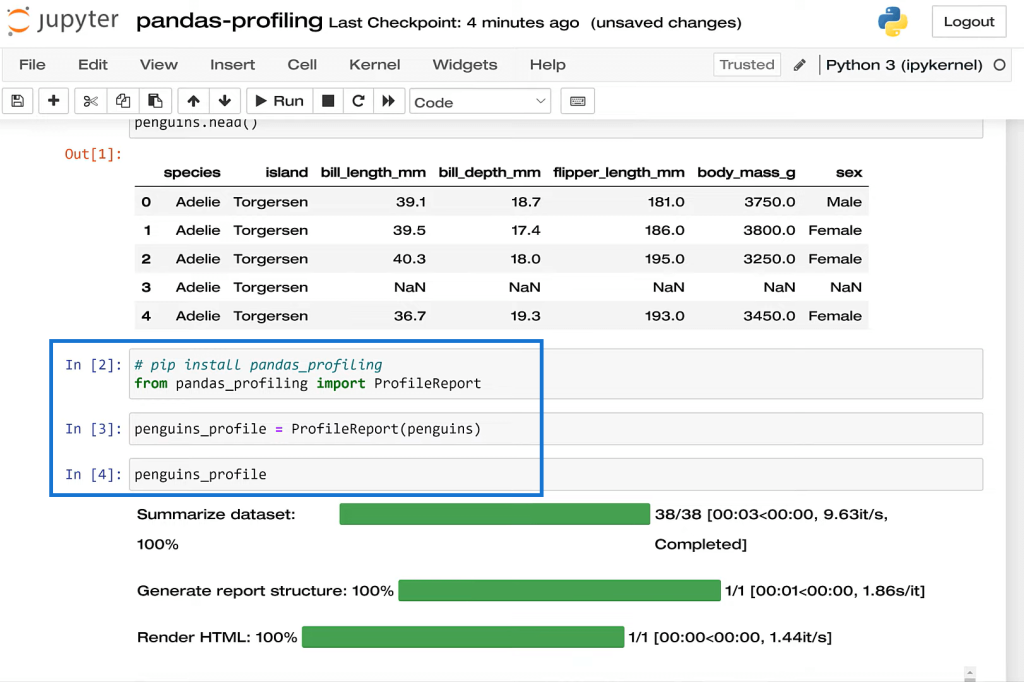
Then, from pandas_profiling, we’re going to import this thing called profile report. Now, if you get an error here, you probably need to install it. I’m using Anaconda. I suggest you use that as well. Let’s run this, and then print it.
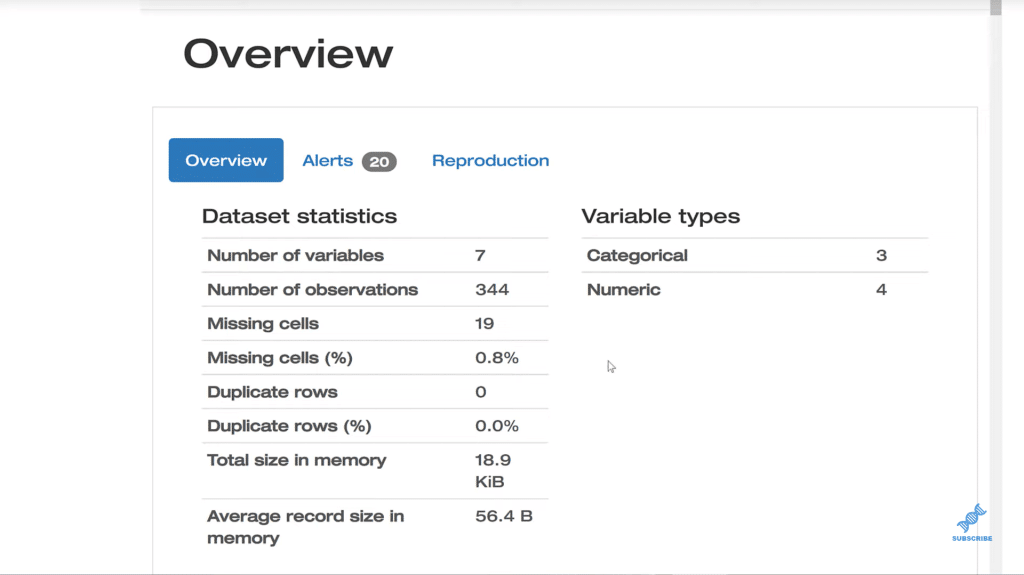
So here it is. We have an Overview. This gives us a breakdown of the variable types. We’ve got the dataset statistics. We see the number of row columns, so on and so forth. The nice thing with this report is that it’s like a one-stop shop and it also looks really nice. It has a very appealing presentation.
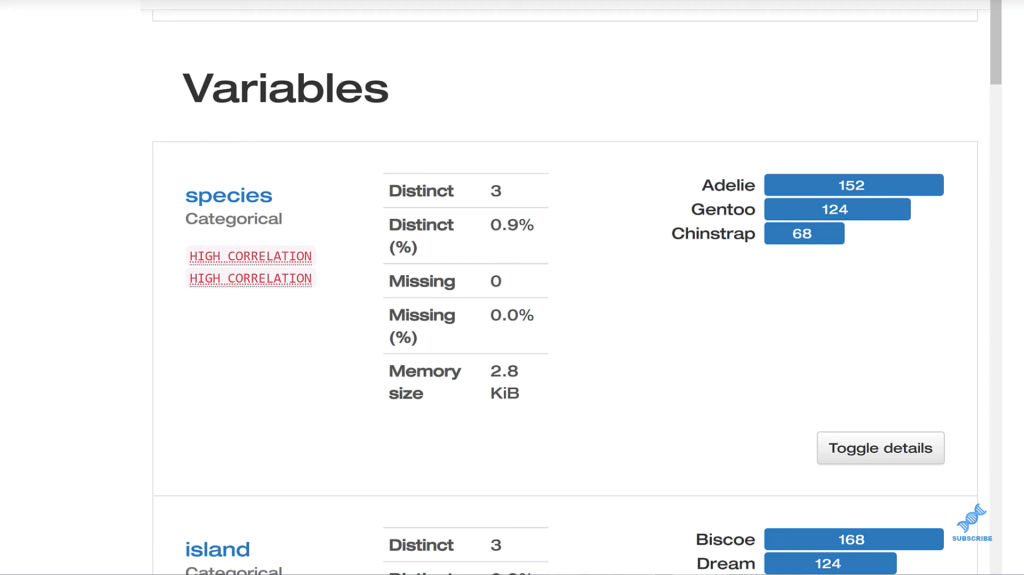
We scroll down here and we have the Variables. We get a visualization, and we can toggle more details about the variable. We’ve got flags that are pointing out things that may be a little unusual. We’ve got these alerts as well, and many other features that will provide us will more information. And, this is for every single variable.
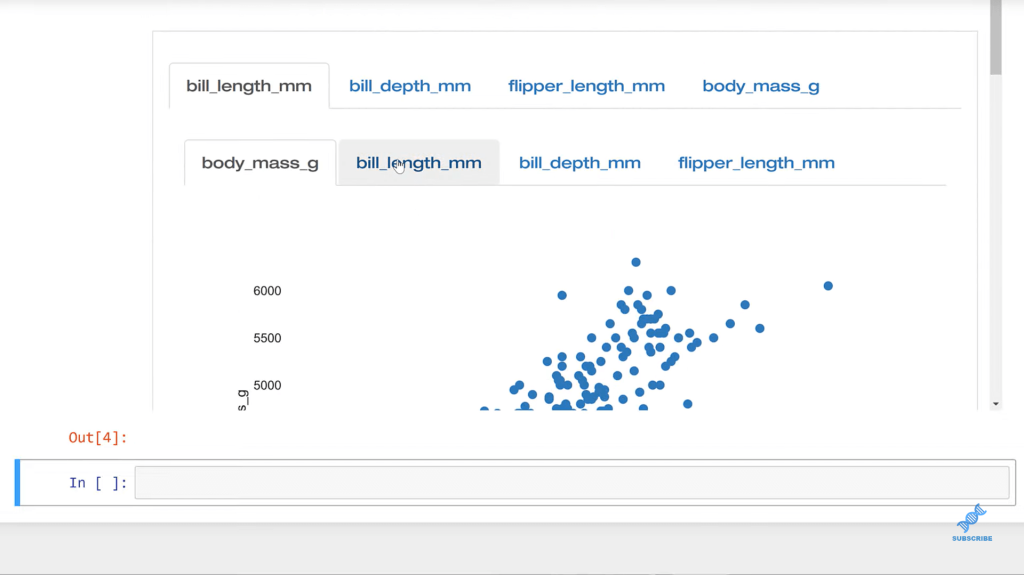
As we continue to scroll down, we’ll find Interactions, where it’s created scatter plots to visualize the data.
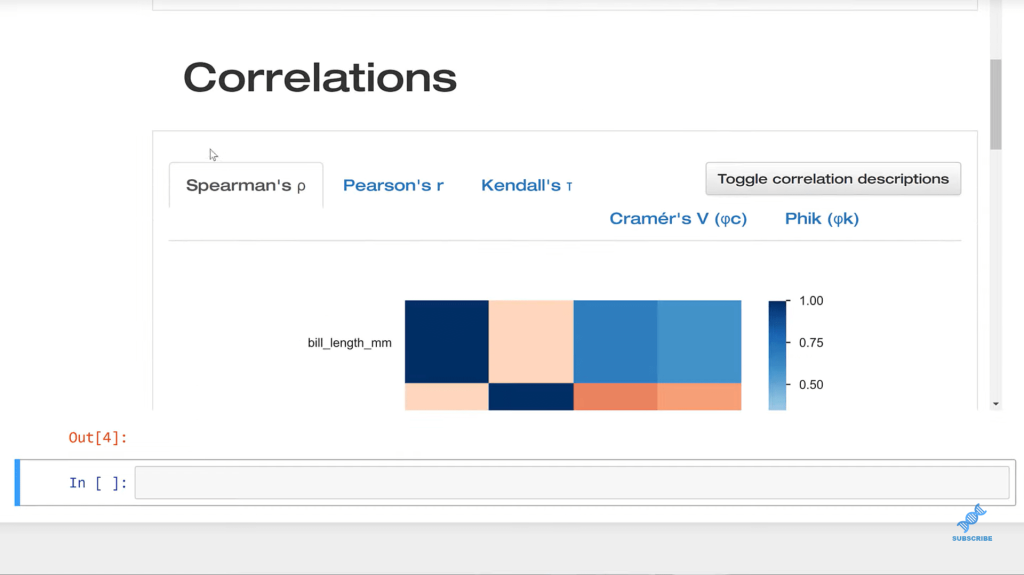
And then, we’ve got Correlations, which summarized the relationship.
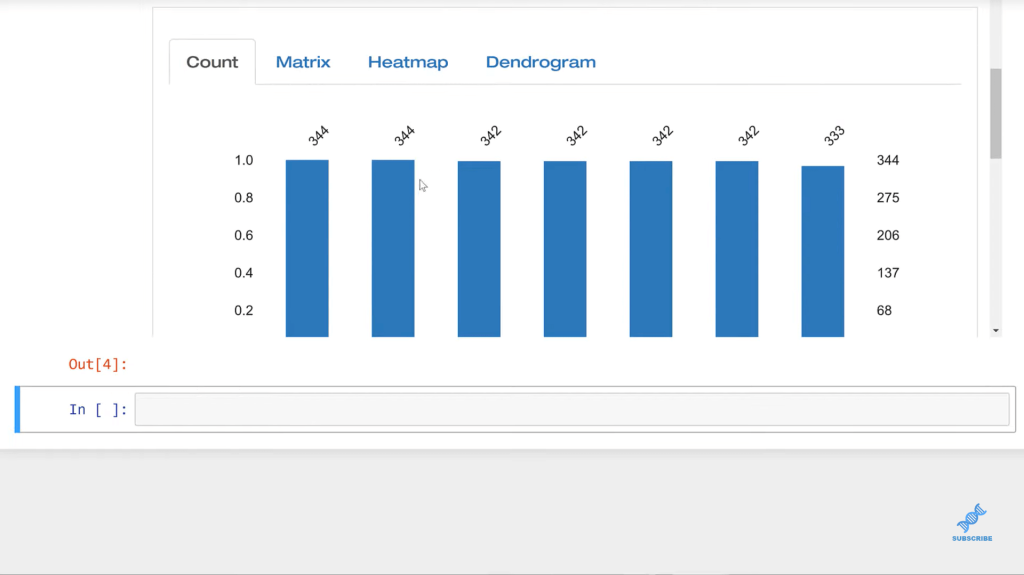
Next is Missing Values, which are very important. As you can see, we do have some missing values here and we want to know why. These visualizations here are meant to help us do that. We can click through each visual and analyze the data.
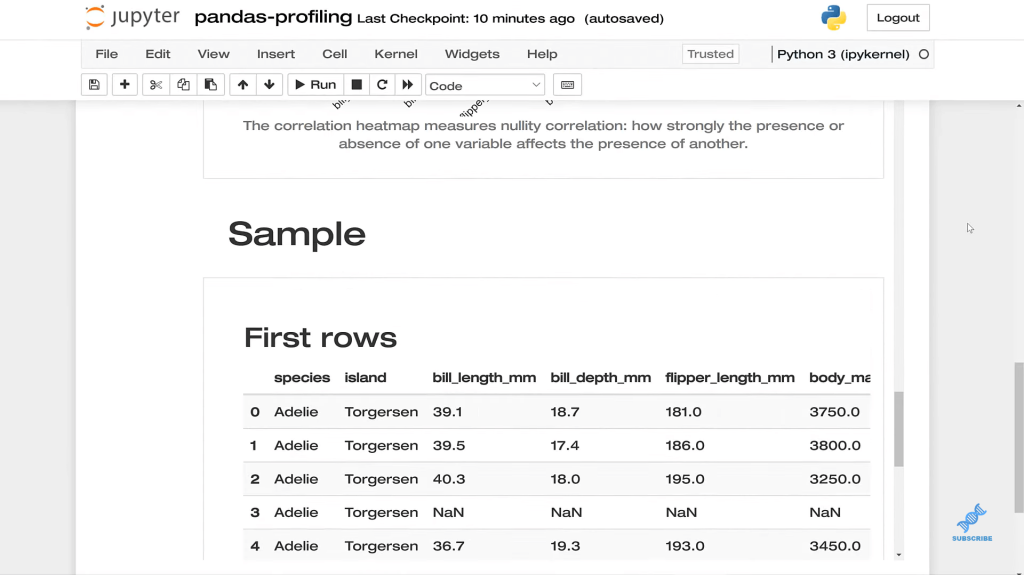
Lastly, we have the Sample. We could get this in many ways, but all this is doing is just printing out the first several rows, which is good to know.
***** Related Links *****
MultiIndex In Pandas For Multi-level Or Hierarchical Data
How To Load Sample Datasets In Python
Python In Power BI: How To Install And Set Up
Conclusion
That’s how you explore datasets in Pandas using the ProfileReport() function. There are a lot of ways to slice and dice the data. Think of all the combinations of permutations of the data. This isn’t going to be able to do everything for you, but it’s a really good start.
When we explore data, it’s really an iterative process. There’s no one-and-done magic pill as much as we might want one. However, the ProfilerReport() is really a great tool. We get a lot of information and just one line of code. This is a free tool, so I hope you can use it in your own work. Let us know how you do that.
All the best!
George

[youtube https://www.youtube.com/watch?v=SVQITfK967E&w=784&h=441]


