
In this blog, I’ll compare the existing customer allocation in depots or hubs to a newly-calculated allocation based on a selected distance. This kind of analysis allows businesses to deeply understand customer profitability.
There are two similar datasets here which are the Customer data selection and Customer data current. I used these datasets to display both the current customer allocation and the newly-calculated allocation combined in one report.

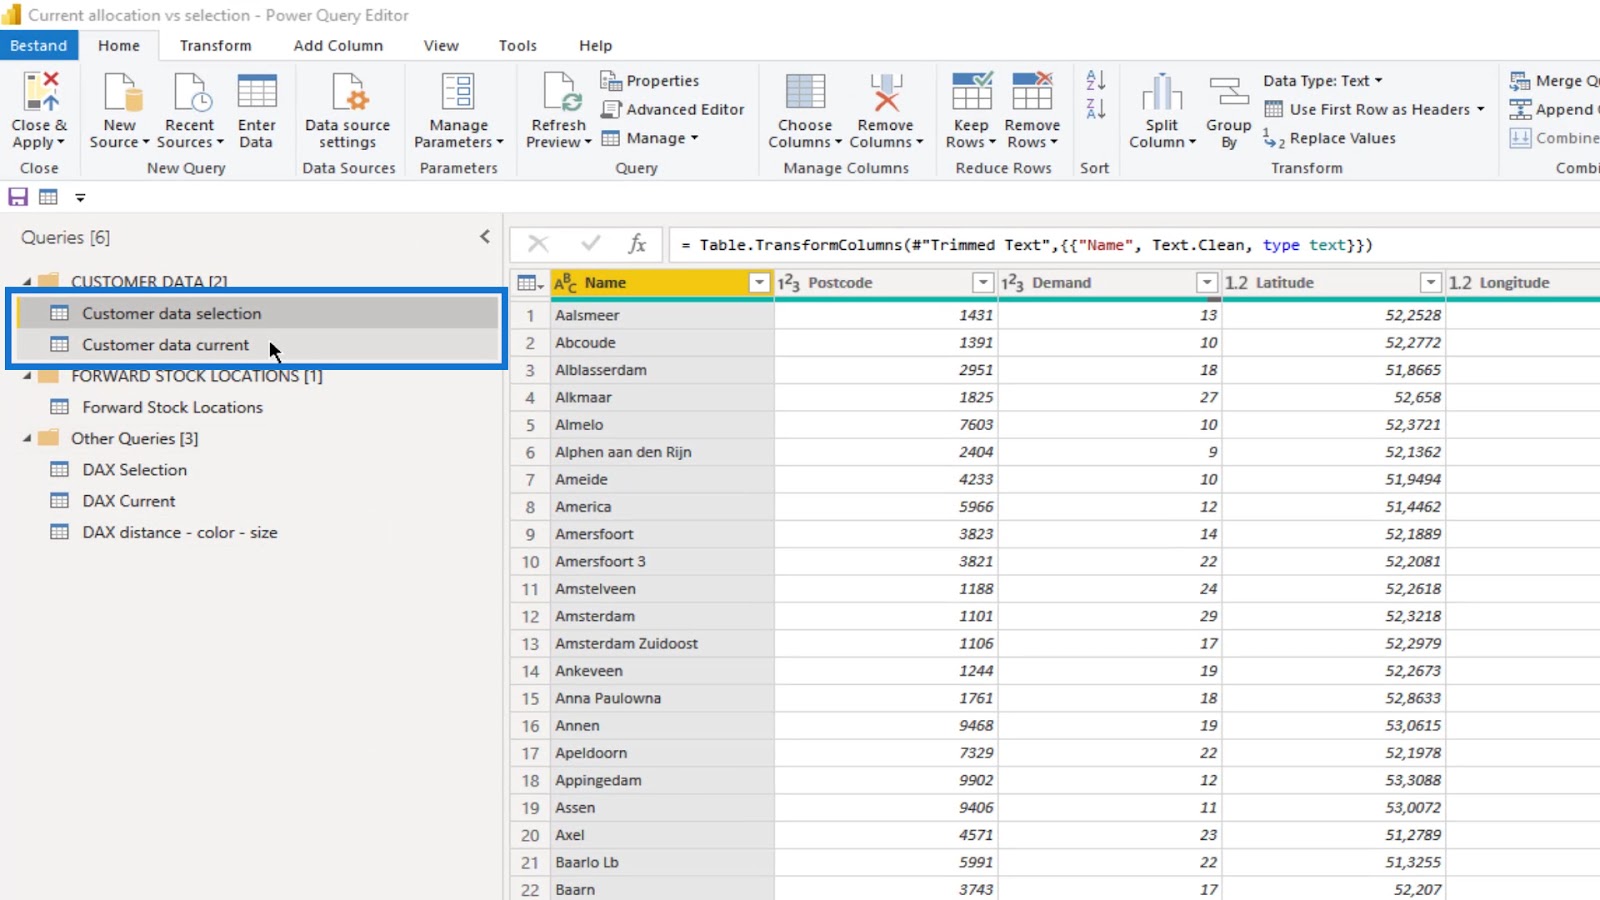
In addition to that, there’s a Forward Stock Locations table which could be depots or factories. This table was appended to both customer tables (Customer data section and Customer data current) to allow simultaneous display of data.

The Scenario And Comparison Report Setup
Imagine that you have a delivery infrastructure from forwarding stock locations, parcel lockers, or hubs to customers.
Historically, an allocation has developed across the existing forward stock locations. New business has been acquired and it’s time to consider if the current setup is still justified.
Let’s have a walkthrough of the report that I’ve generated for this scenario.
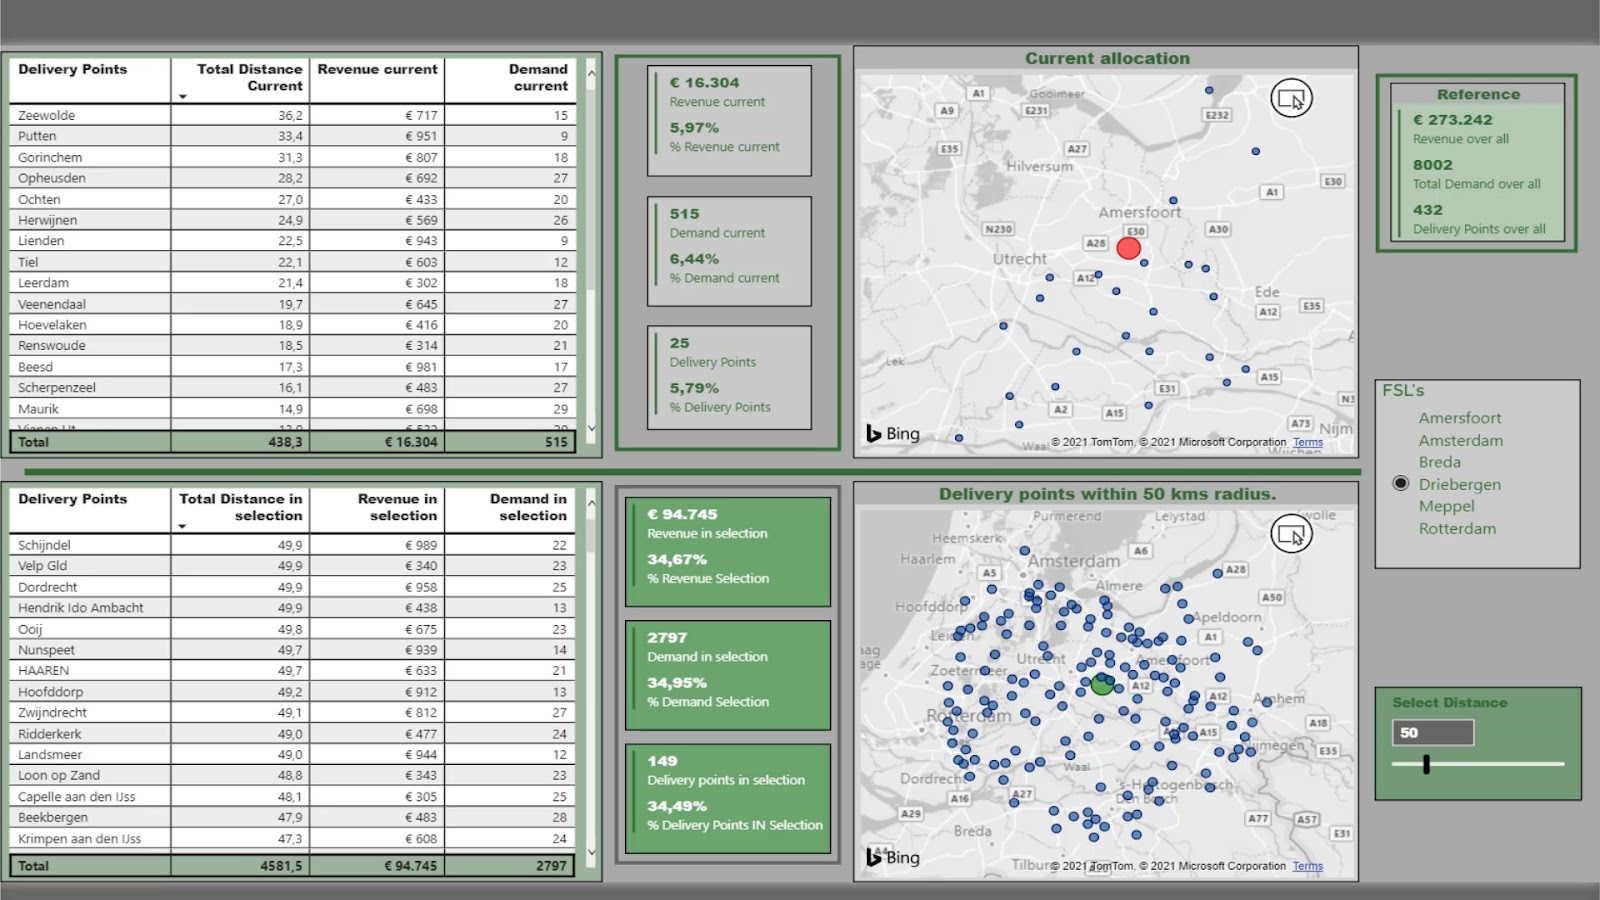
First, this map shows the current customer allocation with the depot.

Then, this table shows the distance, revenue, and demands.

These cards represent the totals and the percentage distribution for the selected forward stock location.


At the upper right corner is a multi-role card that is not filtered. Therefore, it’s showing the overall revenue and demands in the dataset for reference.

There’s also a slicer for selecting a forward stock location. Certainly, this could be a depot, a factory, or whatever you may wish to analyze.

As a result, the FSL’s slicer controls both maps here.

The lower map displays the results triggered by the Select Distance slicer.

These middle cards are displaying the revenue and demands based on the selected distance. This is useful in analyzing the difference between the current customer allocation and the newly-calculated allocation based on a selection.

DAX Measures For Customer Allocation Comparison
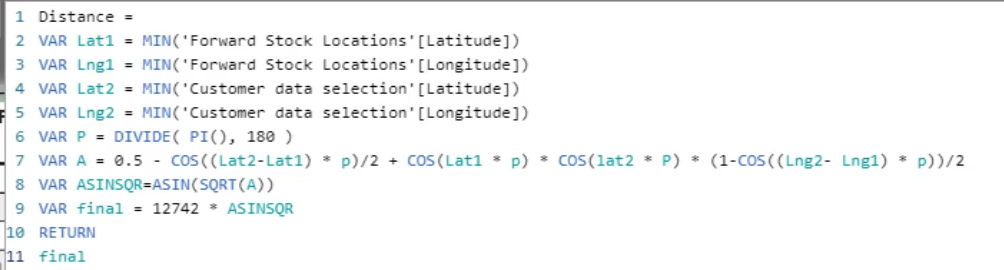
This is the distance calculation that I used for this scenario. Note that the variables in the formula depending on the way your data has been set up. You’ll need to tweak these in line with your own data to get the proper result.
The measures for size and color to display varying colors are different for both the current allocation and the selection-based allocation.
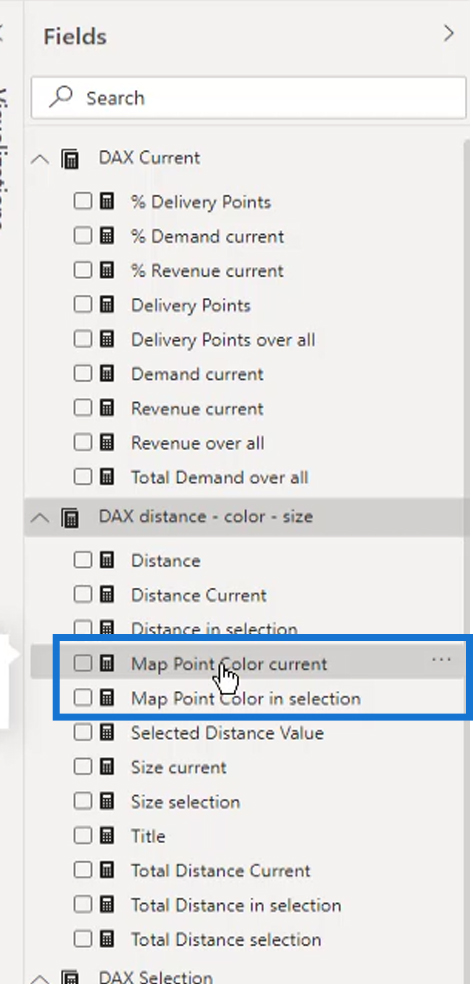
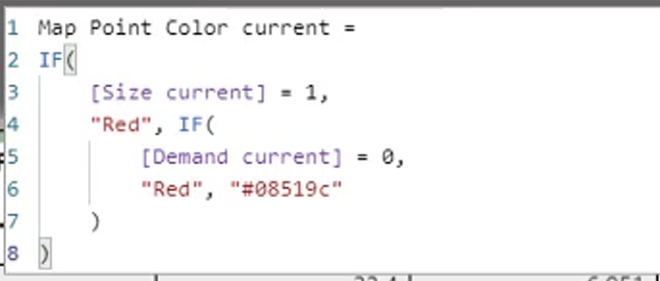
This is the Map Point Color Current Measure for the current customer allocation.
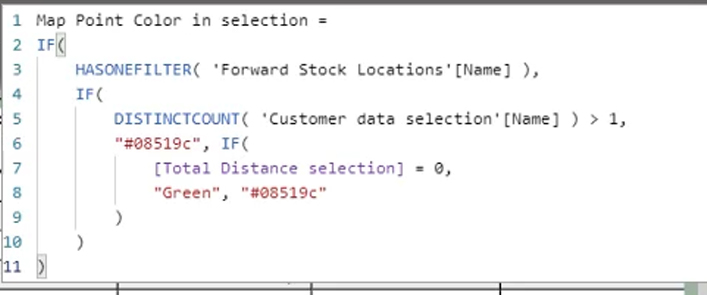
On the other hand, this is the Map Point Color in selection measure for the selection-based customer allocation.
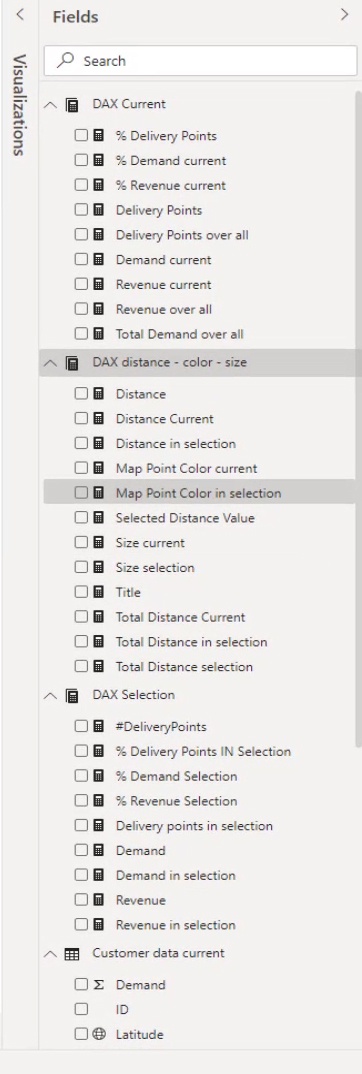
As you can see, my measures are in three separate tables. I usually hide these in folders once I completed my model. But when building, it’s much more practical to keep them at hand.
Conclusion
Indeed, this sample report provides a powerful analysis as you can make selections to redistribute all customers across the existing locations. By learning the Center of Gravity calculation and the Huff Gravity analysis, you can easily handle various location intelligence projects.
I hope that this blog contributes to your learning curve and raises awareness on how important it is to use the geographic components in your data.
Remember that this is not about building the best-looking report but rather an example. For instance, adding smart narratives or charts may enhance the model for high-level presentation. However, this is just the analysis stage.
Check out the links below for more examples and related content.
Thank you.

Paul
***** Related Links *****
Power BI Customer Segmentation: Showcasing Group Movement Through Time
Customer Segmentation Techniques Using The Data Model – Power BI & DAX
New Customer Analysis Using Advanced DAX
***** Related Course Modules *****
Geospatial Analysis in Power BI
Unique Analytical Scenarios
Business Analytics Series
***** Related Support Forum Posts *****
New Customer Analysis Question
Customer Cohort Analysis
Customer ABC analysis
For more customer analysis support queries to review see here….


")