In this blog post, I’ll discuss dashboards and apps in Power BI. These features are found in the Power BI online service, specifically, in the workspace area.
Dashboards are used to consolidate information while apps are used to summarize dashboards.

I’ll also explain what else you can do with dashboards and apps in Power BI. You may watch the full video of this tutorial at the bottom of this blog.
Creating Dashboards In Power BI App Online Service
For example, you want to collect information from different pages within a report or different reports in your workspace. You can use a dashboard to compile this data.
To create a dashboard you need to pin the necessary information.
Within each visual, there is a pin icon.
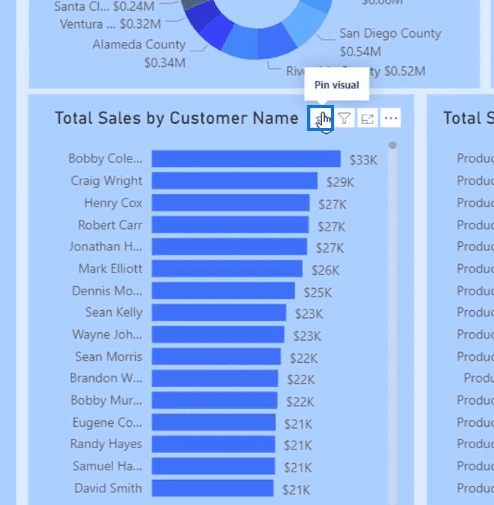
This enables you to pin that particular visualization.
I’ll pin this card visualization.
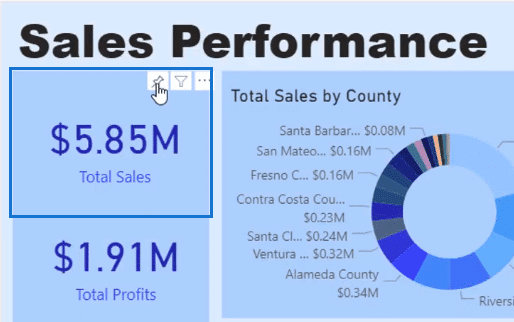
I can pin this visualization to an existing dashboard or a new dashboard.
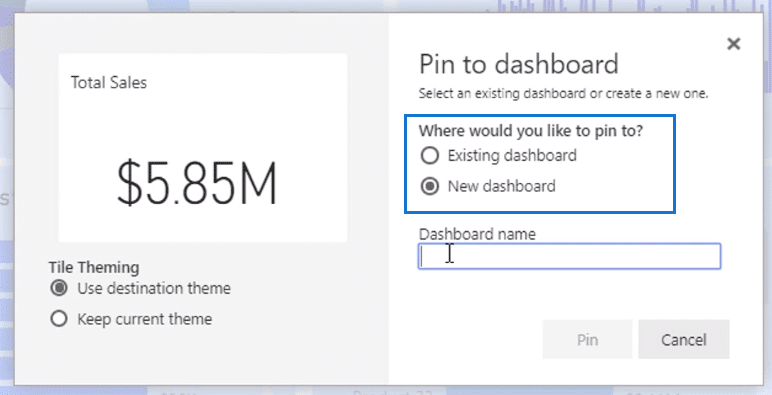
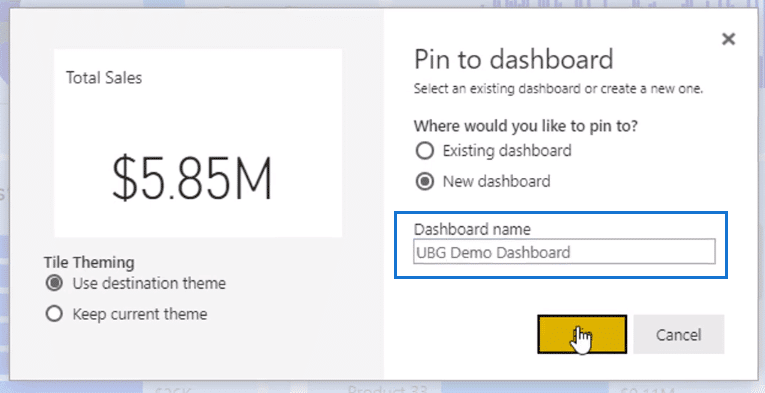
I’ll create a new dashboard called UBG Demo Dashboard and pin the visualization.
I’ll also pin this chart.
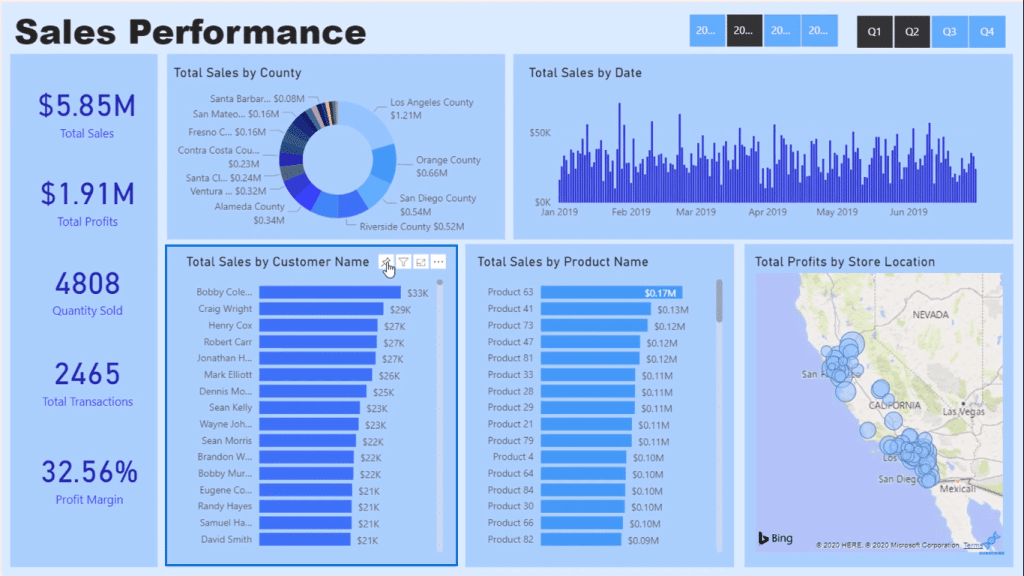
Under the tile image, there’s an option to select a theme.
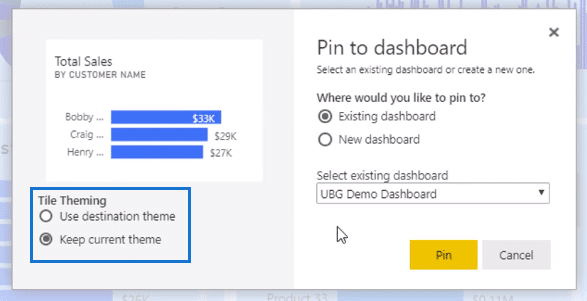
I’ll select the current theme to keep its original colors.
Next, I’ll also pin the map and another card.
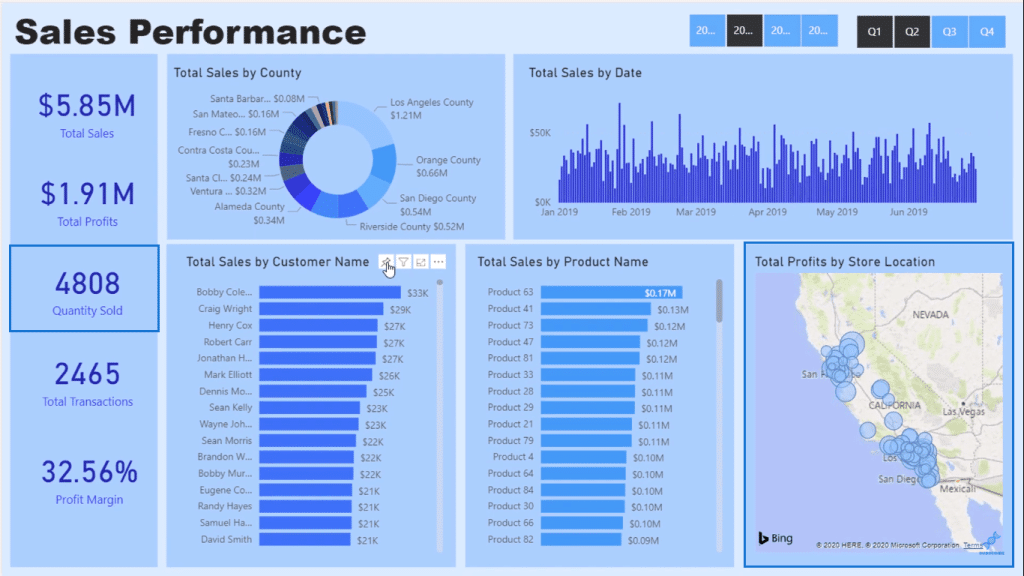
After that, I can go to the dashboard.
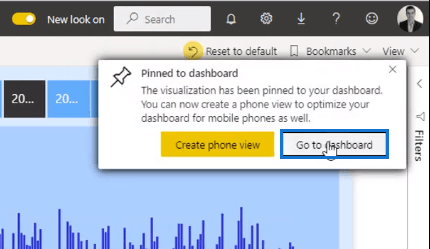
On the dashboard page, the pinned visualizations are shown as tiles.
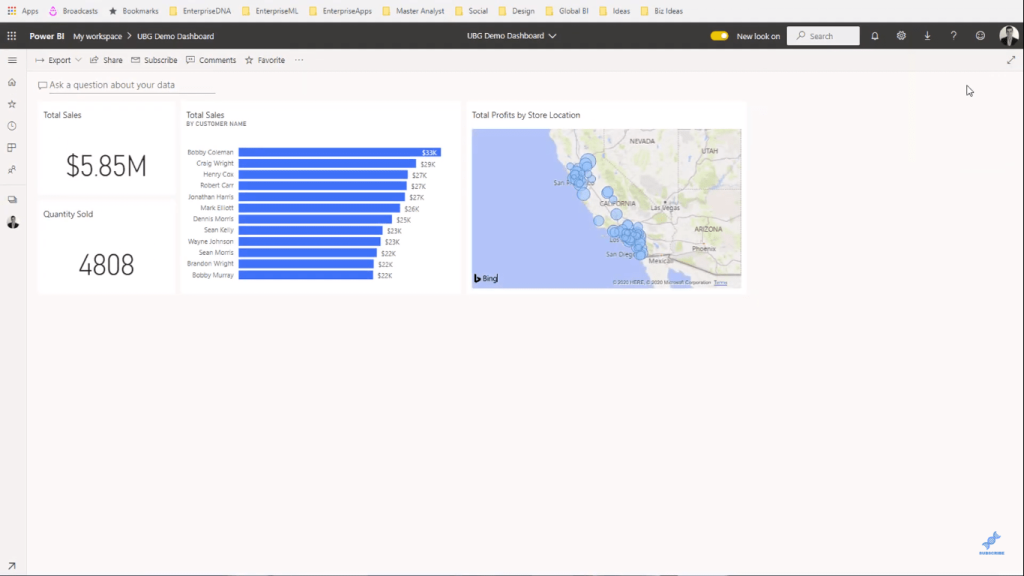
And we can move them around the area to organize the dashboard as we like.
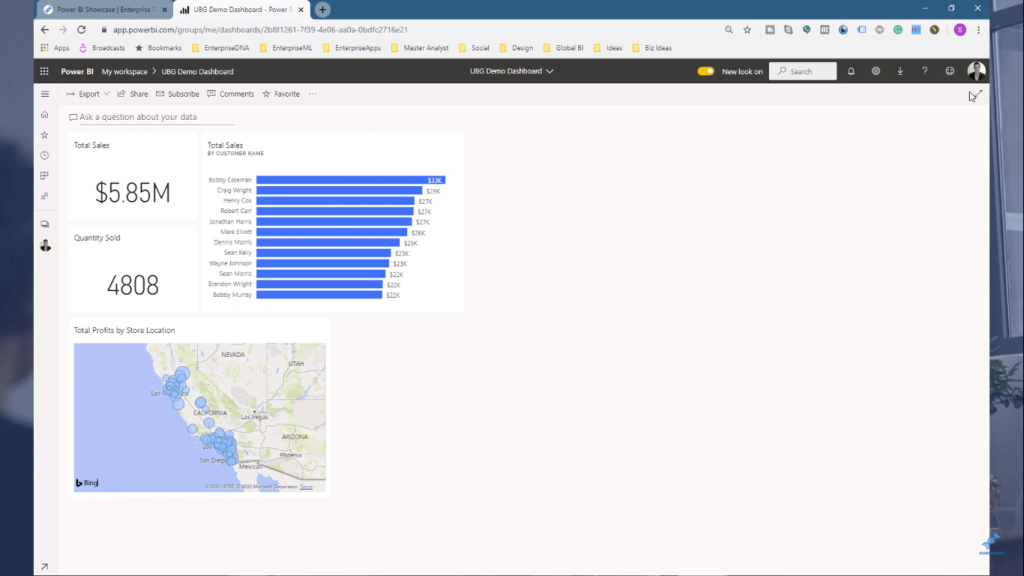
You can also click on the tiles and the will take you to the corresponding report pages. This will make it much easier to jump between a dashboard and a report.
I can also find my way to the dashboard by using this drop-down menu.
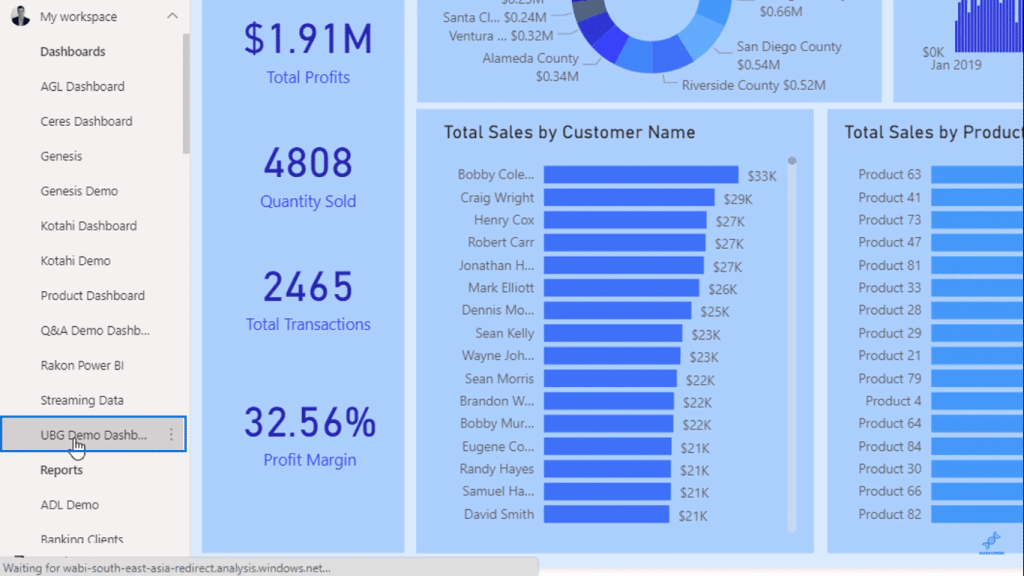
Dashboards are like reports, wherein they both present information.
The difference between them is that dashboards enable you to consolidate key insights from a range of different pages or reports.
In other words, it’s done on a larger scale.
Dashboards are a powerful when it comes to consolidating information.
When presenting your reports, you can use dashboards to compile your data. When you want to talk about a certain topic, you can click on a tile and be taken to that specific report.

Other Features In The Dashboard
There are also new features that you can use.
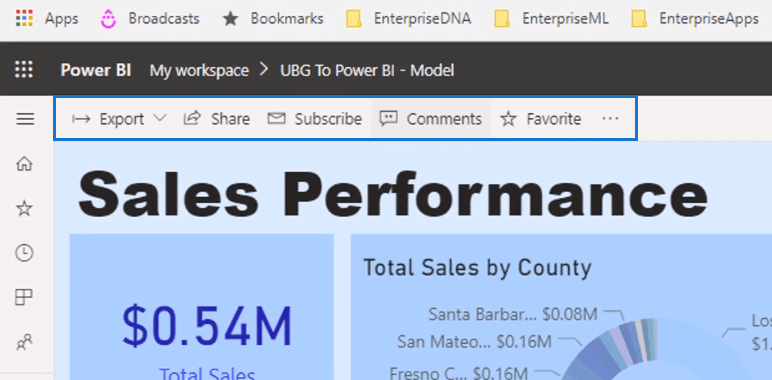
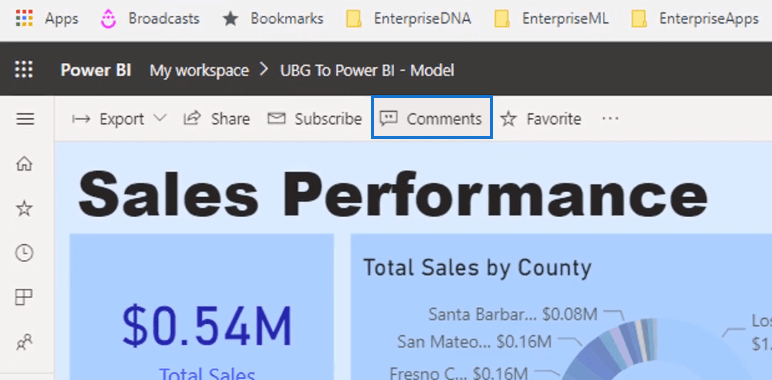
For example, you can add comments and collaborate with your team in each report.
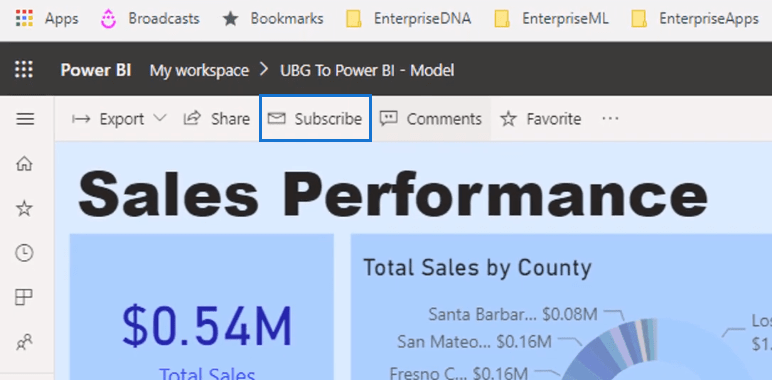
Using the Subscribe feature, you can also create email subscriptions which emails out a link of your reports.
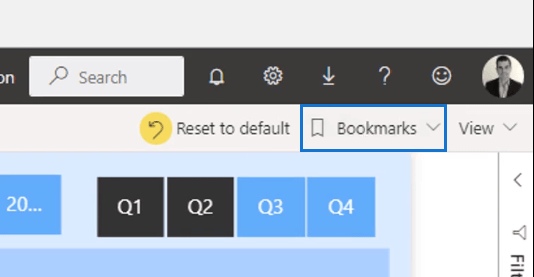
You can also create bookmarks here.
All of these can be automated using a software called Gateway which automatically updates your reports.
Creating Apps In Power BI Online Service
Next, I’ll talk about apps.
You can create an app for a workspace which can summarize all the key dashboards and reports that you have.
In other words, apps are a way of summarizing key insights from different workspaces.
In the reports page, there is an option to include each report in the app.
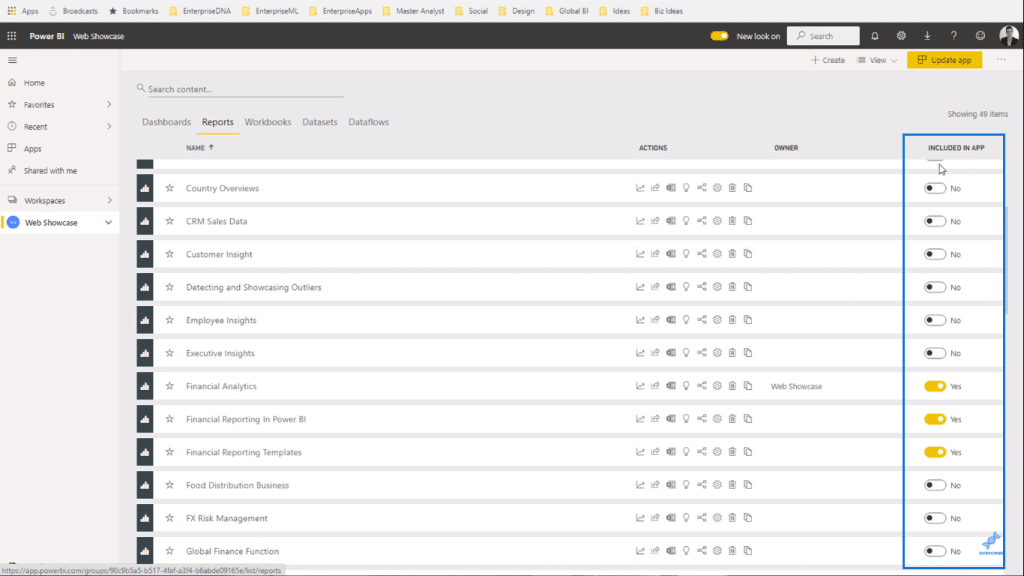
In this case, I’ve included a few reports in my app. I’ve also included a dashboard as well.
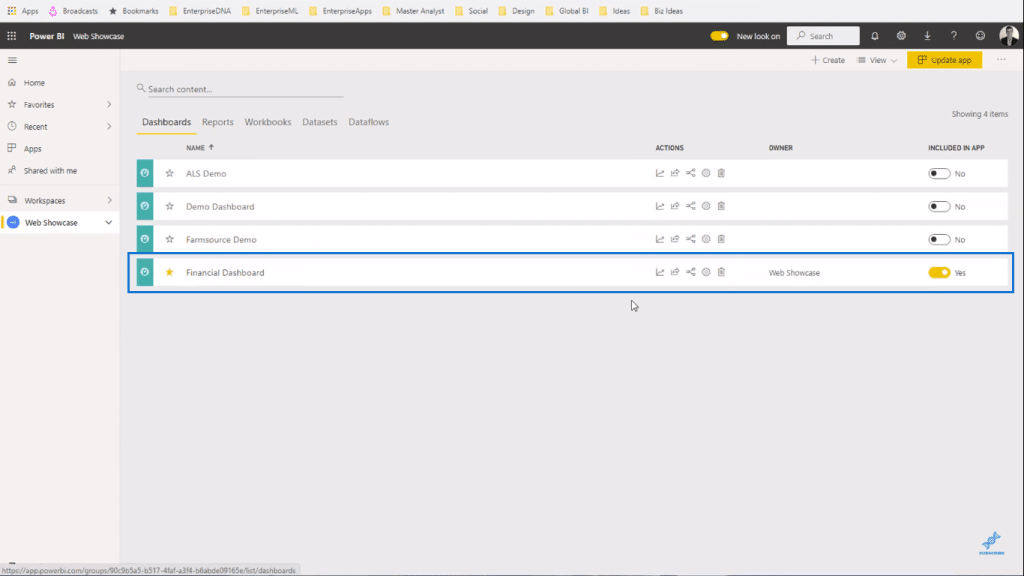
Since I’ve already created an app, I have the option of changing it using Update app.
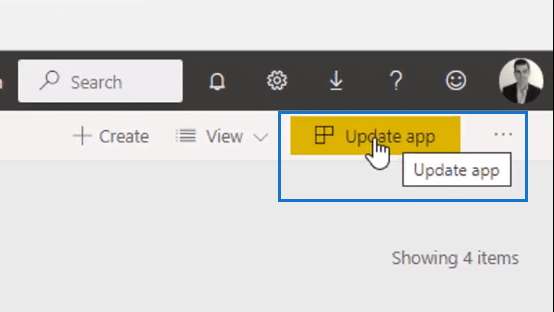
If I haven’t created an app yet, this button will show as Create app.
And then it will take you to this apps page.
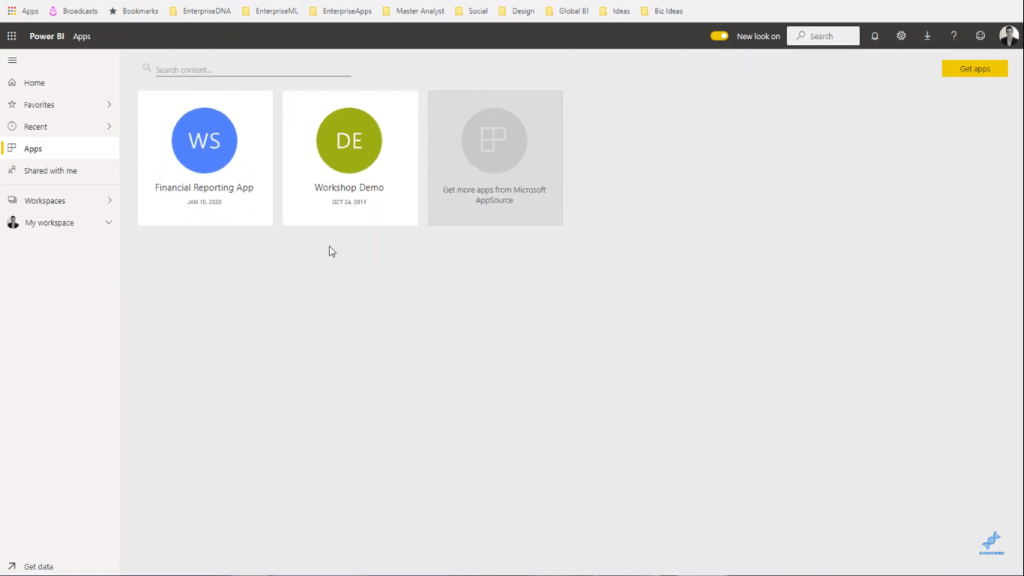
It will ask you to create a name for your app and then you can customize it according to its purpose.
I’ll open an app that I’ve already made to show you what’s inside.

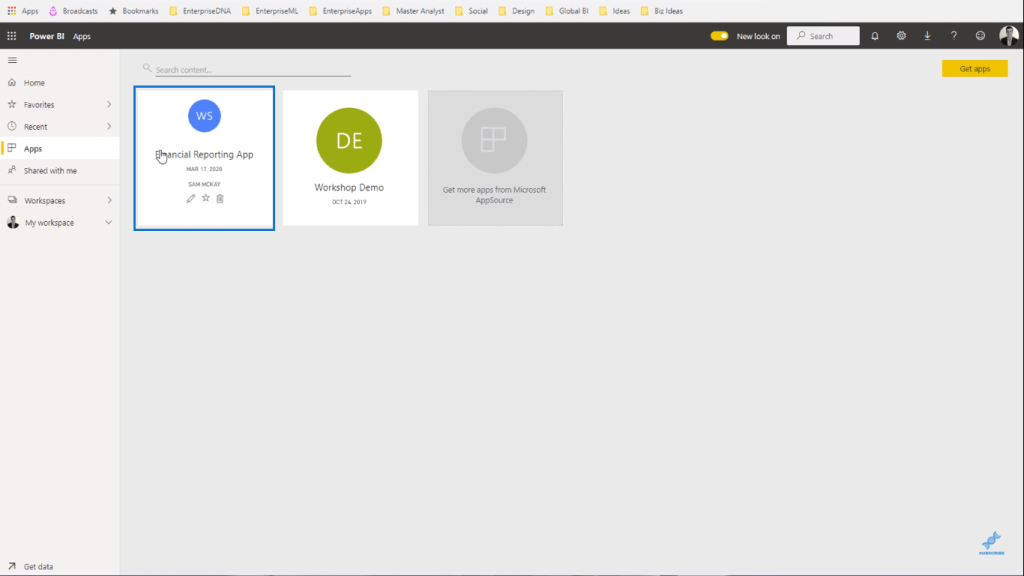
When you click on the app, it will take you to this page.
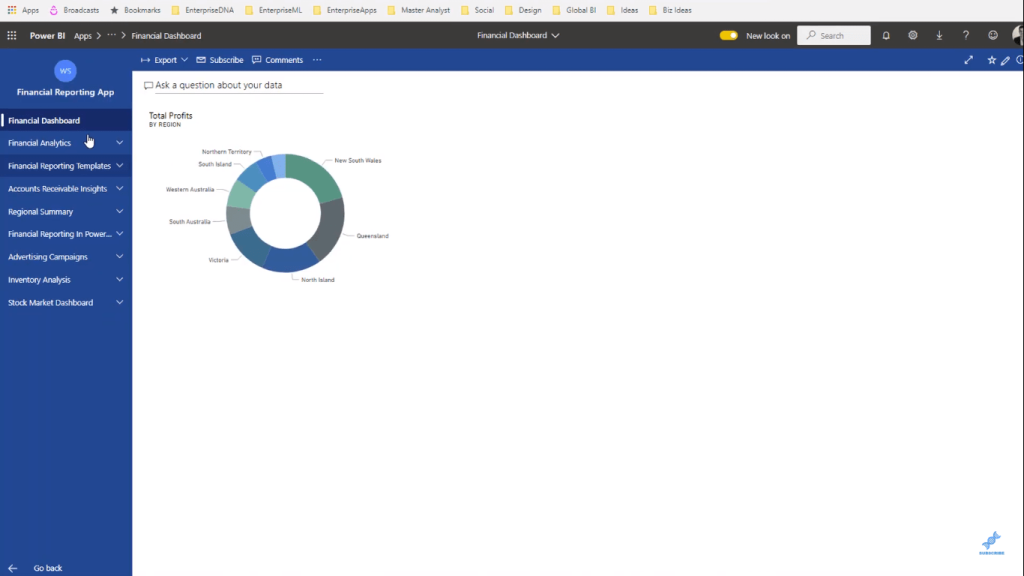
The app shows a summary of all the different reports that you’ve placed there. It’s a new experience compared to dashboards and reports.
There is potential in the functionality of apps in Power BI.
I can click through all the different reports and report pages that I’ve included in the app.
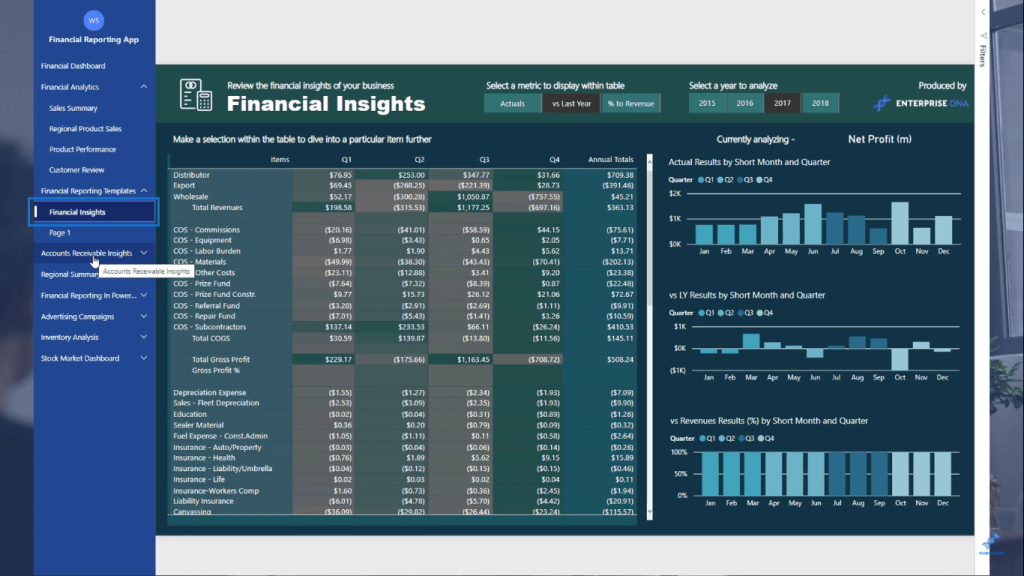
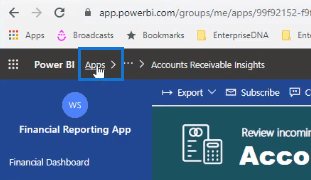
And you can quickly navigate back by selecting Apps and it will lead you back to the apps page.
I’ve also grown to use apps as a distribution method as well. It’s helpful when you have a lot of data to compile.
***** Related Links *****
Create Compelling Power BI Dashboards With High Quality Insights
Update Your Power BI Dashboard – Power BI Online Service
Best Tips in Using The Apps Inside Power BI Online Service
Conclusion
I’ve explained how dashboards and apps can be used in Power BI. It’s up to you to customize it according to the needs of your organization. There are many features that can help you present your reports effectively.
Dashboards and apps are a great tool to collect a variety of information from different places and consolidate them in one place.
I hope you’ve gained some valuable insights from this blog! Good luck!
Sam.
[youtube https://www.youtube.com/watch?v=fBpbTqTPfig&w=784&h=441]


