After getting the data into the Report Builder, the next step is transforming these into a report. In this tutorial, you’ll learn how to create a paginated report. Specifically, you’ll learn how to add texts and images and then export your report into various document formats.
The Properties Pane In Report Builder
In Report Builder, the Properties pane is located on the right side.
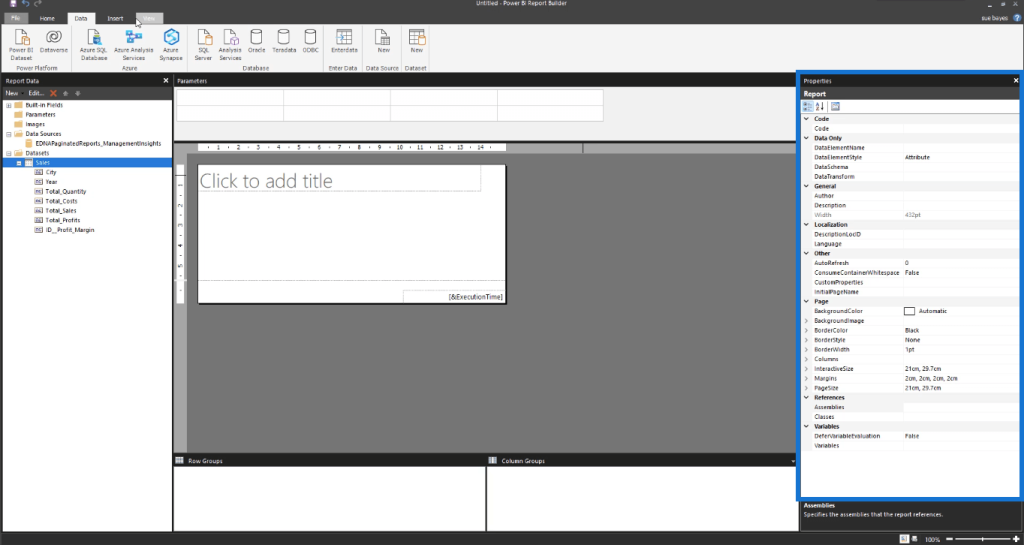
If it’s not there, go to the View tab and click Properties.
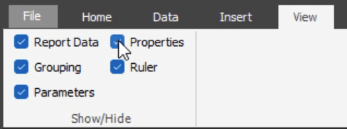
The other checkboxes under the View tab allow you to toggle between showing and hiding different panes in Report Builder.
On the other hand, the Insert tab allows you to insert tables, matrices, lists, and other visuals you’ll need in your report.

In the Properties pane, you can customize different settings in your report. You can change the page sizes and page margins, among many others.
There are three buttons at the top part of the Properties pane. The third button is the Property Pages.
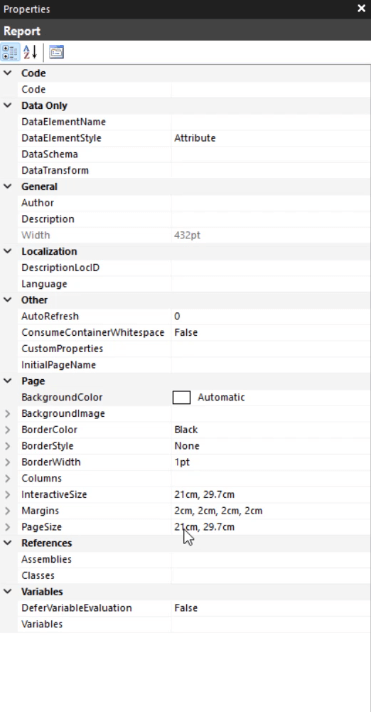
If you click this, a pop-up window appears.
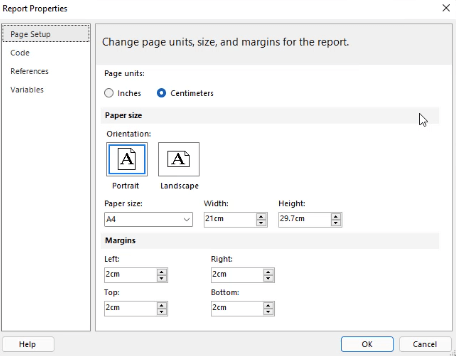
It shows the basic settings you can modify to customize your report page.
If you click on your blank page, the Properties pane will show the Body Properties.
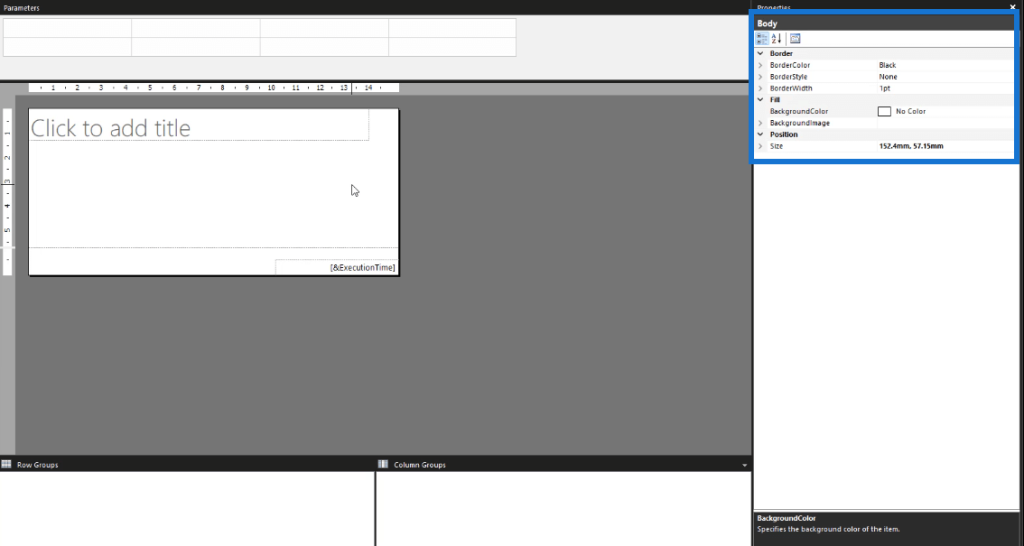
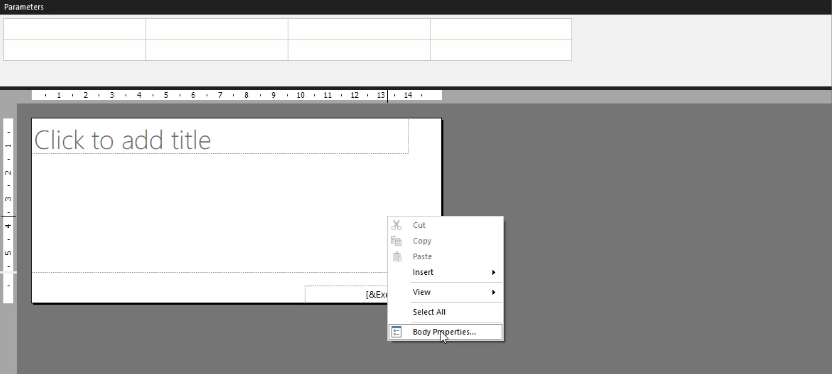
You can also access this by right-clicking on the blank page and selecting Body Properties. A pop-up window appears which allows you to customize various settings of your actual report. There are options to customize the background or add borders.
Creating Headers In A Paginated Report
To add a header to your report, click the Insert tab and then select Add Header.

You’ll then see that the top section of your blank report page has been dedicated to the header.
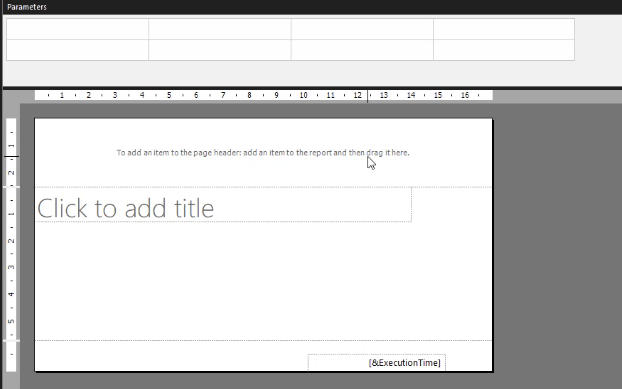
To add a header, drag an item to the top section. For example, you can drag the text box and then write the title you want for your report.
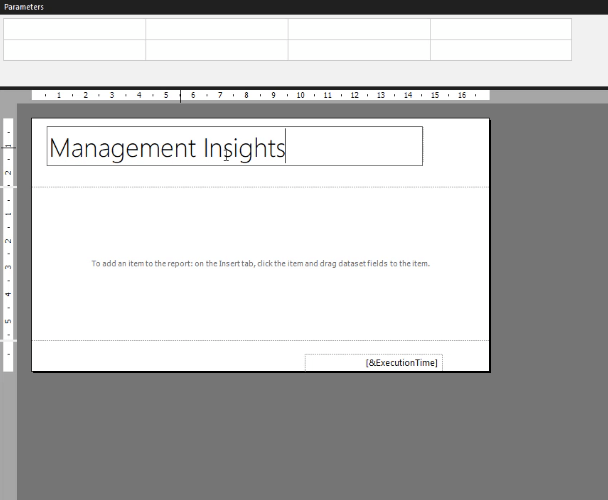
Make sure to choose your headers wisely. A header is repeated on every page. You can’t choose which pages it will appear on. If you want different headers or titles for each page, don’t add a header.
A text box in Report Builder is similar to textboxes in other Microsoft programs. You can move it around or resize it. Using the Properties pane, you can also add background colors and change its font, among many others.
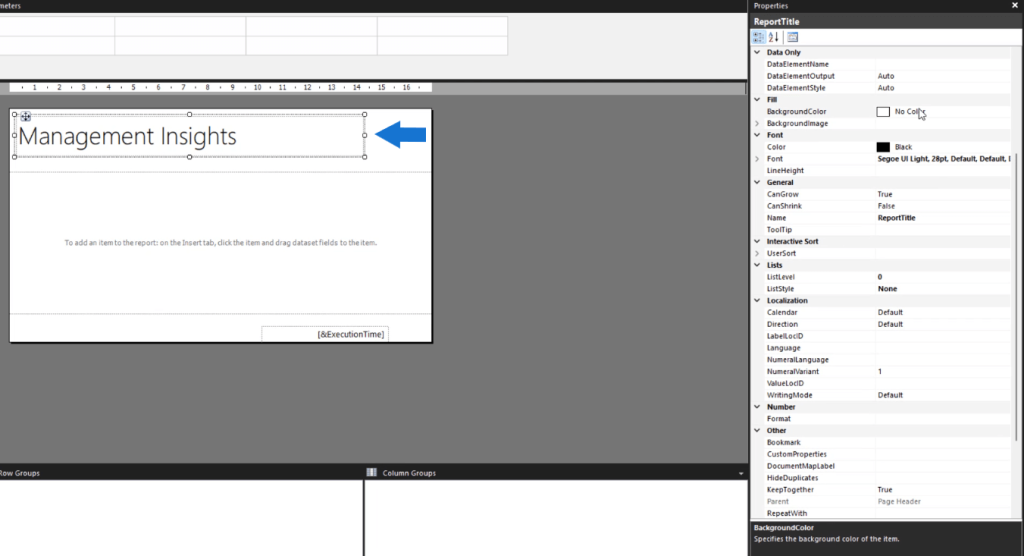
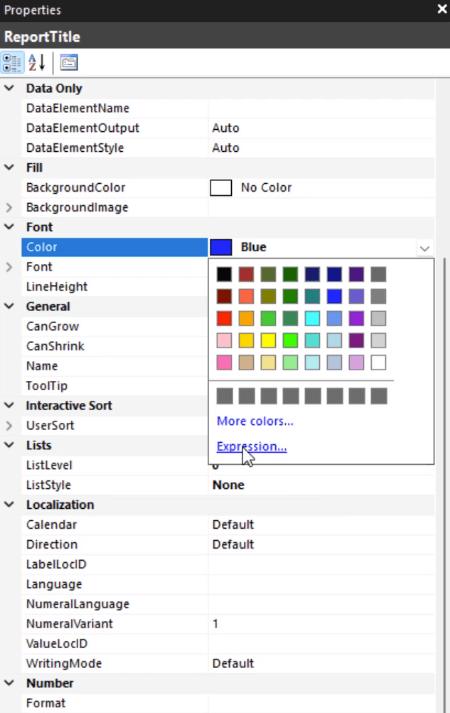
When you click the drop-down arrow of the Color setting, an option for Expression appears.
When you click it, a pop-up window appears.
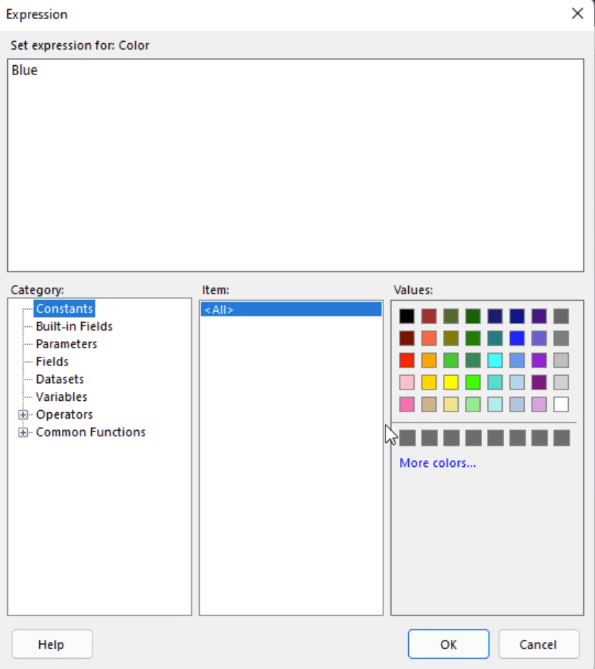
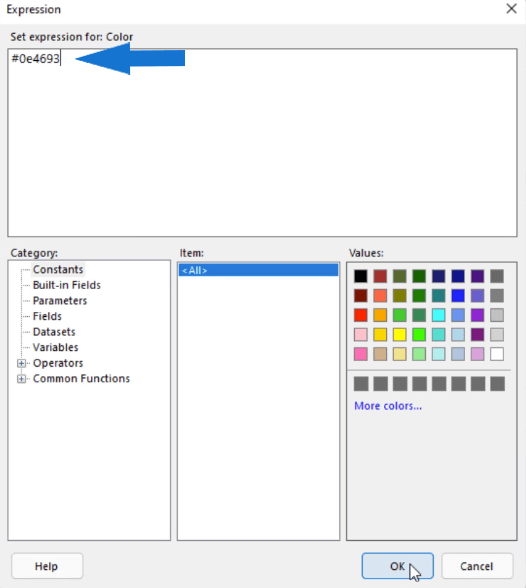
Expression allows you to control the color of any cell or visualization in your paginated report. For example, if you want a specific color that’s not in the default option in Report Builder, you can copy its hex code and paste it into Expressions. Similar to text boxes in Word, you need to highlight the words you want to change the color.
The Position Option In Report Builder
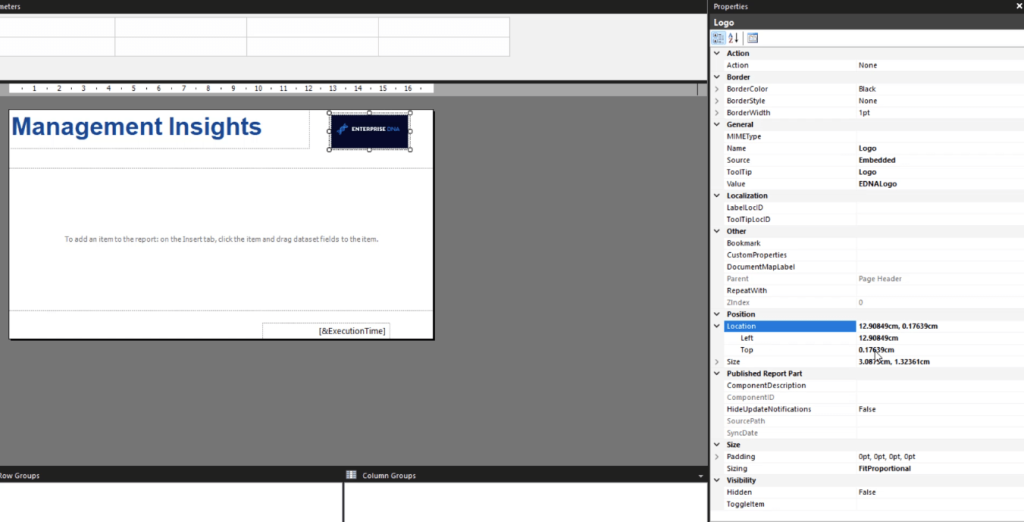
If you want to be specific with the placement of text boxes and other objects in Report Builder, use the Position option in the Properties pane.
This allows you to specify the location and size of the objects in your report using actual numbers instead of relying on visual sight.
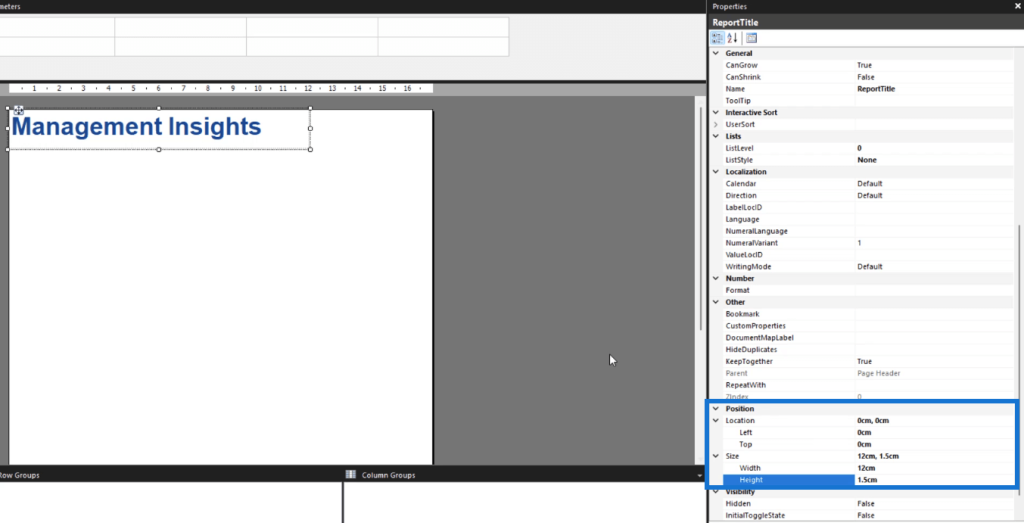
Location refers to the position of the object from the top and left sides of the page. Size refers to the width and height of the object. In this example, it’s modifying the width and height of the text box.
If the size of your object exceeds that of the page, the page will automatically resize to accommodate the size of the object.
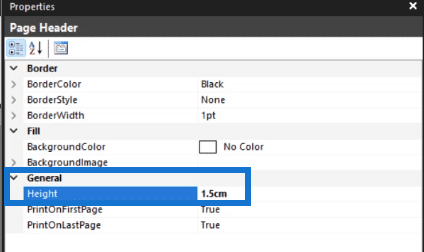
If for instance you accidentally make an object bigger than you wanted and the page lengthens, you can edit the page size using the Body options.
Creating Images In A Paginated Report
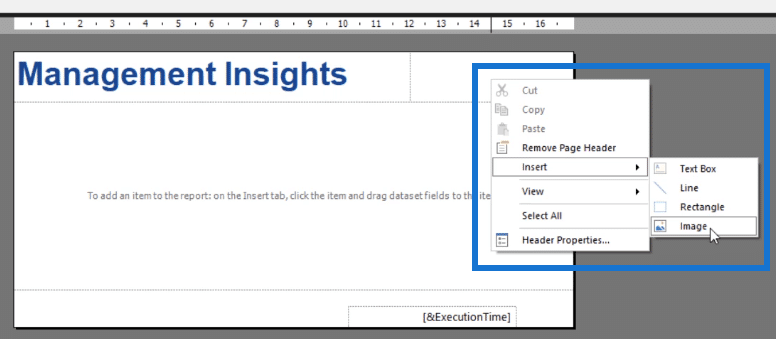
To insert an image in Report Builder, right-click on the area you want it placed, click Insert and then click Image.

The Image Properties box will then appear.
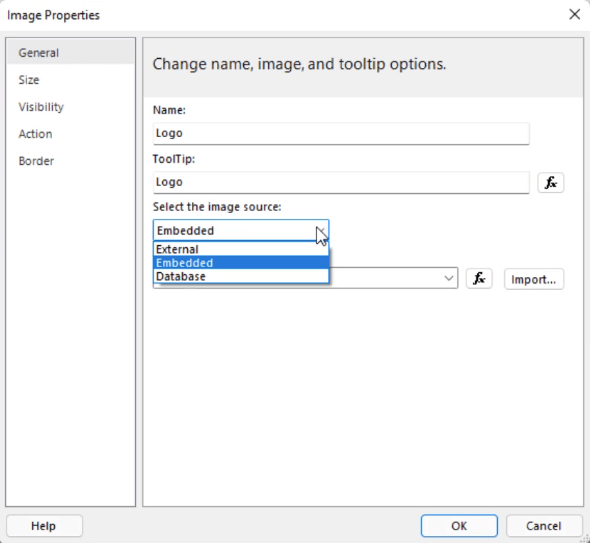
It’s good practice to properly name everything so that it’s easier for you to locate objects in case you want to make changes. The image source has three options: External, Embedded, and Database. In this case, the image is embedded within the report.
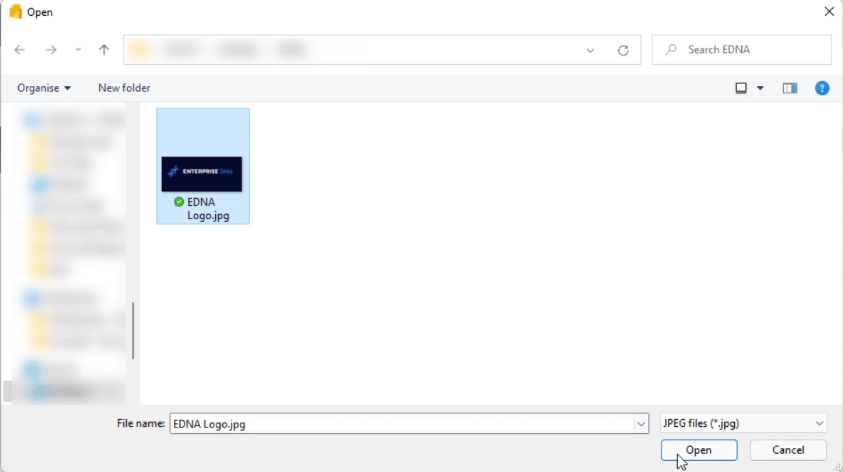
Once you’re done with these steps, click Import. Choose the image you want from your files. Once done, click Open.
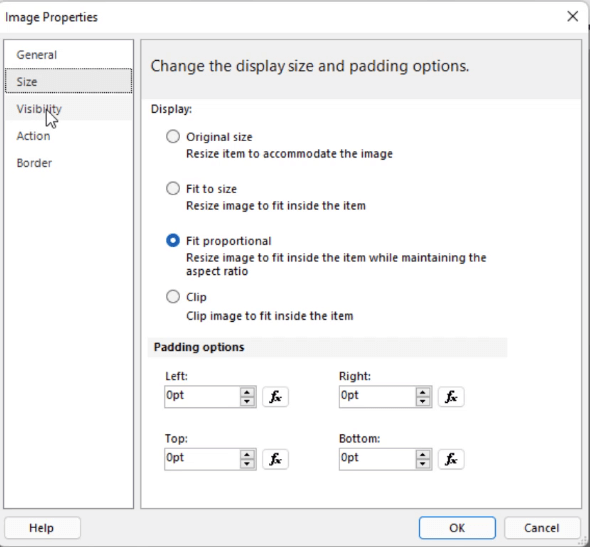
Before clicking OK, make sure to review the other options.
Under the Size tab, you can resize the image according to a specific set of options. There are also Padding options that you can customize.
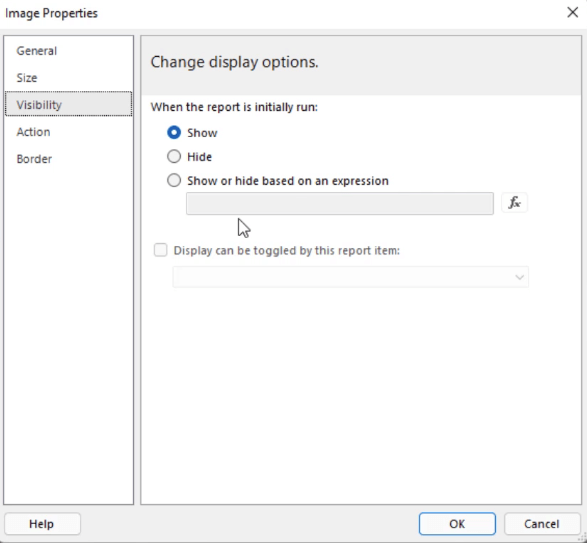
The Visibility tab allows you to choose how the image will be displayed once the report is initially run. The third option allows you to create conditional formatting on the image. You can also decide if you want the image to be toggled on or off by a different report item.
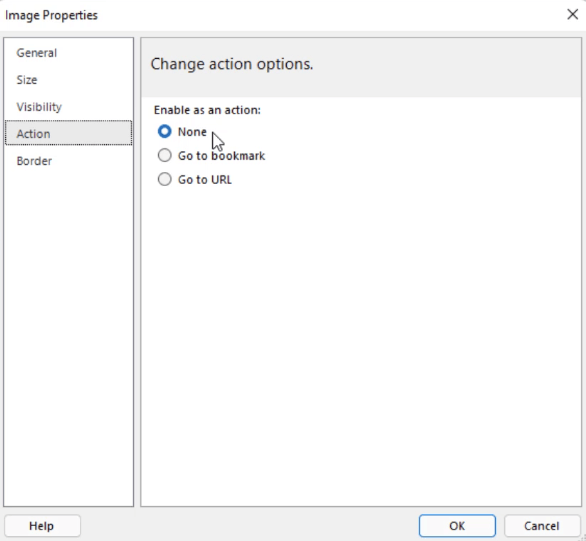
The Action tab allows you to enable an image as an action. You can use it to create a bookmark or use it to go to a specific URL.
The Border tab allows you to set borders around your image.
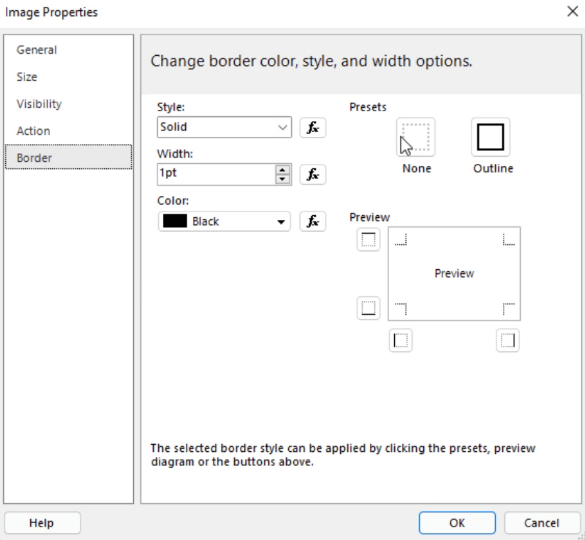
Once you’re done customizing all the image properties, you can now press OK to return to your report page. Again, you can resize and reposition your image using the Position option in the Properties pane.
Running The Paginated Report
Make sure to save your work from time to time. Once you’ve added all the objects you want and are satisfied with your report, you can run it to view how it’ll look when rendered into a paginated report.
Under the Home tab, click Run.

You’ll then see the rendered version of your report.
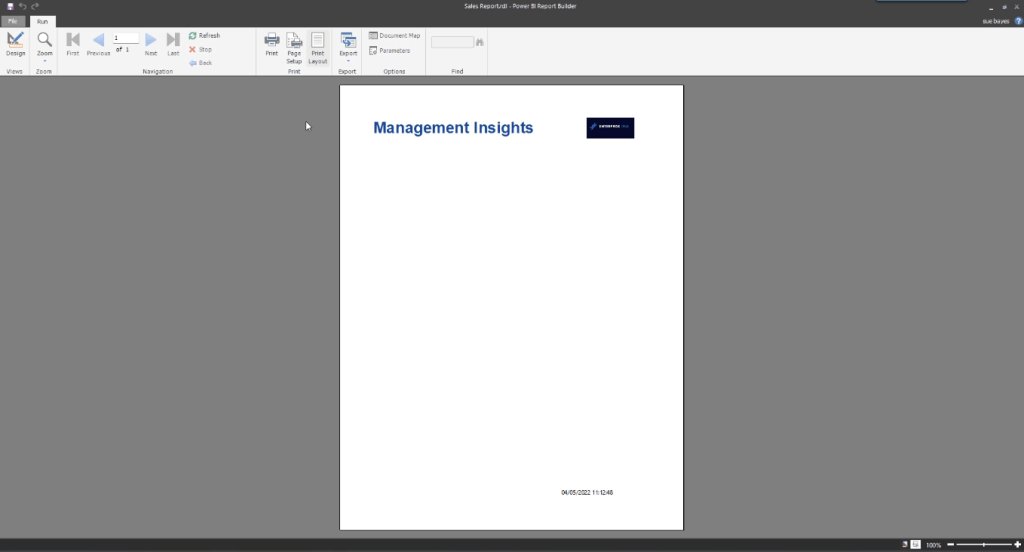
You can toggle between the design view and the print layout view by clicking on the Print Layout button.
Once you’re satisfied with how it turned out, you can then export your report into the format you want by clicking on the Export button.

You can save your paginated report on your computer. This means that you don’t need to publish your report to the Power BI Service.

***** Related Links *****
How To Import Datasets Into Report Builder
Create A Blank Report Using Power BI Report Builder
Power BI Best Practice On Reports & Visualizations
Conclusion
This tutorial covers the basics of creating a paginated report. Adding texts and images is very intuitive. The process is similar to that of other Microsoft products which makes Report Builder a great tool to use.
The highlight of this tutorial is the Properties pane. It’s a feature that makes editing and formatting in Report Builder easy. There are more options in the Properties pane to explore that will help you create a well-made paginated report.
Sue


