In this tutorial, you’ll learn about turning multiple calendar type layouts into a tabular format using Power Query in Power BI. You’ll learn how to transform multiple files instead of a single file from a folder. You may watch the full video of this tutorial at the bottom of this blog.
This tutorial will also teach you how to fill gaps in your data and how to harvest them in Power BI.
Preparing The Files & Layouts In The Power Query
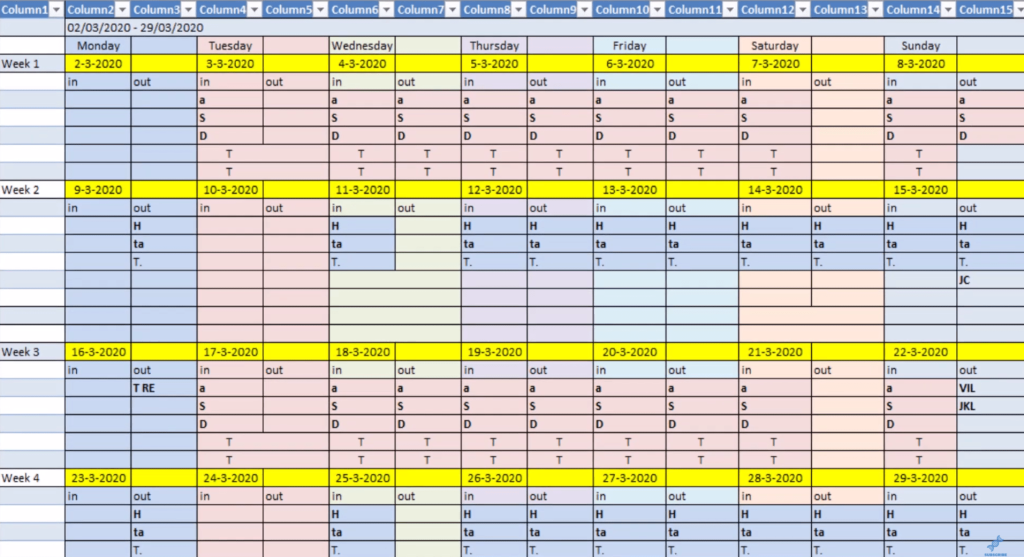
This is the typical layout of the files and weeks set out horizontally and vertically. From file to file, the number of rows can differ because of the variation in the number of rows.
Now, go to Power Query and get the files. Select New Source and click More. Then, click All and choose Folder.

Select Parameter and press OK.

It’s going to show you the files in Folder. You need to get all the files together in a single result query. Clicking Combine & Transform loads the data and creates a number of queries.

Next, choose any file in the folder as a Sample File and select any item you want to start.
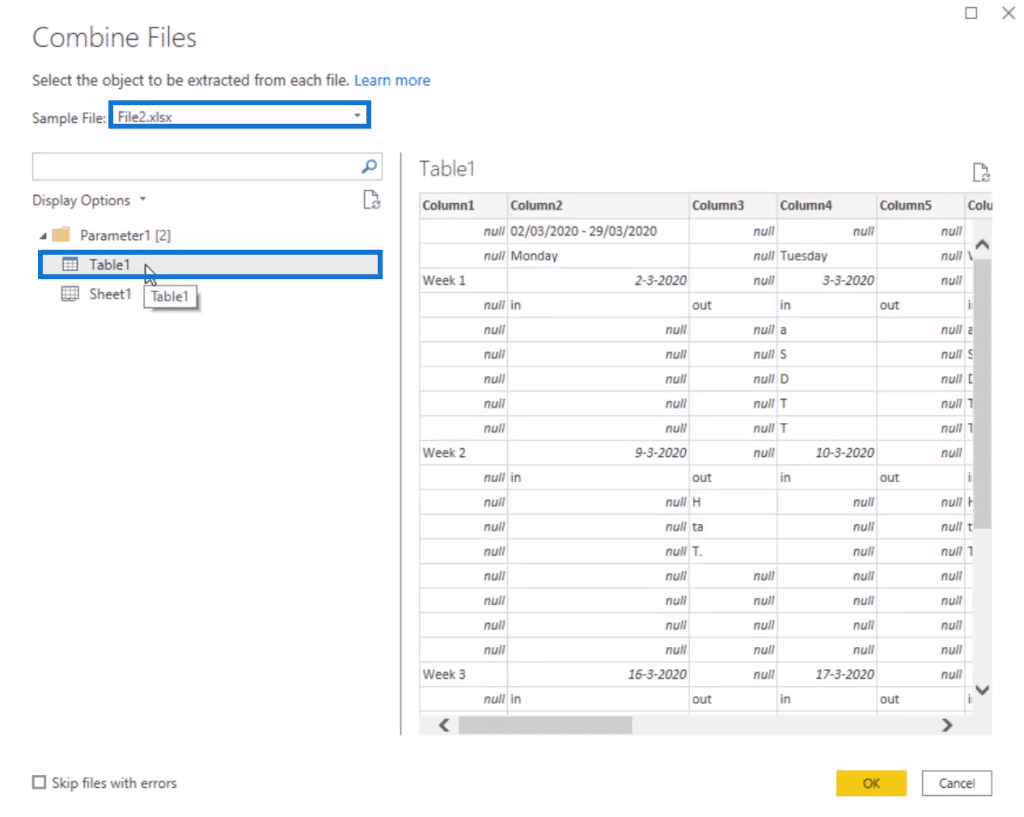
Looking at Query1, you can see data from both File1 and File2.
Formulating Calculations In The Power Query
The format of the data in Query1 is still incorrect . You can change it through the Transform Sample File query.
If you change the format of that query to a tabular form, it will serve as a blueprint for all the files in the folder.
Remove the first 2 rows and Column1.
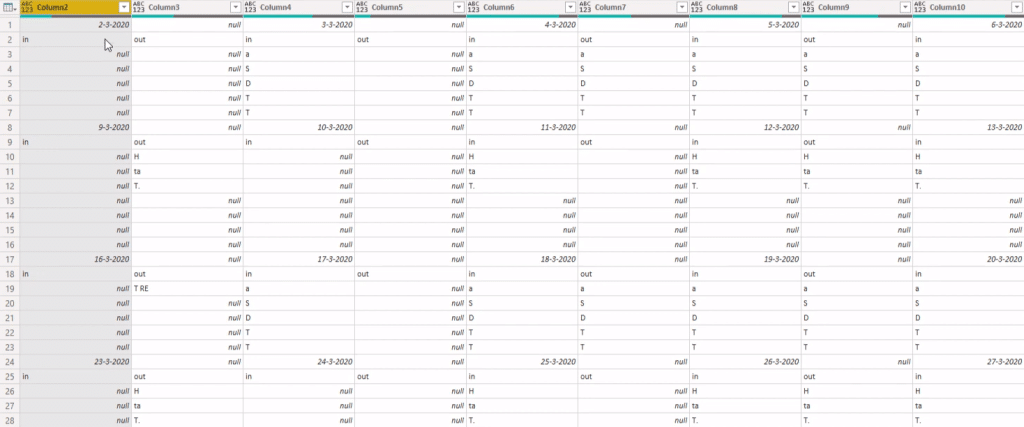
Next, fill the gaps inside the table. Go to the Transform tab and select Transpose. Select the columns containing dates and click the header. Click Fill and choose Down.

The columns with dates in the formula bar mean that if there is a varying number of rows in each week, the results will not be in those columns. So, delete the Filled Down step in the Applied Steps section.
Each group of tables starts with a column containing dates. You have to perform basic operations to get them back into a tabular format.
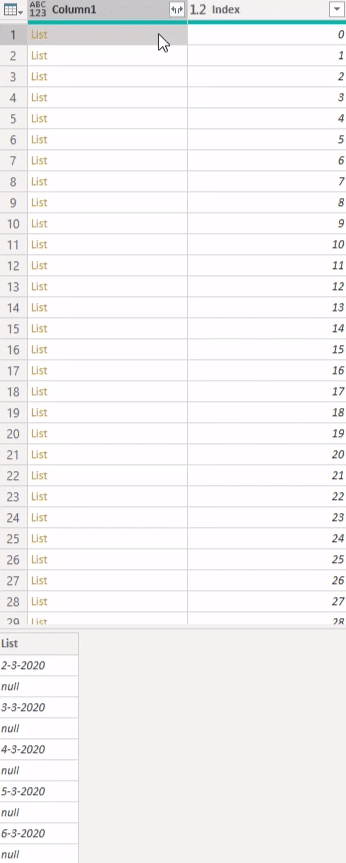
Add a manual step by pressing f(x) in the formula bar. Then, input Table.ToColumns. This turns each column into a list containing lists.

Turn the list into a table and add an index number. You can change from 0 or 1.

Filling The Gaps In The Dates
There are still gaps in the dates that you need to fill down. However, the fill down operation doesn’t work for lists. You need to turn this list into a table.
Select Index column and click Group By. Replace Count to ToTable to change the column name. Change RowCount to FromColumns and point to Column1 where the lists are placed. Then, turn it into a type table.

You can now see that the list is turned into a table with only one column.

Now, perform the fill down operation for each table. First, add a custom column and call it FillDown.
You have to access the first value of the first column in the table so for the formula, use IF. Reference the ToTable column that holds the table. Input Column1 as the column you want to reference. Next, use null between them to retrieve the first value from the list.
Then, check if that is a date. If it is, fill that column down with Table.Filldown. Inside that function, input the ToTable and Column1. But if it’s not a date, input ToTable to return the entire table.

This will give you a new column with tables filled down.

Find where the column dates are placed and split them into separate tables. To do that, you have to turn the tables into a list of columns.
After the Table.FillDown and Else functions in the formula bar, reference Column1.

This will turn your tables into lists with set of dates.

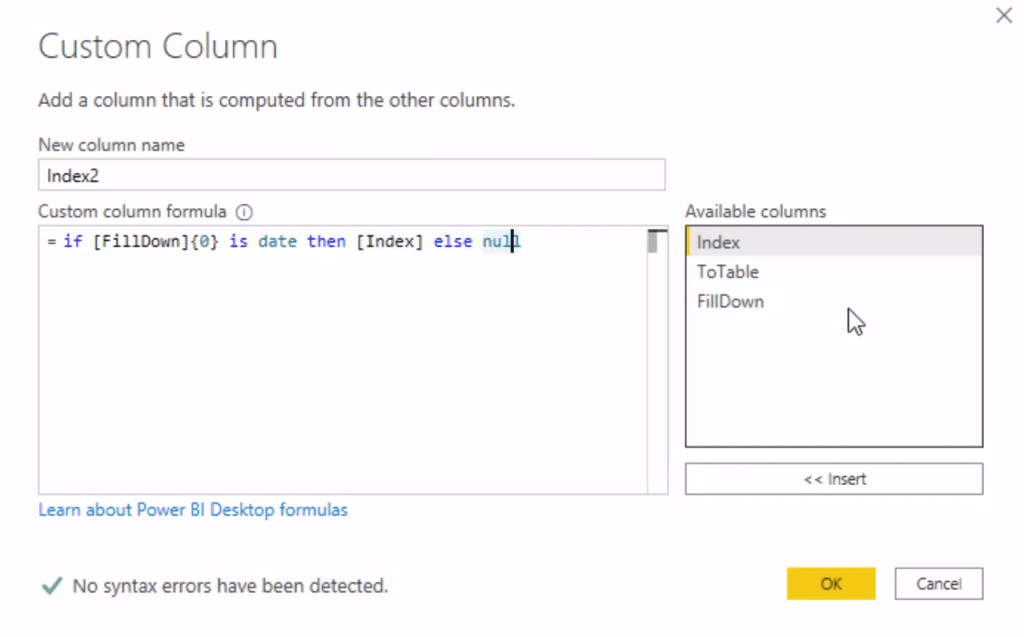
Next, turn the list back into a table by updating your index column. Remember that the dividing place is where the position of the date column is. So, add a custom column and call it Index2. Then, check if the list contains dates.
Use IF and input FillDown. You only have to check the first value on the list. If it’s a date, return Index. If not, input null. Then, fill that column down.
Grouping Separated Tables
Use Group by on the Index2 column. This groups the tables with the same Index2 values into one.

You’re not going to count the rows. So, change the RowCount to FromColumns and add the FillDown column. Then, change the type to table.

If you click a table, you’ll see the columns within it.

Next, you have to append all separate tables together into a single table. Create a manual step and use Table.Combine. Then, reference the Count column inside it.

Select Column1 and Column2. Click Transform and select Unpivot Other Columns. It will then show you 4 columns.
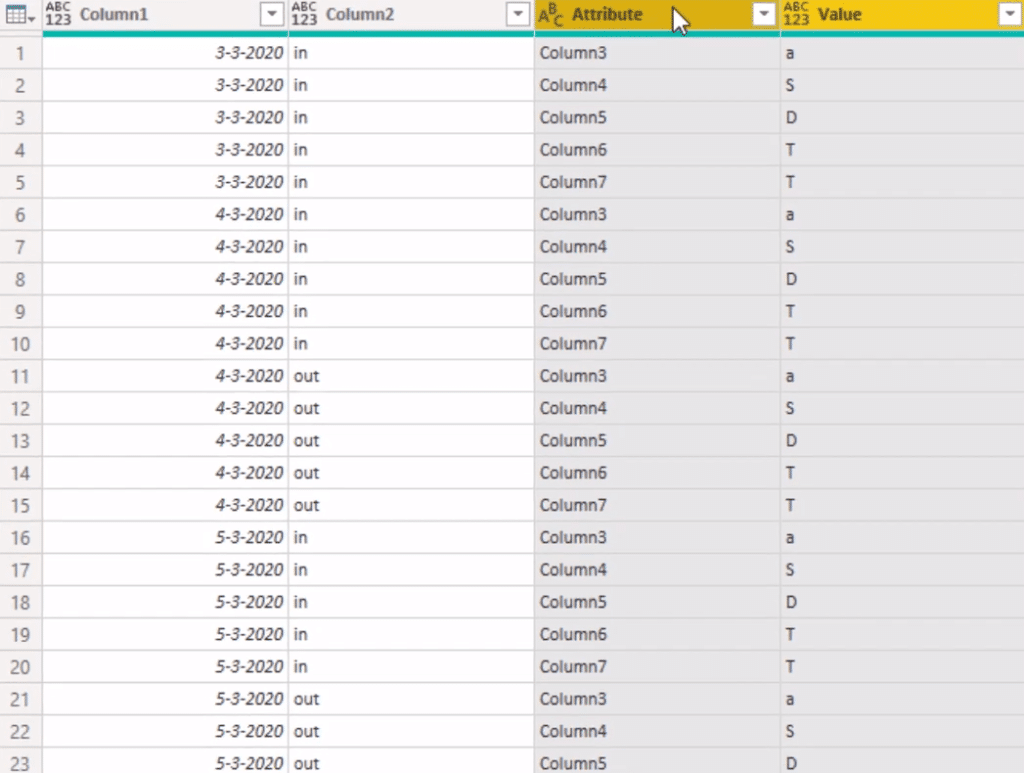
Remove the Attribute column because it isn’t needed. Then, change the columns’ names to Date, Movements, and Name. Change the data type of the Date column to Date and the Name column to Text.

You’ve now updated the transformations to the transform sample file.
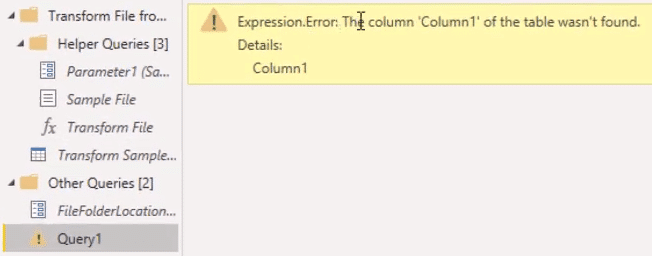
If you go to Query1, you can see that Column1 of the table can’t be found. So, remove the Changed Type step in the Applied Steps section.
Lastly, change the data types of the columns. Set the data type of the Date column to Date. Then, set the data type of the Movements and Name columns to Text.

You now have updated and changed the data model’s format into a tabular form.
***** Related Links *****
Power BI Custom Calendars: Calculating For Month On Month Change – 445 Calendars
Custom Conditional Formatting Techniques In Power BI
How To Work With Multiple Dates In Power BI
Conclusion
In your data report, you have to fill the gaps in your date table by turning calendar layouts into a tabular form.
You can transform multiple columns using Power Query in Power BI. This will give your report correct and valuable insights to harvest.
All the best,
Melissa
[youtube https://www.youtube.com/watch?v=JhvGJ8XY-cI?rel=0&w=784&h=441]


