
In today’s blog, we will explore why you should not use the CALCULATE DAX function to obtain Average Per Category and provide some alternative solutions to get the same results you want. You can watch the full video of this tutorial at the bottom of this blog.
Getting an Average Per Category in DAX is weirdly complicated. By using the CALCULATE function to solve these calculations, new DAX users may find the DAX code harder to understand than it should be. The good news is that there are simpler solutions to this problem.

Overview Of CALCULATE DAX Function
A few months ago, I presented at the Business Intelligence Summit 2022 for Enterprise DNA. It was called the DAX Counterculture where I provided some alternative views on DAX.
One of the main ones relates to the use of the CALCULATE function. I talked about why you shouldn’t use CALCULATE especially if you’re new to DAX.
CALCULATE is a really complex function to understand and use. It makes certain assumptions about your data model and can get you in a lot of trouble.
I also dug into Microsoft’s quick measure for Running Total because it doesn’t work in single table situations and it needs a star schema to work properly.
So, I showed an easier alternative that works whether it’s a star schema or a single table model without the need for CALCULATE.
CALCULATE DAX Formula
This blog will delve on a quick measure called Average Per Category. If you are in Power BI desktop, start by going to the Fields pane and creating a New quick measure.

In the Quick Measure window that will pop-up, choose Average per category in the Calculation dropdown. Then, drag ? Value in the Base Value text field, and Month in the Category field.
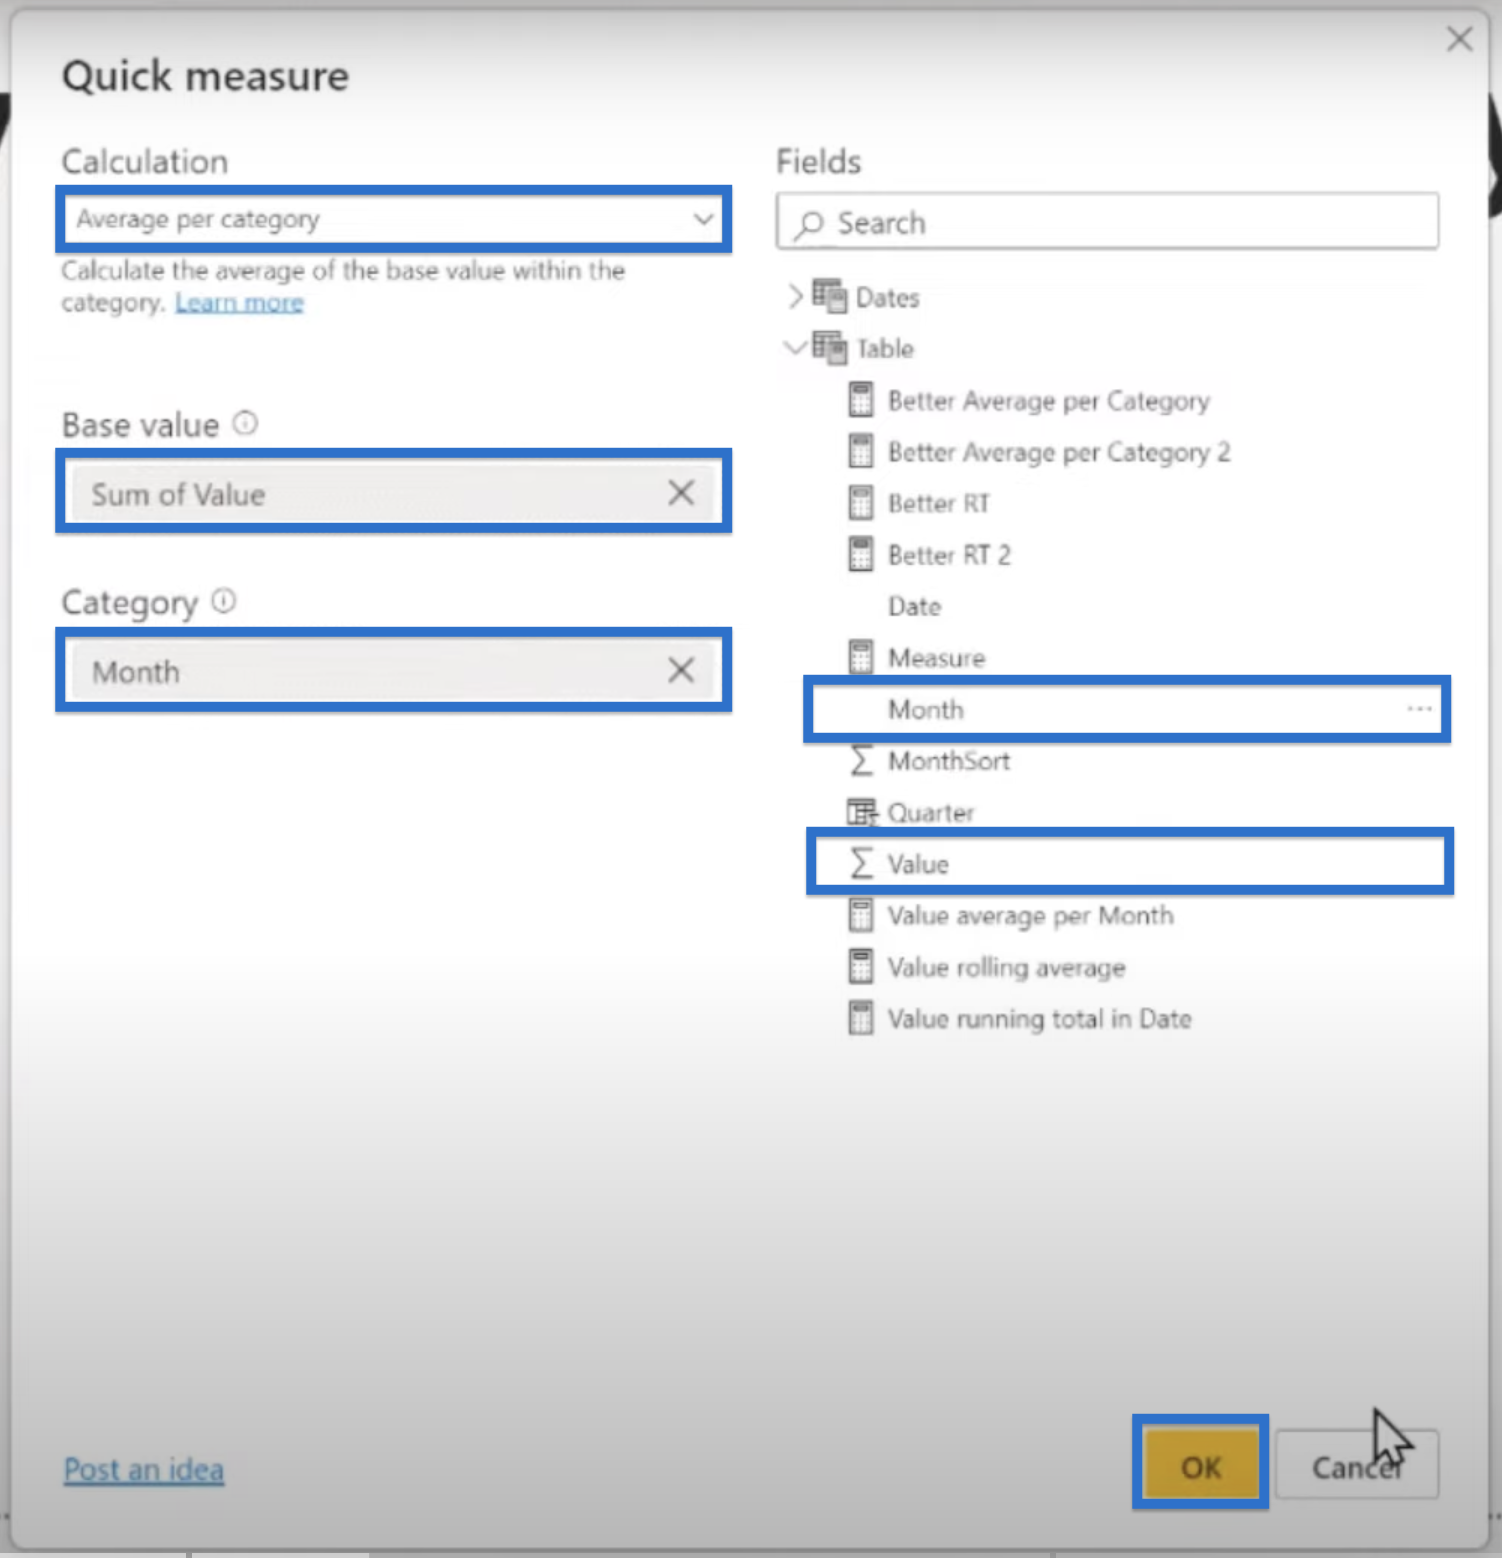
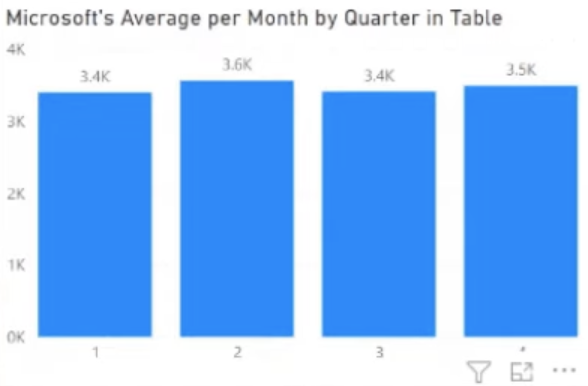
Then click OK and you’ll get a visual that looks like this.
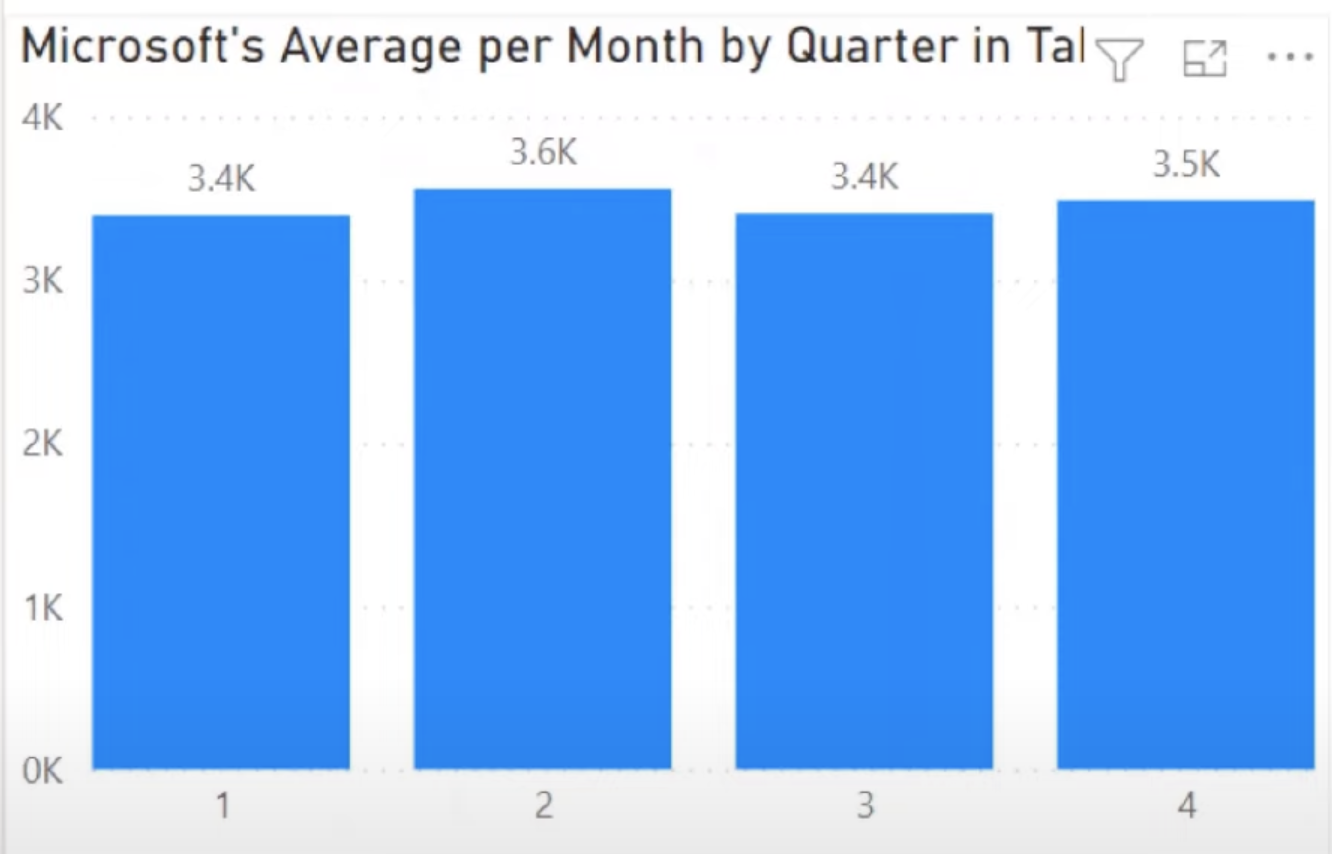
In the x-axis are the quarters—Quarter 1, 2, 3, and 4.
And what you want to do is sum up the values for every month shown below and then take the average across those values. In short, the Average Per Category, which is the topic of our blog.
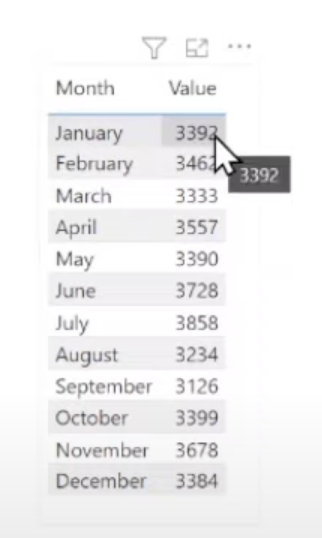
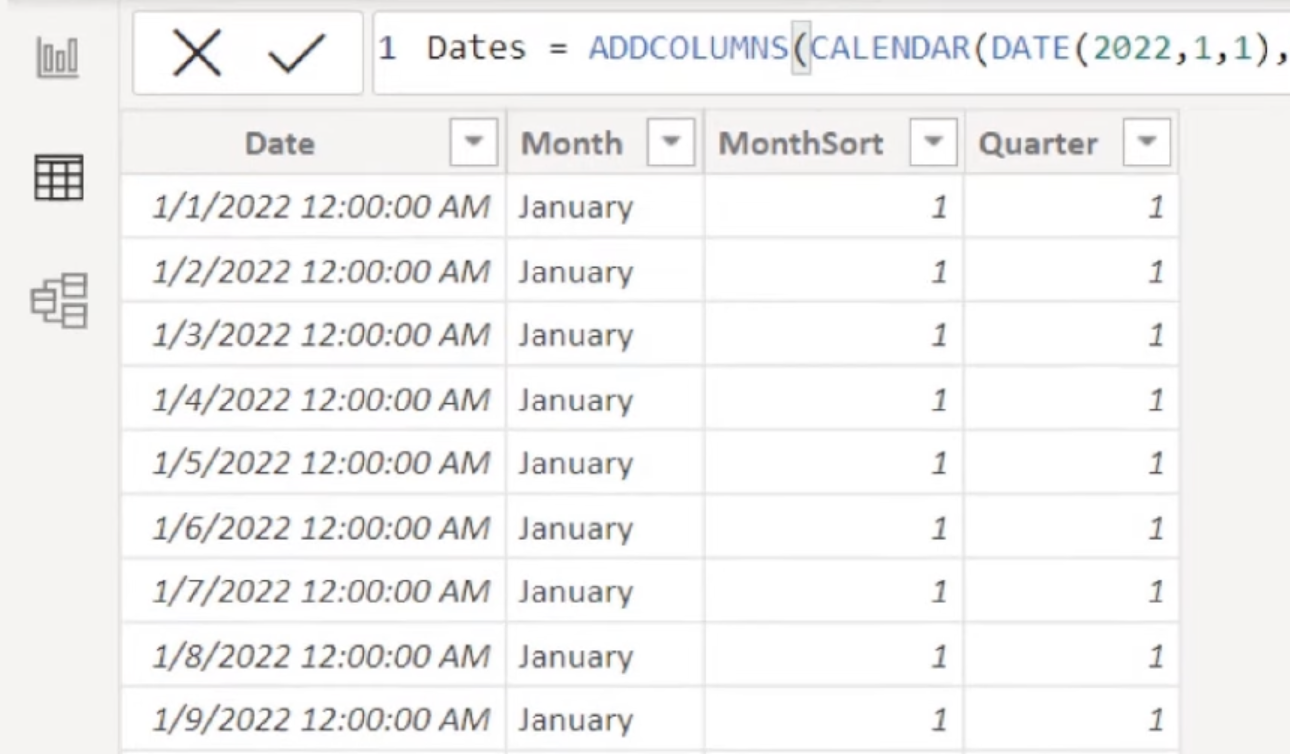
Our data model for this is very simple. We have a table with Dates, Values that are randomly generated, and Month, MonthSort, and Quarters in separate columns.

And we have the same thing in our date table with the Calendar Table, Month, MonthSort, and Quarter. This means we can choose the Quarter or Month from either the date table or the first table.
The good news with Average Per Category is that it actually works regardless of whether you have a single table model or a star schema.
In these visuals, we’re using the Quarter from the first table…
…while this one uses the Quarter from our date table. It works either way.

But the problem with the Average Per Category is simply the DAX code.

This DAX code is weird, because even if you’re a DAX expert, it’ll probably confuse you at the first glance. It’s oddly constructed with a CALCULATE statement with no filter clause and just wraps a sum statement.
In fact, it’s one of those pet peeves of mine when I see people out on the forums who use CALCULATE that just wraps a sum for no reason. But in this case, it actually has a reason.
It boggles my mind whenever I see those because it’s just an immediate indication that they have no idea what they’re doing with the CALCULATE function. So I recommend just staying away from it instead.
DAX Code For Average Per Category
The DAX code shown above uses KEEPFILTERS. This function is not in a CALCULATE segment, which again, makes it weird. Supposedly, this function is built for use in CALCULATE statements based on its documentation.
The code also uses VALUES, which I don’t agree with. They should never use VALUES because distinct values have a tendency to return a blank row if there’s a non-matching row. That can get you in a lot of trouble, but that’s a subject for another video.
Essentially, what’s going on here is they’re using a VALUES function to get all of our categories. For example in Quarter 1, that’s January, February, and March. VALUES also returns a table but they’re using a KEEPFILTER statement to make it valid as a first parameter in AVERAGEX.
They also keep the CALCULATE function to execute within the context of KEEPFILTERS. Because of the way AVERAGEX works, it takes the second expression and executes it within the context of the first expression.

What’s The Problem, Then?
Overall, it works okay but not for someone new to DAX. I believe Microsoft really missed the boat when they created this quick measure because quick measures are supposedly for people new to DAX.
Quick measures are a great idea, like “Let’s write some common measures with different calculations for you because you’re new to DAX and you don’t know everything there is to know about DAX.” But why would they construct them in such weird, complicated ways?
How is somebody new to DAX supposed to take a look at this and figure out what’s going on when even probably DAX professionals are scratching their heads a little bit over this one?
So for me, they missed a golden opportunity to help people learn DAX with their quick measures by insisting that they include CALCULATE and having to jump through hoops in order to get the CALCULATE in there.
The Easier Solution
Using The SUMMARIZE Function
As I’ve mentioned earlier, there’s a better and simpler way to do it.
First, create a table variable using VAR_Table. Then, we’ll use SUMMARIZE to take the Table, summarize it by Month, create a Value column, and sum up our values.
Finally, we’ll take the average of our values using the AVERAGEX function.
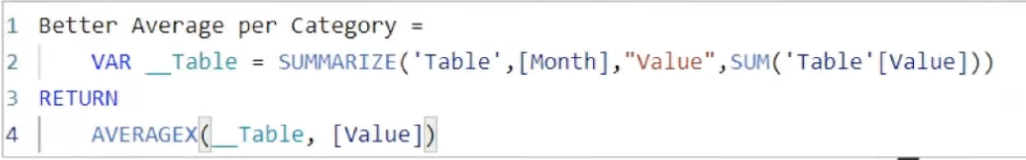
This code is simpler and is so much more logical. It doesn’t include CALCULATE, which you don’t need anyway.
You may come across a blog article out there criticizing SUMMARIZE. The blog says the way SUMMARIZE works internally is pretty complicated.
It also suggests you can get yourself into trouble in one specific case but you’ll never run into it. That would only happen if your calculation involves a very complex calculation and a very large table. Only then will SUMMARIZE give you wonky results.
At least that’s what the blog article claims. And it’s fine if you’d want to shy away from SUMMARIZE. In that case, use the GROUPBY function instead.
Using The GROUPBY Function
Nobody has a problem with using the GROUPBY function so let’s learn how to use that too. Again, create a Table variable using VAR_Table. Then, we GROUPBY Month and create a Value column.
Next, we apply SUMX using the CURRENTGROUP, which is how GROUPBY works. Let’s sum our Value and again take the AVERAGEX across it.
Our code should look like this.

Comparing The Results: SUMMARIZE vs GROUPBY vs CALCULATE DAX Functions
Now, let’s see if the shortcuts we did return the same results.

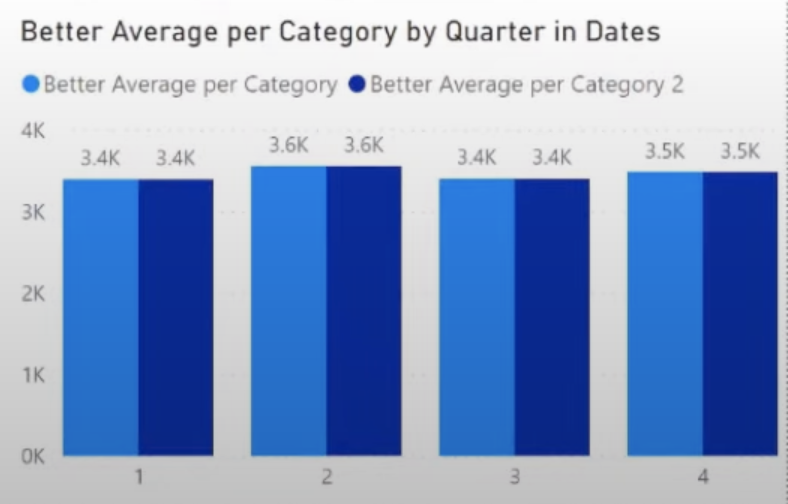
As you can see in the images below, both SUMMARIZE labeled as Better Average Per Category and GROUPBY labeled as Better Average Per Category 2 return the same numbers.

Both of our formulas return 3.4K for Q1, 3.6K for Q2, 3.4K for Q3, and 3.5K for Q4. And again, they work in a single table data model using Quarters for our table.
They also work in a star schema where we use Quarters in our date table.
***** Related Links *****
Quick Measures – How To Use Them In Power BI Models
Using Calculate Function Inside Power BI
Effective Ways To Use The GROUPBY Function In Power BI
Conclusion
We don’t need to force ourselves into a twisted context logic just to get CALCULATE into our formulas. Just use simple standard DAX functions and you can achieve the same things.
In fact, probably in 80% – 90% of the cases, there’s absolutely no reason to bother with using CALCULATE for anything. Instead, you can use the SUMMARIZE and GROUPBY functions which are simpler and more logical.
If you want to explore this PBIX file, I’ve already published it out to the Quick Measures Gallery and named the file Better Average Per Category. Just scroll all the way down the page to find the PBIX file that you can download and you play with yourself.
All the best,
Greg Deckler
[youtube https://www.youtube.com/watch?v=BY-5waiLp0g&w=784&h=441]


")