Calculating a cumulative total, also known as a running total, in Power BI, is definitely common to most businesses due to its indispensability in performing calculations to show the total of a measure up to a certain date. You may watch the full video of this tutorial at the bottom of this blog.
But did you know that creating a reverse cumulative total is as essential as calculating the cumulative total?
In this article we will go over on how to calculate a reverse cumulative total in Power BI using DAX.
Reviewing The Problem
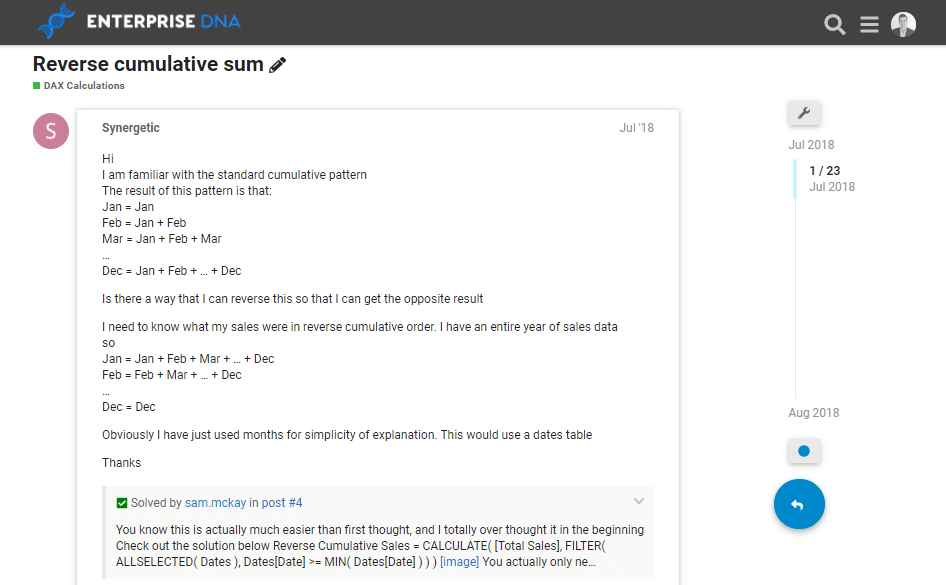
This has been raised in the Enterprise DNA Support Forum as a question.

You can view this forum post here – Reverse Cumulative Sum
A member had a distinctive requirement from December to January in which they needed a cumulative total. They wanted to make it dynamic as well, where the reverse cumulative total would be adjusted for that particular logic in the report whenever they wanted to change the year filter on the page.
Gladly, I was able to come up with an answer that was quite easy after working through a solution.
It was a simple variation on the most common cumulative total formula combination that you can use and reuse within Power BI quite efficiently.
But before we tackle the Reverse Cumulative Total, let’s first focus on the Cumulative Total.
the Cumulative or Running Total formula in Power BI
The Cumulative total, or running total, is used to display the total sum of data as it grows with time or any other series or progression. This is very useful in detecting changes in a certain logical pattern, and in determining whether the forecasting system is no longer adequate.
This image shows the formula for calculating the Cumulative Total in Power BI.

Let’s try to gradually analyze the given formula.
1. include the total sales from each date
The first thing that we need to do is to include the Total Sales from each date.

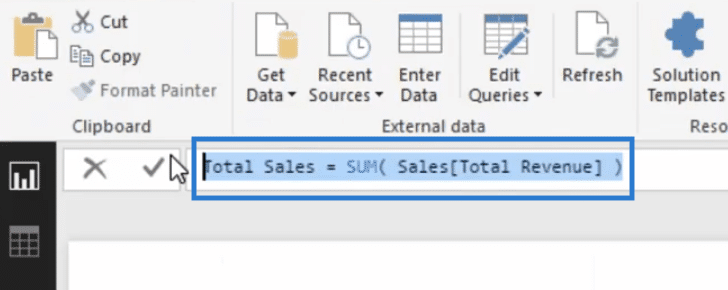
The Total Sales is the sum of all the numbers in a column. In this particular example, the Total Sales is the sum of the Total Revenue column.

Then, using the ALLSELECTED function, we listed all the dates from the specific year (in this case 2017) inside the FILTER function .

You can also opt not to use the ALLSELECTED function if you want to display all the dates without selecting a specific year.
2. Compare the current date to the mAX DATE
We then need to compare the current date to the MAX date.

This MAX function returns the maximum value in a column, including any logical values and numbers.
In this example, the MAX function determines the maximum value within the Date column. Then, all the dates that are less than or equal to the MAX date will be displayed.

3. Evaluate the total sales using the ISBLANK() function
We also added an IF logic which evaluates the Total Sales using the ISBLANK() function. This DAX function returns TRUE or FALSE after checking whether a value is blank/zero or not.
In this particular example, if the Total Sales is zero, a blank value should be returned, otherwise the value of the CumulativeTotal variable will be returned.

We used this logic for this example to display only the dates with the actual sales that we’re making, without including the dates that don’t have any data yet.

In the example below, the result under the Cumulative Sales column from February 1, 2017 was calculated by adding the current amount of Total Sales ($10,485) to the amount of Total Sales ($14,506) from January 1, 2017.
That’s also how the result from every single row under the Cumulative Sales column was calculated.

Calculating the Reverse Cumulative or Reverse running Total in power bI
Now that we have calculated our Cumulative Sales, let’s try forecasting the reverse cumulative total. To calculate it, we can still use our Cumulative Total Formula with some minor changes.
What you need to do is to apply a small adjustment to the row context filtering which occurs within the FILTER function of the formula pattern.

Within the FILTER function, the current date should be compared to the MIN date instead of the MAX date.

This MIN function returns the minimum value in a column.
In this example, the MIN function determines the minimum value within the Date column. Then, all the dates that are greater than or equal to the MIN date will be displayed.
For instance, we calculated the particular result under the Reverse Cumulative Sales column from January 2017 by adding every single value of Total Sales from the dates below the current date (February 2017 to December 2017).
That goes for every single row under the Reverse Cumulative column.

The solution is simply just reversing or tweaking the formula for calculating the cumulative total that we currently have.
***** Related Links*****
Simple Filters w/CALCULATE – (1.13) Ultimate Beginners Guide to DAX
How To Calculate Budget Or Forecast Results Cumulatively In Power BI
Compare Multiple Metrics Cumulatively in Power BI using DAX
Conclusion
Reverse Cumulative Total definitely has the potential to prove its value in process control and forecasting, detecting when the pattern of customer demand changes, and when a forecasting system is no longer adequate.
Most users won’t generally be using it, but this could also be an essential modification of how the CALCULATE function works in combination with the FILTER function.
When you utilize these two DAX formulas together, you’ll be able to generate quite interesting and unique forecasts for your data.
Here are some recommended links for you so you can explore cumulative total techniques inside of Power BI more.
Create Dynamic Cumulative Totals Using DAX In Power BI
Cumulative Totals In Power BI Without Any Dates – Advanced DAX
Hopefully, you can get a good understanding of how this particular calculation operates inside Power BI.
Sam
[youtube https://www.youtube.com/watch?v=DU6Rxxvx-Nc&w=784&h=441]


