This tutorial will go through an advanced example on the DAX function RANKX in Power BI. You may watch the full video of this tutorial at the bottom of this blog.
This is a breakout session from the Learning Summit Workshop in Enterprise DNA Online.
The RANKX function gives you valuable insights when you use it for a range of different contexts in your report page. However, it can also be one of the most confusing functions to use in Power BI.
It can give you different results that seem to be correct, when in fact, they’re wrong. If you’re not careful, you’ll end up reworking the entire report.
Relationship Between RANKX And Contexts
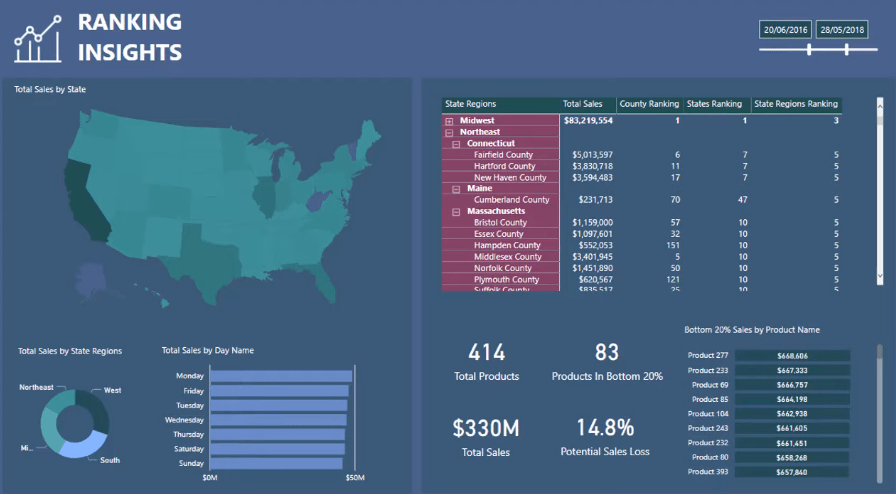
In this visualization, you can see the County Ranking, States Ranking, and State Regions Ranking.
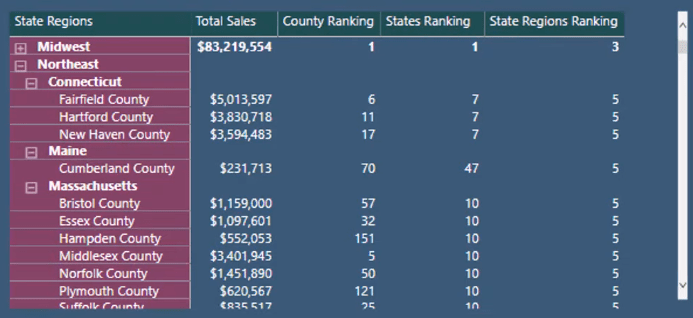
Managing the context of the calculation can be difficult if you want to see them all in one matrix.
Let’s look at the table.

You can see it has information on the State Regions, State, and County.
For this example, you need to work out the ranking of the Counties.
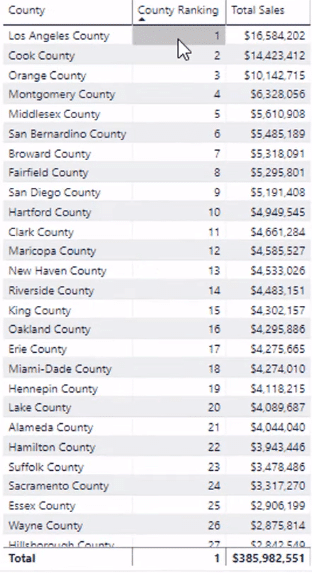
If you just have the County, County Ranking, and Total Sales in the table, you get the correct ranking results:
But once you start to layer the other contexts in the table, the ranking result starts to accumulate each County that is in different States and State Regions.
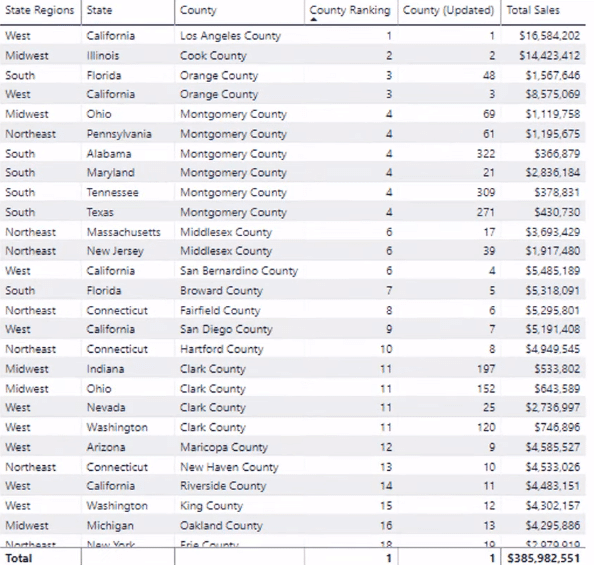
So, you need to identify and change the context of the calculation to make sure you get the correct overall rank for each County regardless of what’s selected on the report page.
Whenever you select a State like Colorado, the formula updates too.

You can also make a selection using State Regions. If you select Northeast, it shows the proper ranking.

Formula For County Ranking
In this tutorial, two formulas are used to get the County Ranking. This will help you understand the difference in the results generated by using different DAX functions along with RANKX:
Formula #1: Using ALL And ALLSELECTED
The ALL function is the key part of this formula for County Rank:

It manipulates the context within the RANKX formula. It then iterates through the Regions table and creates the ranking result.
In this case, the ALL function is virtually working through every single County regardless of the initial context.
This problem becomes complicated when you start to layer on slicer contexts. By using ALLSELECTED, the ranking will automatically update depending on the selection in the slicer.

You also need to utilize CALCULATE to place additional context to a result or to change the context of the calculation.

The context is adjusted based on the filters within the CALCULATE function.
With this, the ranking will adjust based on the context coming from the State and State Region slicers.

Formula #2: Using ALL And VALUES
Let’s now look at the County (Updated) column.
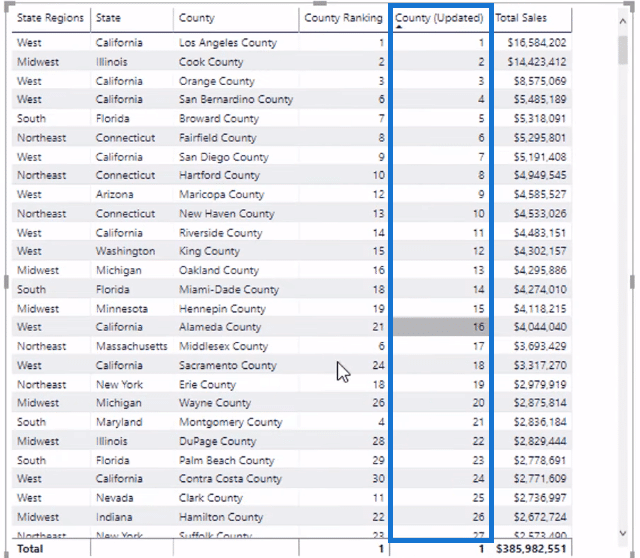
You want to make sure that this column will continue to show the overall rank regardless of what’s selected in the slicers. Every County should have a unique number.
This is the formula used:

For this example, there wasn’t a way to decipher a unique County. So, another column was created. The Full County column includes the County, State, and Region.

This gives you a good distinction between Counties. This way, you can now work a virtual table of the Counties that are in the data.
Before doing this, you need to remove the ALL context from the Regions table.

So, any context coming from the Region’s table doesn’t exist at this point in time. With the VALUES function, you can add back the context of the Full County column.

One option is to reference every column using the ALL function. But the better alternative is to get rid of all the context from Regions and only bring back the Full County.
Once the context has been manipulated inside CALCULATE, the RANKX function starts its work from there.

It works through every single County at every row along with their Total Sales, and then ranks them. That’s how you get the values of 1 to X under the County (Updated) row.
As a result, filters and slicers won’t matter and won’t affect the ranking because the formula has been set to ignore them.
***** Related Links *****
Creating Dynamic Ranking Tables Using RANKX In Power BI
RANKX Considerations – Power BI And DAX Formula Concepts
Find Top Customers Using RANKX In Power BI
Conclusion
RANKX is not an easy function to use. The key is to focus around the nuances to be able to understand the function better.
Hopefully you have learned more about the advanced applications of the DAX function RANKX in Power BI.
You can check out the Mastering DAX Calculations course in Enterprise DNA Online for more discussions on the RANKX function.
All the best,
Sam
[youtube https://www.youtube.com/watch?v=afTb3qPV32E?rel=0&w=784&h=441]


