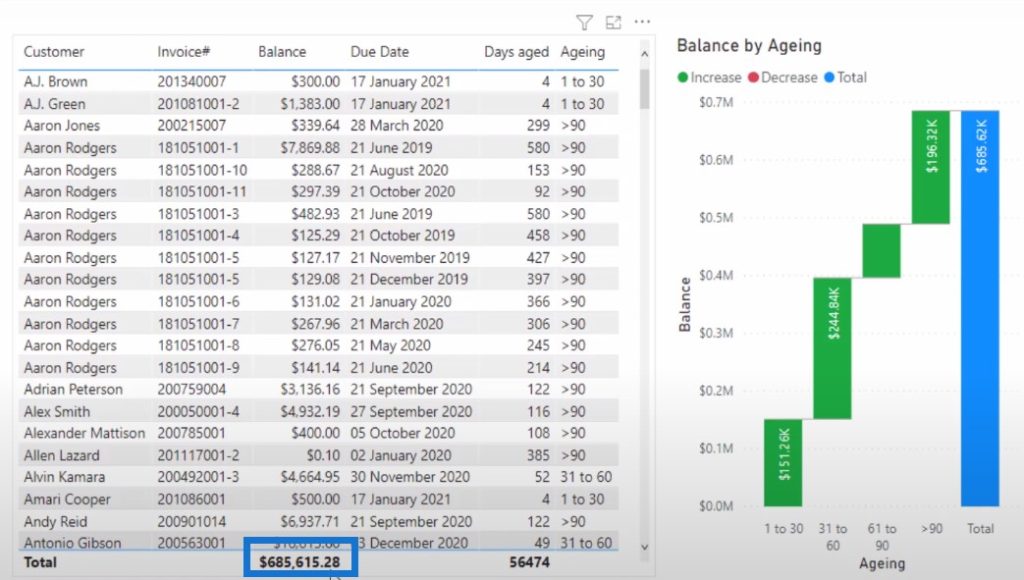
In today’s blog post, we’ll discuss Problem of the Week #6. I’ll show you how to format data in Power BI involving the use of power query. The screenshot below is the solution that you should have after you’ve done all the data transformation. The actual balance number was $685,616.33. You can watch the full video of this tutorial at the bottom of this blog.

We had a lot of participation for Challenge #6. I appreciate everyone’s efforts in trying to get this accomplished. One thing to note is that we saw a bunch of entries that had the balance off by just a little bit. I’ll show you as I go through my entry for this challenge why that dollar amount was off.
Note that my solution on how you can format data in Power BI involved multiple steps and that there were many entries that condensed those steps. I will take these shortcuts into account for future endeavors that I have with this type of data. So not only did participants help solve the Problem of the Week, but they also helped me out in the long run as well when it comes to developing reports.
I’ll open up power query and go through step-by-step on how I came up with my solution. Here’s what the finalized product looks like.

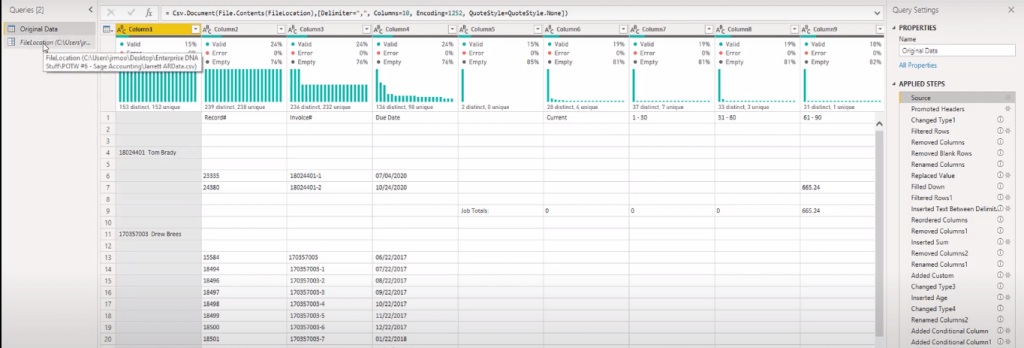
But if I click on the source, you’ll see that this is what originally showed up when we connected to the file location where we stored the CSV file.
Benefits Of Comments
Check out the steps on the right-hand side. You can see the small “i” which is short for information. This indicates that there are comments made in the advanced editor.
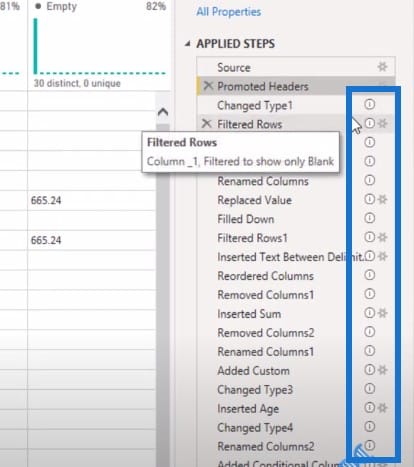
Let’s open up the advanced editor real quick here. You can see that the texts that are in green are comments that help me remind myself what I was thinking of at that time.
It leaves a trail of what I’ve done in the past so if somebody new comes in to look at the file, they can at least have an idea of the path I went down.

We can see the comments on the side here. The first comment on Changed Type1 is basically about the changing of types for the different columns. As you can see, the comment I made is “Make sure that the current column is set up as decimal, or this is where things will start to go bad!”
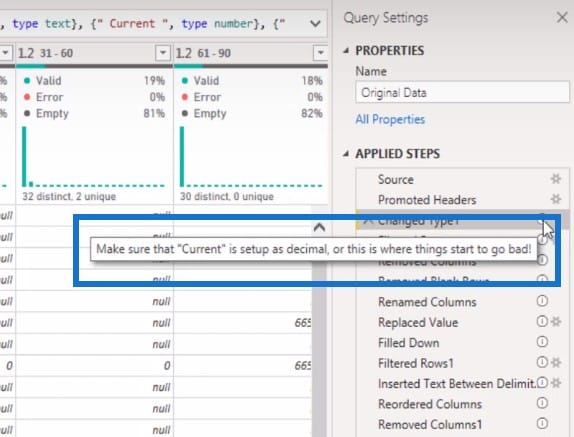
This brings me to the point of why folks come up with that wrong balance amount that I showed you earlier.
Reasons For The Wrong Amount
Let me show you another PBIX file that I copied from somebody who had one of those entries. $685,615.28 is the wrong amount, and there were numerous entries that had this resulting amount.
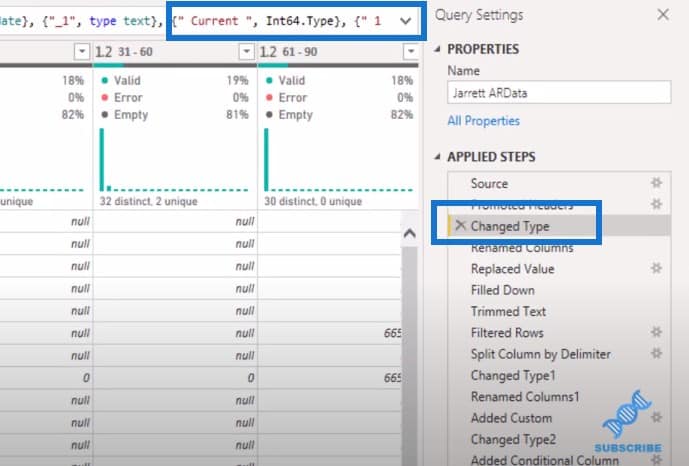
Let’s figure out how and why that happened. If we go into the Transform tab and click on Detect Data Type, which automatically detects all of the rows, we can see that the current column comes up as an integer 64, which is not what we want to see.

This is why the amounts are wrong. There’s also another way that this error can show up in your settings. Let’s go to File>Options and settings>Options.

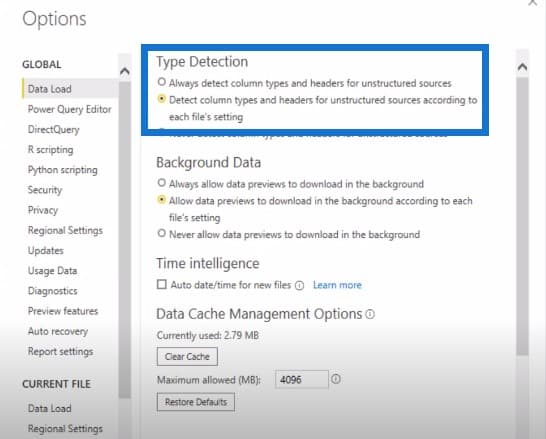
Under the GLOBAL area and Data Load section, we can see Type Detection. I have chosen Detect column types and headers for unstructured sources according to each file’s settings.
If you select the first option, which is Always detected column types and headers for unstructured sources, you would have gotten the error in the balance amount as well.
One of our Enterprise DNA experts who has been a huge help when it comes to M code or power query language is Melissa. She showed me a Microsoft document that will explain to us why this error happened.
As you can see, this used to be called Project Options. The option for Automatically detect column types and headers for unstructured sources has been checked.

The document also says that it only goes based on the first 200 rows of your table.
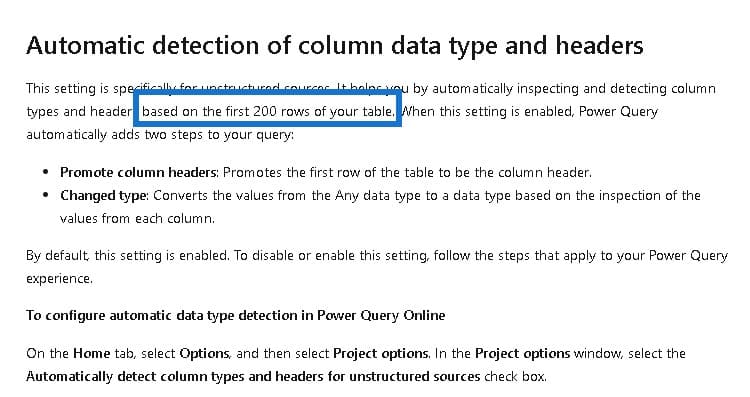
In my table, the original amount of rows was around 4,000 or so rows. So this is why it did not pick up the right amounts.
Let’s head back over to power query and start to format data in Power BI. As you can see in the Changed Type step, it is an integer 64 with current.
So what I’m going to do here real quick is filter by one of these invoice numbers to show you what it looks like before and after.
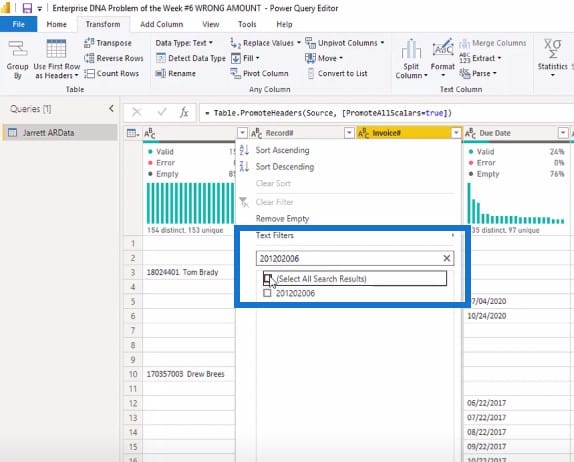
Once I select a particular invoice number, we can see that the amount of current is 4,741.01.

Once I click on this change type, you’ll see the value has changed and it rounded off to 4,741.

So this is a quick and easy way of explaining what went wrong with the other entries for the Problem of the Week.
Let’s go back to my solution in power query M. The next step is where I filtered rows to only show the blank rows.
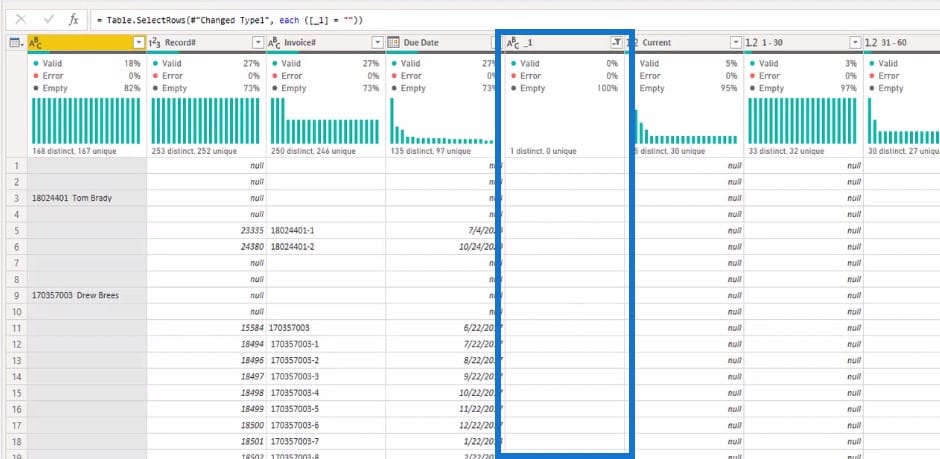
Next step is where I removed columns. I removed all the columns except the ones that you see on the screenshots. Also, note that the record number that originally came up is actually the invoice number.

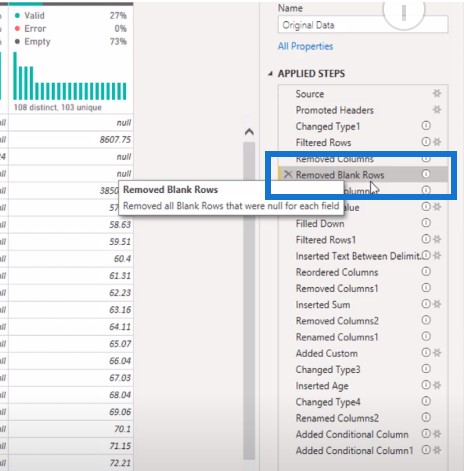
The next step is to remove the blank rows that were null for each field.
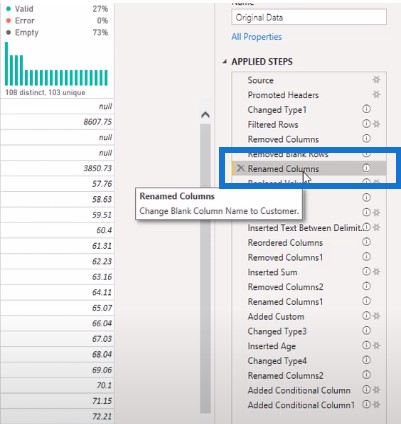
And then I renamed the first column that was blank before and changed that to Customer… because we’re going to add another field which will be my actual Customer field.
The next step was to replace all the values of a blank to null in the Customer column. The reason why we have to do this is because of the next step.
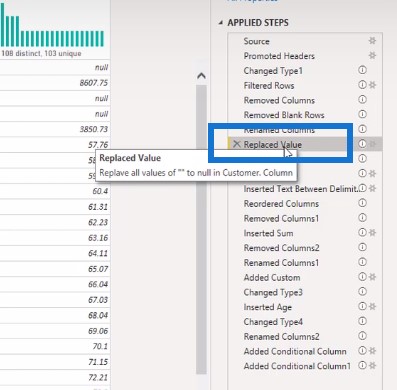
In order to fill down all of these rows, none of these can be blank and they have to be null.
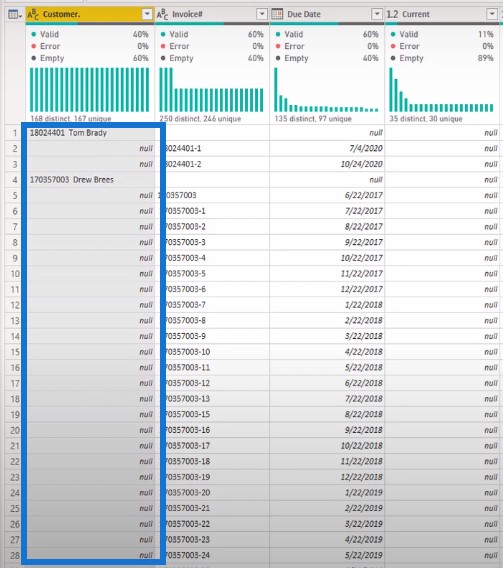
In order to do fill down, click on the column, go to Fill, then Down.
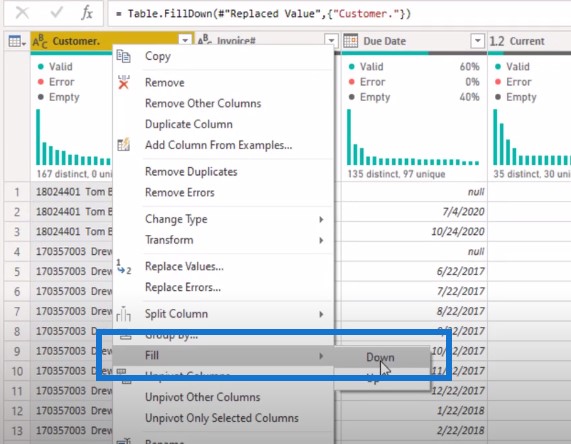
This is how you can see all the names go down across this column.
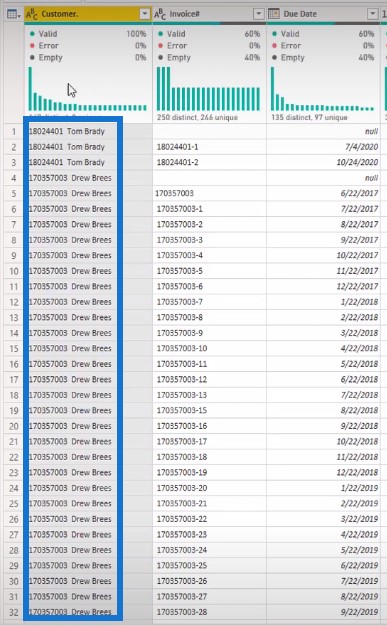
Filtering Columns
I also filtered some more rows here and filtered by invoice number to remove those that were blank.
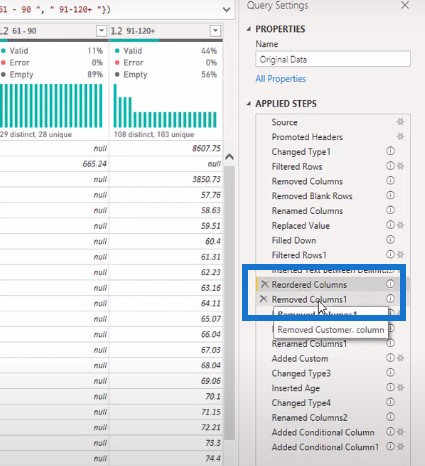
I added another Customer column where I copied the column in the screenshot above and got rid of the numbers before the name.
I also reordered the columns. I moved that new customer column from the very end to the very beginning. And then I removed the Customer column that had the dot or the period at the end of it. So now I just have one clear Customer column without the numbers to the left of it.
Then the next step is Inserted Sum, where I took all the values from Current, 1 – 30, 31 – 60, 61 – 90, and 91 to 120. I added all of those columns together to get the custom column called Addition.

Another way to do this is to highlight all the columns, go to Add Column tab, click Standard, and then click on Add.
This would give you the Addition field without having to type in anything into power query.
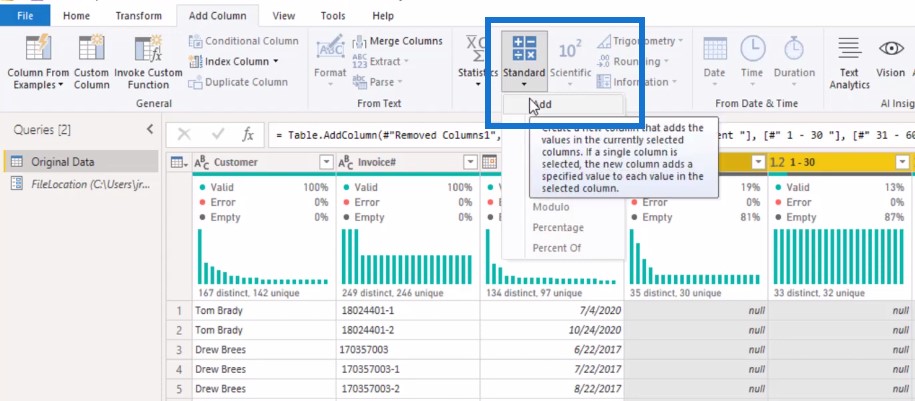
And then I removed all those original columns: Current, 1 – 30, 31 – 60, 61 – 90, and 91 – 120. After that, I just renamed it Balance.
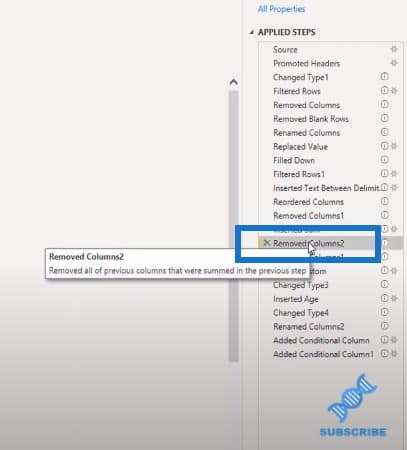

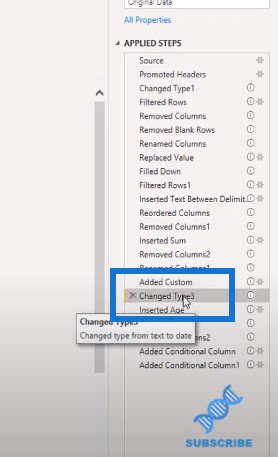
The next step is to add a custom column. For this challenge, it was January 21st when this original data was taken from the customer.

The date automatically came up as a text function, so I changed it to a date function with this step.
Creating The Age Column
To create an age column, I highlighted Today’s Date and Due Date. Then I went to the Add Column tab and clicked on Subtract Days.
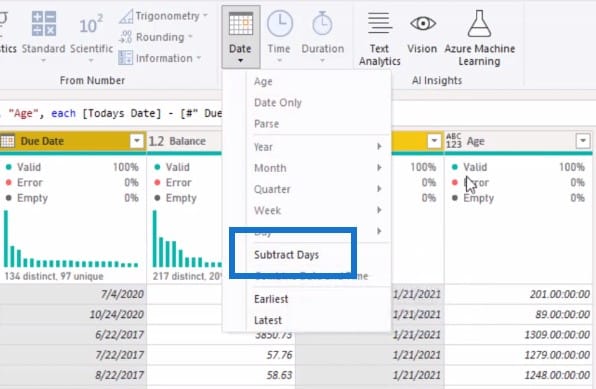
The next step is to change this into a whole number.
And then I renamed the column from Age to Days Aged. Then I added two more conditional columns. One is for the aging column to recategorize these items.

The second conditional column would help sort the aging column so they would show in sequential order.
***** Related Links *****
Change Date Formats Using The Power Query Editor
Calendar Layouts To Tabular Format Using Power Query
Formatting DAX Code In Power BI
Conclusion
So this is how I came up with my solution for this Problem of the Week. Once I hit Close and apply, these are the results.

I hope you enjoyed going through the solution with me. If you enjoyed this tutorial on how you can format data in Power BI, please subscribe to the Enterprise DNA TV channel for similar content.
Jarrett
[youtube https://www.youtube.com/watch?v=zkf-a1u4uvs?rel=0&w=784&h=441]


