Enterprise DNA has released a new set of showcases built to show the amazing amount of insights Power BI can deliver.
As always, these showcases cover different areas ranging from customer engagement in an email marketing scenario, to HR consultation insights. The demonstrations can be downloaded by members from the Showcases Module within Enterprise DNA Online.
Here’s an overview of what each showcase is all about.
Customer Engagement
It’s undeniable how important it is to understand the correlation between sales and customer engagement while running an email marketing campaign. This showcase demonstrates exactly how to achieve that.
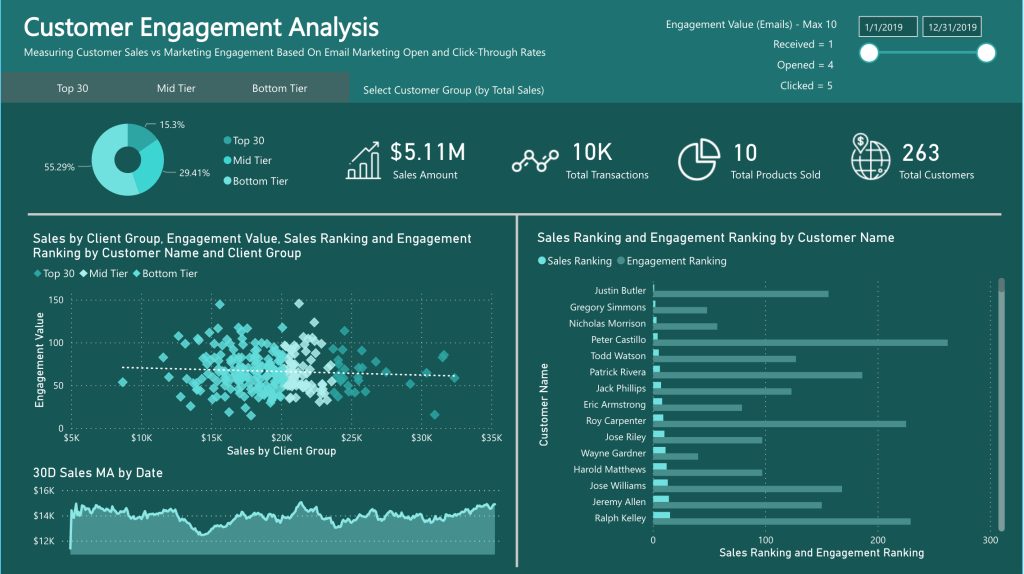
This showcase measures customer sales versus marketing engagement based on email marketing and click-through rates.
With the ability to sort through the top 30, mid-tier and bottom-tier customers, you can have a deeper understanding of what drives the numbers for each customer group.
It’s also helpful to see the values at a glance, especially since they’re completely dynamic and change as you filter data based on those 3 customer groups.
The visualization showing the sales by client group, engagement value, sales ranking and engagement ranking can be filtered as well, while the visualization for sales and engagement ranking give in-depth insights into each customer.
HR Consultation Insights
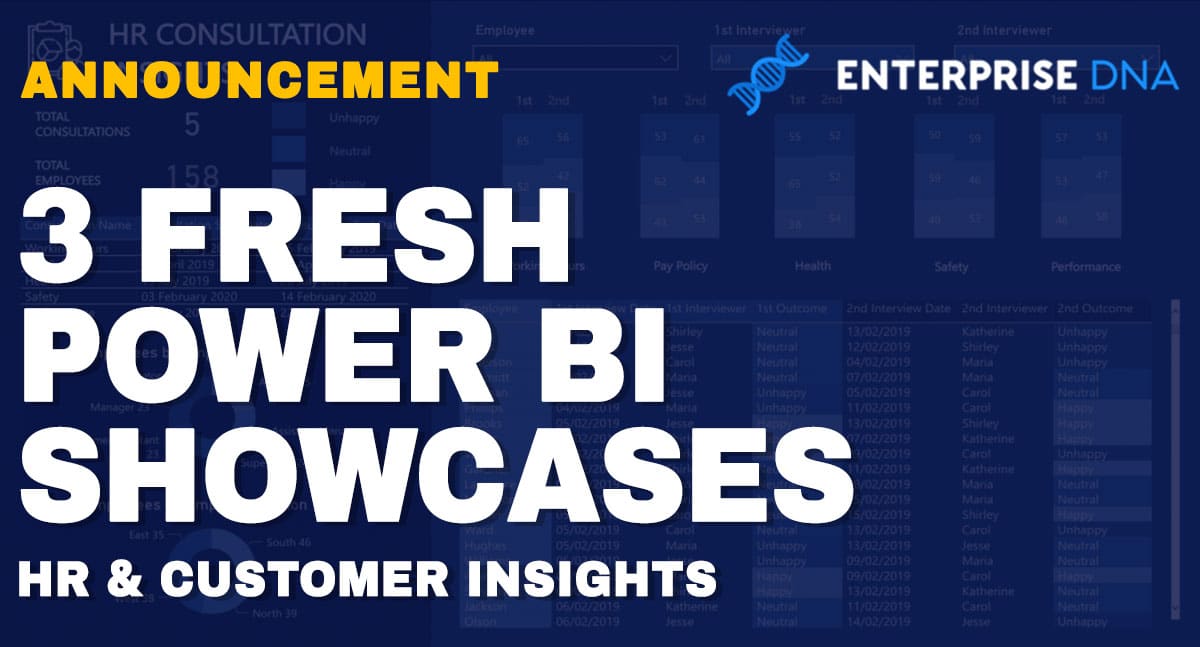
The 2nd showcase digs deep into HR insights this time. It assesses individual employees’ reactions to consultations and looks at the trends for each interviewer.
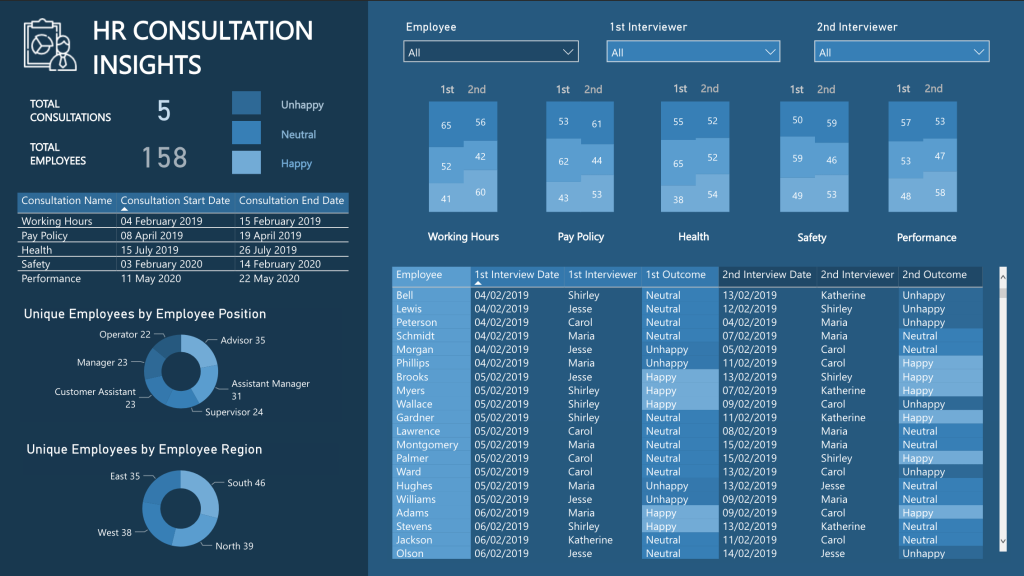
This showcase is cleanly laid out, with the total consultations and total employees clearly displayed on the left pane. The graph in the same pane display valuable data like the type of consultation, as well as the start date and end date for each of them. The visualization gives a quick look at who were involved in these consultations and where they’re from.
In the main pane on the right, it gives a really thorough look at how each employee felt about these consultations. The dropdown filters on top also allow you to zoom into specific employees and interviewers, giving you more detailed data.
Customer Insights
Just like the 1st showcase, this demonstration looks at sales and customer engagement from an email marketing campaign. However, this looks at more aspects of the scenario.
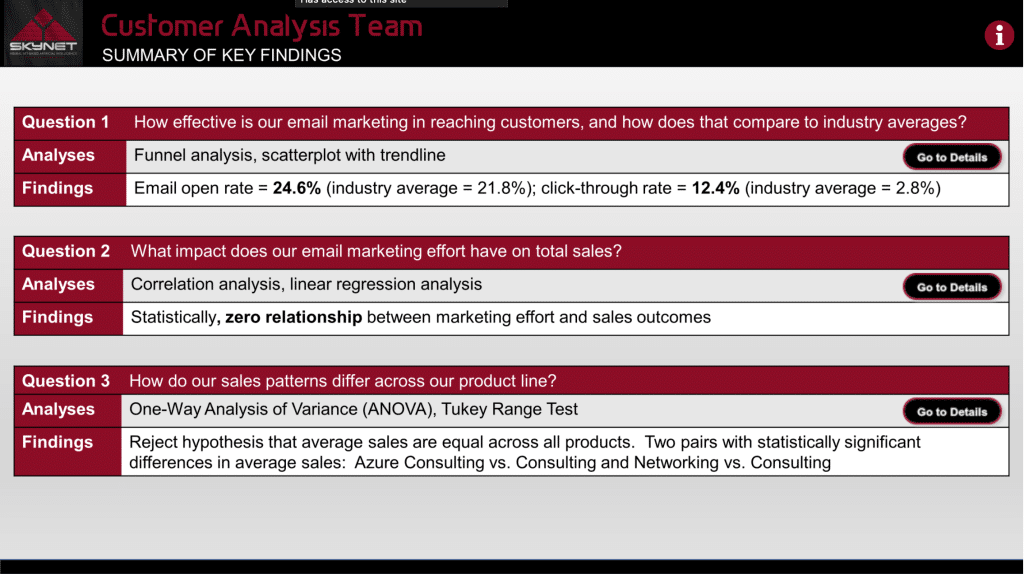
It opens up with a summary of the key findings based on the data within the report. As you can see, it focuses mainly of 3 specific questions and links to the reports that display the data.
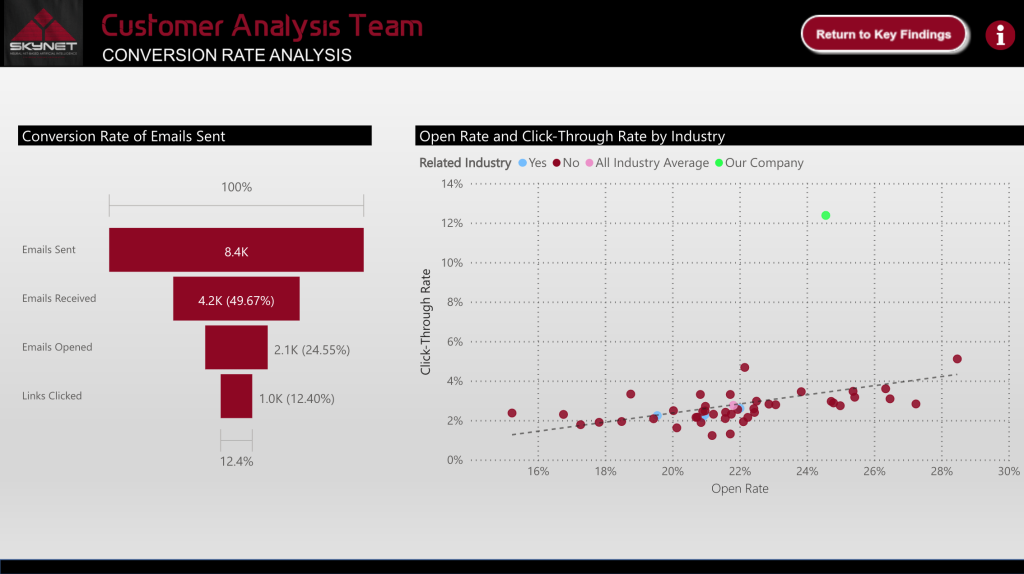
For question 1 for example, clicking on the “Go to Details” button leads to the Conversion Rate Analysis.
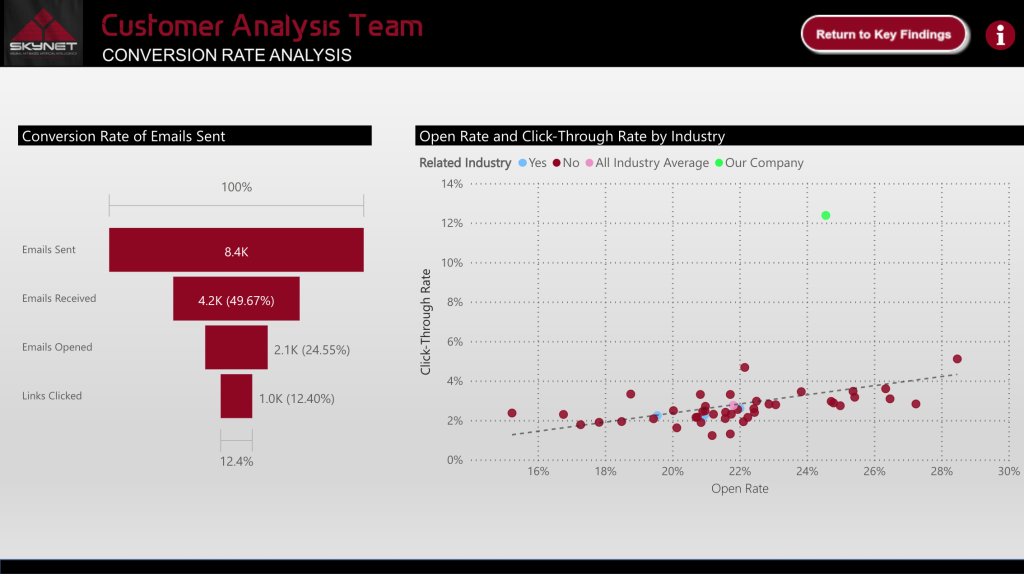
The analysis for question number 2 is showcased in the Correlation and Regression Analysis linked to the Go to Details button.
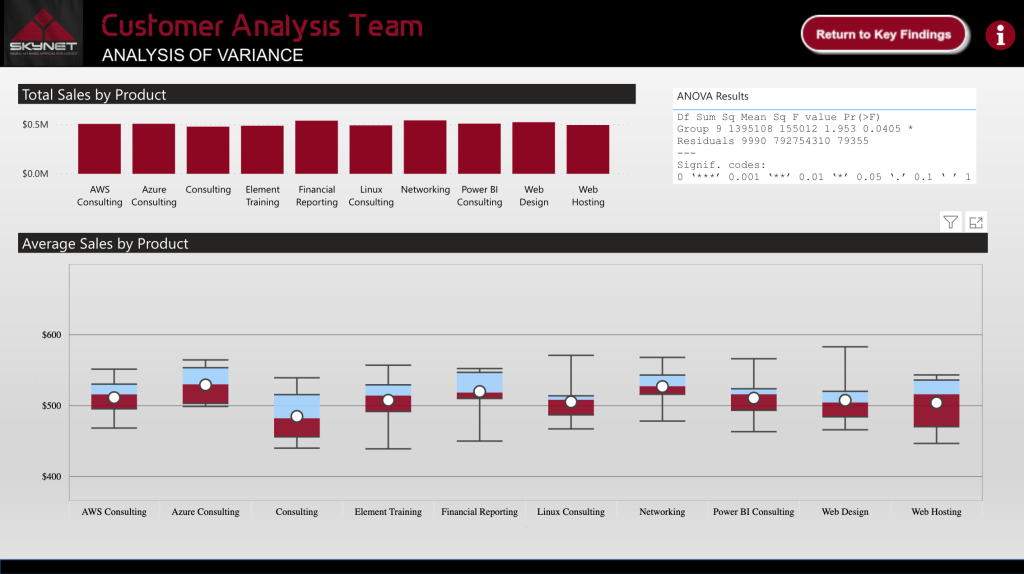
As for question number 3, clicking on the Go to Details button leads you to the Analysis of Variance shown below.
The “Return to Key Findings” button on top of each page also leads you right back to the Summary of Key Findings found on the first page of the report.
Power BI Showcase
Reports like the ones shown above are worth having in your Power BI arsenal. This puts a high value to the Power BI Showcase, a module that’s exclusive to members of Enterprise DNA Online.
The Power BI Showcase is a collection of downloadable reports that covers a huge number of applications. These applications include various business function, industries and scenarios that closely mimic what you might be dealing with in real life.
These tutorials and demonstrations allow you to really dive deep into the capabilities of Power BI. So if you really want to master Power BI’s different tools and applications, you can think of these showcases as the key to your own development that will help you advance in whatever field you specialize in.
Enterprise DNA Team

