The TREATAS function in DAX is one of the most interesting DAX formulas that you can utilise inside your Power BI models. You may watch the full video of this tutorial at the bottom of this blog.
It has a very specific usage that can be beneficial if you are looking to simplify your data model and DAX formulas.
In this tutorial, I’m going to show you how we can create a virtual relationship within a formula. You don’t need to create any physical relationships in your data model. You can actually link two tables or two columns from two different tables utilizing this TREATAS function.
This example is part of the Learning Summit I had around Revenue Budgeting with Enterprise DNA members and other attendees.
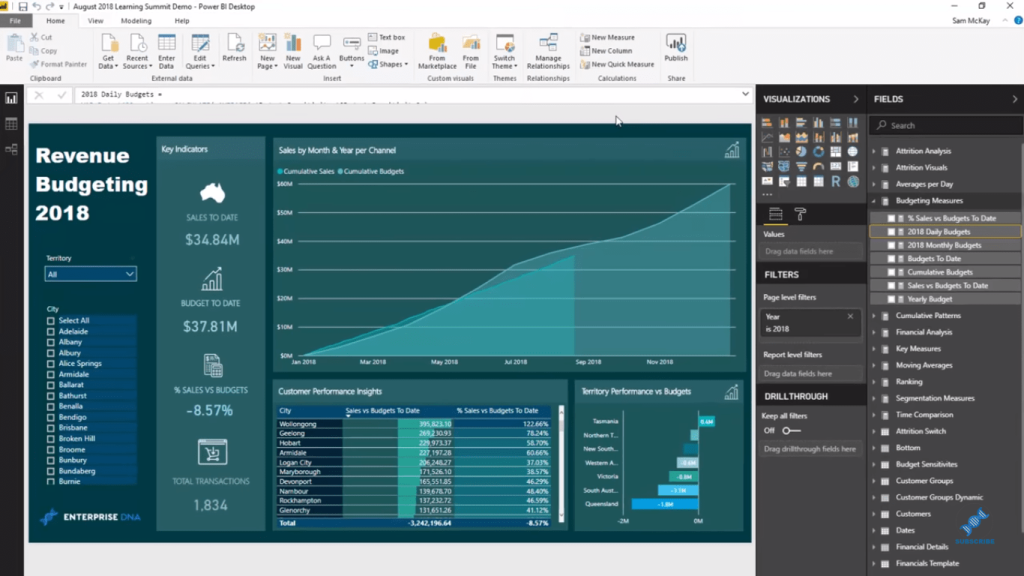
This technique that I’ll show you is very important when managing budgets versus actual results inside Power BI. You can create this analysis efficiently by combining the model and the correct DAX calculations.
So here we want to analyze how this is doing through time and we’re showing it cumulatively. We can also select and focus on any specific territory, individual element, or lookup table and see how we’re going versus our budgets.
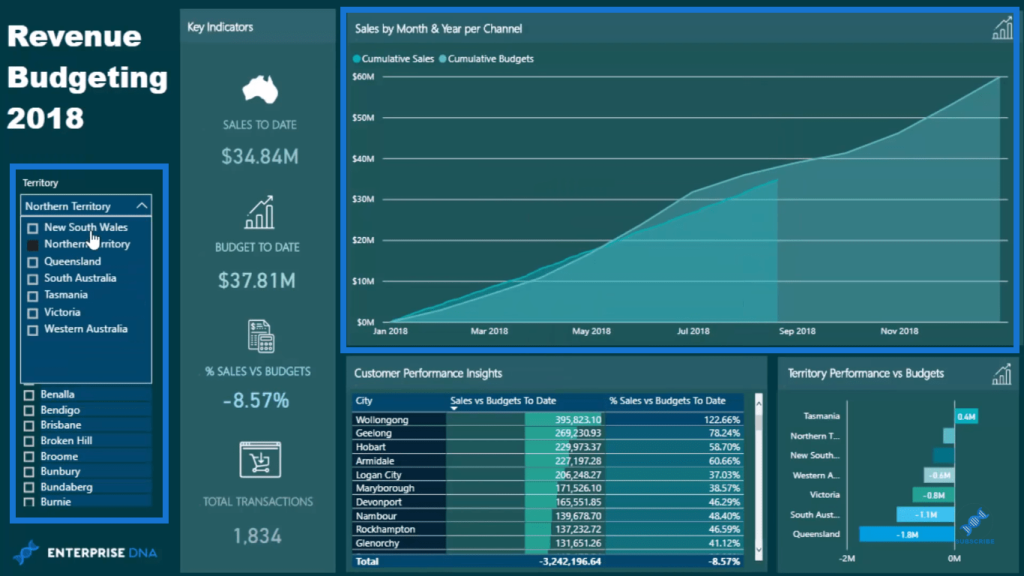
The interesting thing about this tutorial is how the model is structured. You can efficiently structure it this way by understanding what virtual relationships do inside Power BI. So before we go into our Power BI TREATAS calculations, let’s have a look at the data model.
Model Structure For Virtual Relationships
Our model here is quite detailed, but for this tutorial, let’s focus on the virtual tables. If you look at the Regional Budgets table, you’ll notice that it has no physical relationship between anything.
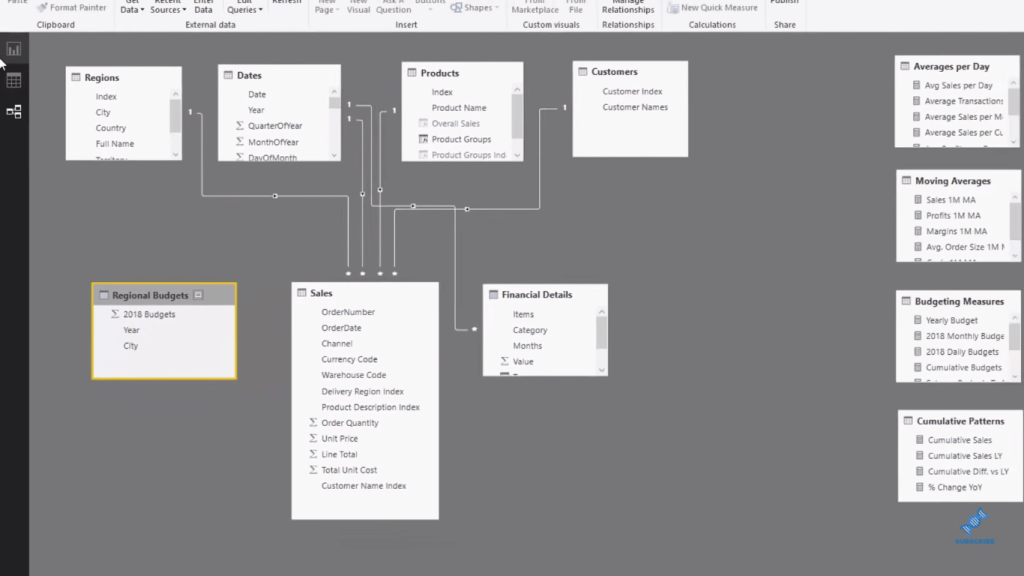
Virtual tables like this will do the hard work for us. They will create the correct filters for us in accordance to the calculations we want to show based on our selections.
Taking a closer look at our Regional Budgets, you’ll see that it’s broken down by City. We have the actual budget for 2018 per city. This was created with a formula, but I won’t go into it now because it’s a topic of another tutorial.
But if you look at this table, we have actual information that’s happening every day and these results are at a yearly granularity.
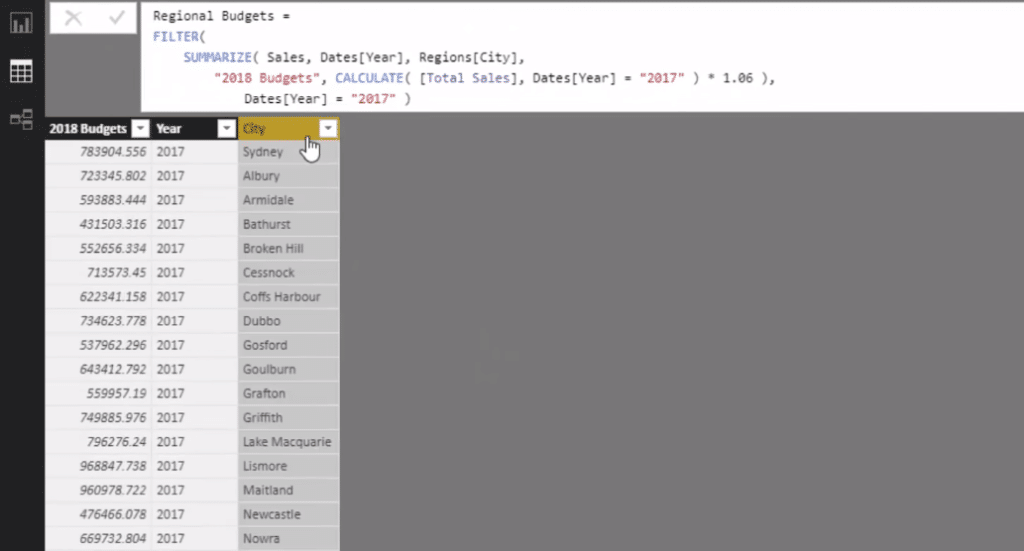
We need to be able to break these down and allocate them across the year. And so we have another table, which I called the Budget Sensitivity table.
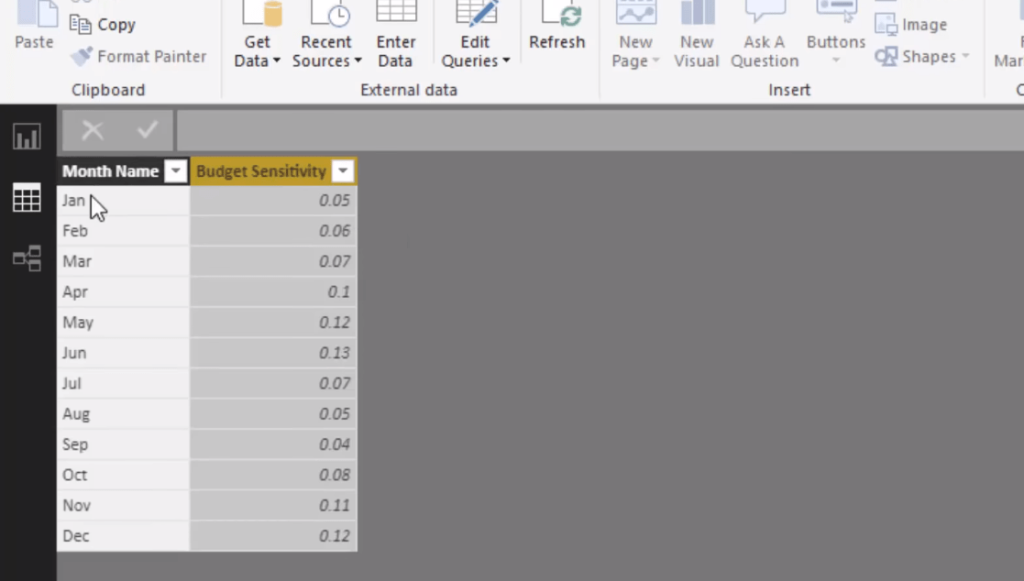
To allocate a yearly budget, I’ve given every month a sensitivity factor. This is going to total to one because the Budget Sensitivity is going to break up a hundred percent down into its individual parts per month.
And if we go back to our model, you’ll see that this Budget Sensitivity table is not connected to anything as well. There’s no physical relationship.
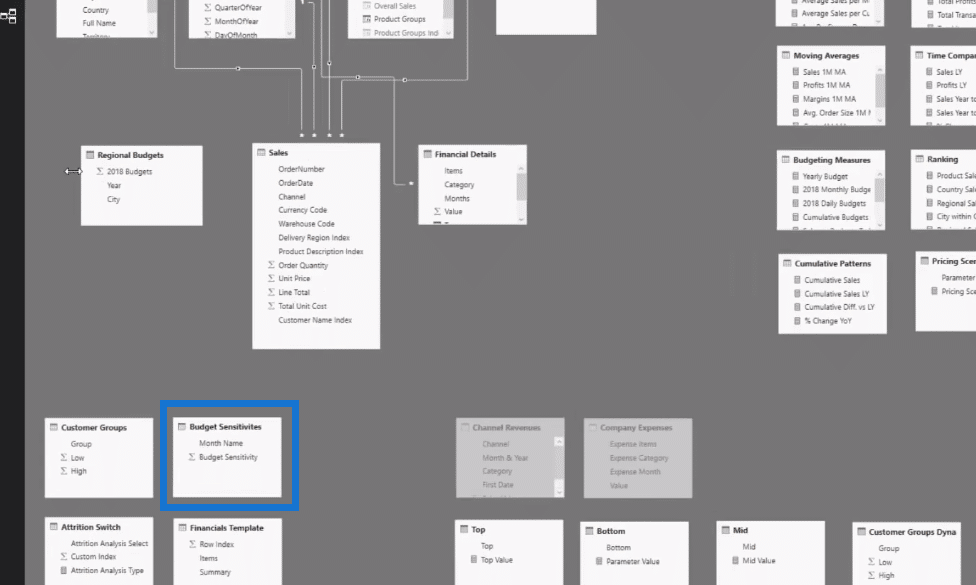
This technique is going to bring a lot of efficiencies to your model. You don’t have lines going everywhere. You don’t have to create additional tables to create the correct relationships. We can do this virtually with the TREATAS.
So in terms of the setup, we have budgets at a yearly level and we can break them down into a monthly level because we have the sensitivity. Now we need to work out the number to a daily level because that’s how we calculate a cumulative total.
Using TREATAS To Create Virtual Relationships
First of all, we need to create a calculation that can be filtered by something in the Region’s table. If you can understand how the Power BI TREATAS works, you’re going to be in a great spot to simplify your models and create these virtual relationships.
So in our first formula, the Yearly Budget, we sum up the yearly total but we’re also able to filter that yearly total by something in the city or the Region’s table. This is because we’re linking up the City column inside the Regional Budgets table with the City column inside the Regions table.

But in this case, we only have the yearly information. We need to break it down by month, and so this is where the sensitivity comes in. I created another measure called 2018 Monthly Budgets.
Here we’re creating a virtual relationship between the Date table, which is the Short Month column and the Month Name column inside the Budget Sensitivity table.
If in a particular context, it might be like month and year, this Budget Sensitivity is going to be filtered based on that. That’s exactly what goes down in the IF logic of this measure. And then the Yearly Budget is multiplied by BudgetAllocation.

Lastly, we’ll break it down by day to do the cumulative total of it. Since we have the Monthly information, logically all we have to do is multiply or divide the Monthly information by how many days are in a particular month. That’s going to break it down at a daily level.
The first part of this daily level formula, 2018 Daily Budgets, is very similar to what we did with the monthly level. Then, we work out how many days in any particular month or context we might be on, and that’s what’s happening in our variable (VAR) for DaysInMonth.

We use COUNTROWS in the Dates table, remove the context on Dates with the ALL function, but then add it back for the month and year using the VALUES function. So it’s saying that if we’re in January, they’re going to be 31 days. And then we use the same IF logic, but we multiply it by 1 then divide it by 31 (for January).
***** Related Links *****
Deep Dive Into The TREATAS Function – Virtual Relationships For Power BI
Allocate Monthly Forecasts Across Daily Results In Power BI Using DAX
Using Power BI DAX Functions To Deal With Products That Have Changing Prices Overtime
Conclusion
Virtual relationships can be utilized in many different ways. There are certainly many other scenarios where this technique could be utilized, but this is a very good example. We created virtual relationships inside of Power BI with the TREATAS function.
The most logical reason for using this function and the reason why I use it quite heavily in a lot of models that I develop is it really simplifies everything that you’re doing in the backend of your model; in the data model of your Power BI report.
Instead of having a range of relationships that can bring a number of complexities into your development, the TREATAS function can really simplify the data model aspect and the relationships that can be built into your DAX formulas.
I hope you enjoy working through this one!
Sam
***** Learning Power BI? *****
FREE COURSE – Ultimate Beginners Guide To Power BI
FREE COURSE – Ultimate Beginners Guide To DAX
FREE – 60 Page DAX Reference Guide Download
FREE – Power BI Resources
Enterprise DNA Membership
Enterprise DNA Online
Enterprise DNA Events
[youtube https://www.youtube.com/watch?v=Ea0VBWw8-mg?rel=0&w=784&h=441]


